. 2024 Jun;109(6):899-914.
doi: 10.1113/EP091670. Epub 2024 Mar 30.

Are coagulation profiles in Andean highlanders with excessive erythrocytosis favouring hypercoagulability?

Affiliations

Are coagulation profiles in Andean highlanders with excessive erythrocytosis favouring hypercoagulability?

Benoit Champigneulle et al. Exp Physiol. 2024 Jun.

Abstract

Chronic mountain sickness is a maladaptive syndrome that affects individuals living permanently at high altitude and is characterized primarily by excessive erythrocytosis (EE). Recent results concerning the impact of EE in Andean highlanders on clotting and the possible promotion of hypercoagulability, which can lead to thrombosis, were contradictory. We assessed the coagulation profiles of Andeans highlanders with and without excessive erythrocytosis (EE+ and EE-). Blood samples were collected from 30 EE+ and 15 EE- in La Rinconada (Peru, 5100-5300 m a.s.l.), with special attention given to the sampling pre-analytical variables. Rotational thromboelastometry tests were performed at both native and normalized (40%) haematocrit using autologous platelet-poor plasma. Thrombin generation, dosages of clotting factors and inhibitors were measured in plasma samples. Data were compared between groups and with measurements performed at native haematocrit in 10 lowlanders (LL) at sea level. At native haematocrit, in all rotational thromboelastometry assays, EE+ exhibited hypocoagulable profiles (prolonged clotting time and weaker clot strength) compared with EE- and LL (all P < 0.01). At normalized haematocrit, clotting times were normalized in most individuals. Conversely, maximal clot firmness was normalized only in FIBTEM and not in EXTEM/INTEM assays, suggesting abnormal platelet activity. Thrombin generation, levels of plasma clotting factors and inhibitors, and standard coagulation assays were mostly normal in all groups. No highlanders reported a history of venous thromboembolism based on the dedicated survey. Collectively, these results indicate that EE+ do not present a hypercoagulable profile potentially favouring thrombosis.

Keywords: blood coagulation; chronic mountain sickness; excessive erythrocytosis; hypoxia; thromboelastometry.


Conflict of interest statement

The authors declare no conflicts of interest.

Figures
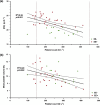
FIGURE 1
FIGURE 1
Platelet count in highlander participants permanently living at 5100 m a.s.l., without (EE−) and with (EE+) excessive erythrocytosis, presented an inverse linear relationship with the haemoglobin concentration ([Hb]) (a) and the mean platelet volume (b). Normal ranges (lower and upper limit values) for each parameter are represented by the dotted lines.
FIGURE 2
FIGURE 2
Plasma levels of clotting factors and inhibitors are similar among the lowlander (LL, 210 m a.s.l.), highlander without (EE−) and with excessive erythrocytosis (EE+) groups (5100 m a.s.l.). The bar graphs represent mean values with SD in each group, with individual values (black dots for men, and black triangles for women only in the LL group). Normal ranges (lower and upper limit values) for each parameter are represented by the dotted lines. * < 0.05, ** < 0.01 and *** < 0.001. Individual missing data, only in the EE+ group: factor II (n = 3), factor V (n = 2), factor VII (n = 3), factor VIII (n = 4), factor IX (n = 3), factor X (n = 1), factor XI (n = 4), factor XII (n = 5), factor XIII (n = 3), antithrombin (n = 1), protein C (n = 3) and free protein S (n = 3).
FIGURE 3
FIGURE 3
At native haematocrit, highlanders permanently living at 5100 m a.s.l. with excessive erythrocytosis (EE+) exhibited a large increase in clotting time compared with highlanders without excessive erythrocytosis (EE−) and lowlanders (LL) at 210 m a.s.l., which was almost totally corrected when ROTEM tests were secondarily performed at normalized haematocrit (40%) after haemodilution with autologous platelet‐poor plasma. (a–c) Clotting time in EXTEM (a), INTEM (b) and FIBTEM (c) assays. (d) Comparisons between APTEM and EXTEM clotting times at native haematocrit in each subgroup of participants. Boxplots represent the median with 25th and 75th percentiles (lower and upper hinges). Whiskers extend from the corresponding hinge to the highest or lowest value not further than 1.5 × interquartile range. Horizontal dashed lines represent the reference ranges established at sea level (Lang et al., 2005). ** < 0.01 and *** < 0.001.
FIGURE 4
FIGURE 4
At native haematocrit, highlanders permanently living at 5100 m a.s.l. with excessive erythrocytosis (EE+) exhibited a large reduction in maximal clot firmness compared with highlanders without excessive erythrocytosis (EE−) and lowlanders (LL) at 210 m a.s.l., which was not corrected, except in the FIBTEM assay, when ROTEM assays were secondarily performed at normalized haematocrit (40%) after haemodilution with autologous platelet‐poor plasma. (a–c) Maximal clot firmness in EXTEM (a), INTEM (b) and FIBTEM (c) assays. (d) Comparisons between APTEM and EXTEM maximal clot firmness at native haematocrit in each subgroup of participants. Boxplots represent the median with 25th and 75th percentiles (lower and upper hinges). Whiskers extend from the corresponding hinge to the highest or lowest value not further than 1.5 × interquartile range. Horizontal dashed lines represent the reference ranges established at sea level (Lang et al., 2005). * < 0.05, ** < 0.01 and *** < 0.001.
FIGURE 5
FIGURE 5
At native haematocrit, in the overall population, only whole‐blood fibrinogen concentration, and not plasma concentration, showed a significant linear relationship with maximal clot firmness in FIBTEM assay. Abbreviations: EE−, highlanders without excessive erythrocytosis; EE+, highlanders with excessive erythrocytosis; LL, lowlanders. Triangles represent individual values for women (LL group only).
FIGURE 6
FIGURE 6
Thrombin generation patterns are similar among the groups, with a significant longer lag time only in highlanders with excessive erythrocytosis (EE+; 5100 m a.s.l.) versus lowlanders (LL; 210 m a.s.l.). Abbreviations: EE−, highlanders without excessive erythrocytosis; EE+, highlanders with excessive erythrocytosis; LL, lowlanders. (a) Visual reconstruction of individual thrombin generation curves (dashed lines), with mean curves (thick lines). The bar graphs represent the mean values with SD in each group, with individual values (black dots for men, and black triangles for women only in the LL group) for lag time (b), time to peak (c), endogenous thrombin potential (d) and peak thrombin (e). * < 0.05.
FIGURE 7
FIGURE 7
Summary of the coagulation work‐up performed and main conclusions regarding coagulation pattern in highlanders with (EE+) and without (EE−) excessive erythrocytosis living permanently above 5000 m a.s.l. in the highest city in the world (La Rinconada, Peru, 5100–5300 m a.s.l.). Abbreviations: EE+, highlanders with excessive erythrocytosis; EE−, highlanders without excessive erythrocytosis; [Hb], haemoglobin concentration; Hct, haematocrit; LL, lowlanders; PLT, platelet; PPP, platelet‐poor plasma; ROTEM, rotational thromboelastometry.

Similar articles

References

    1. Azad, P. , Stobdan, T. , Zhou, D. , Hartley, I. , Akbari, A. , Bafna, V. , & Haddad, G. G. (2017). High‐altitude adaptation in humans: From genomics to integrative physiology. Journal of Molecular Medicine, 95, 1269–1282. - PMC - PubMed
    1. Beall, C. M (2007). Two routes to functional adaptation: Tibetan and Andean high‐altitude natives. Proceedings of the National Academy of Sciences, 104, (suppl_1), 8655–8660. - PMC - PubMed
    1. Bontekoe, I. J. , van der Meer, P. F. , & Korte, D. (2019). Thromboelastography as a tool to evaluate blood of healthy volunteers and blood component quality: A review. Vox Sanguinis, 114(7), 643–657. - PubMed
    1. Champigneulle, B. , Brugniaux, J. V. , Stauffer, E. , Doutreleau, S. , Furian, M. , Perger, E. , Pina, A. , Baillieul, S. , Deschamps, B. , Hancco, I. , Connes, P. , Robach, P. , Pichon, A. , & Verges, S. (2024). Expedition 5300: Limits of human adaptations in the highest city in the world. The Journal of Physiology, Advance online publication. 10.1113/jp284550 - DOI - PubMed
    1. Champigneulle, B. , Hancco, I. , Hamard, E. , Doutreleau, S. , Furian, M. , Brugniaux, J. V. , Bailly, S. , & Vergès, S. (2022). Excessive erythrocytosis and chronic mountain sickness in the highest city in the world: A longitudinal study. Chest, 161(5), 1338–1342. - PubMed