. 2024 Apr 22;4(4):100743.
doi: 10.1016/j.crmeth.2024.100743. Epub 2024 Mar 29.

Single-cell adhesive profiling in an optofluidic device elucidates CD8+ T lymphocyte phenotypes in inflamed vasculature-like microenvironments

Affiliations

Single-cell adhesive profiling in an optofluidic device elucidates CD8+ T lymphocyte phenotypes in inflamed vasculature-like microenvironments

Camila P Camargo et al. Cell Rep Methods. .

Abstract

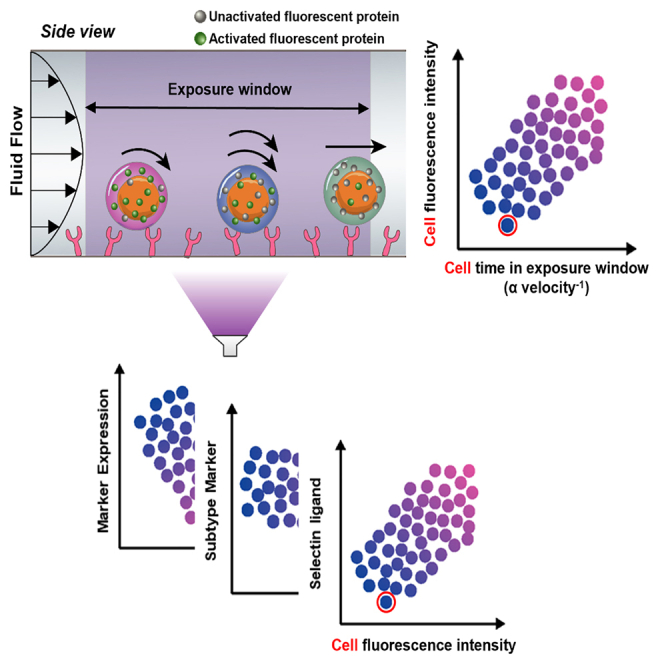
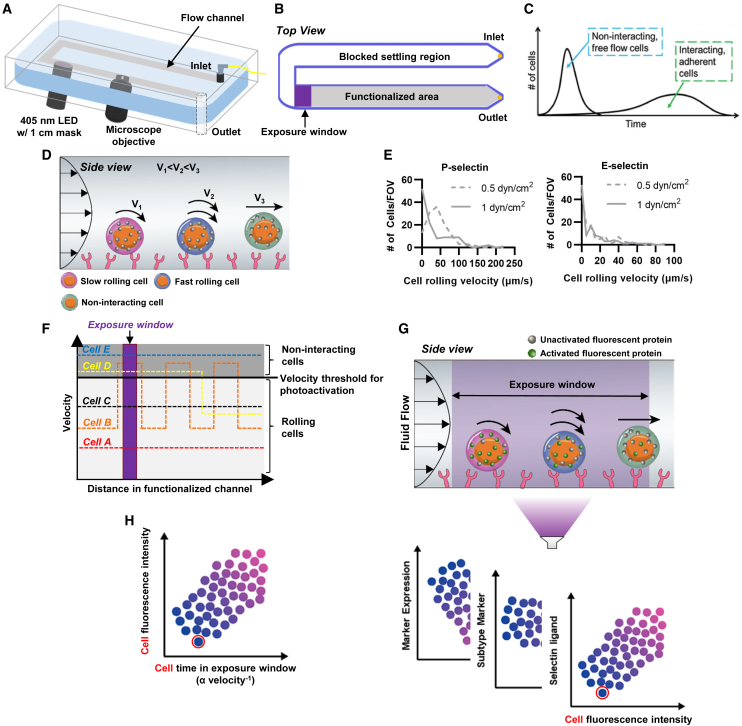
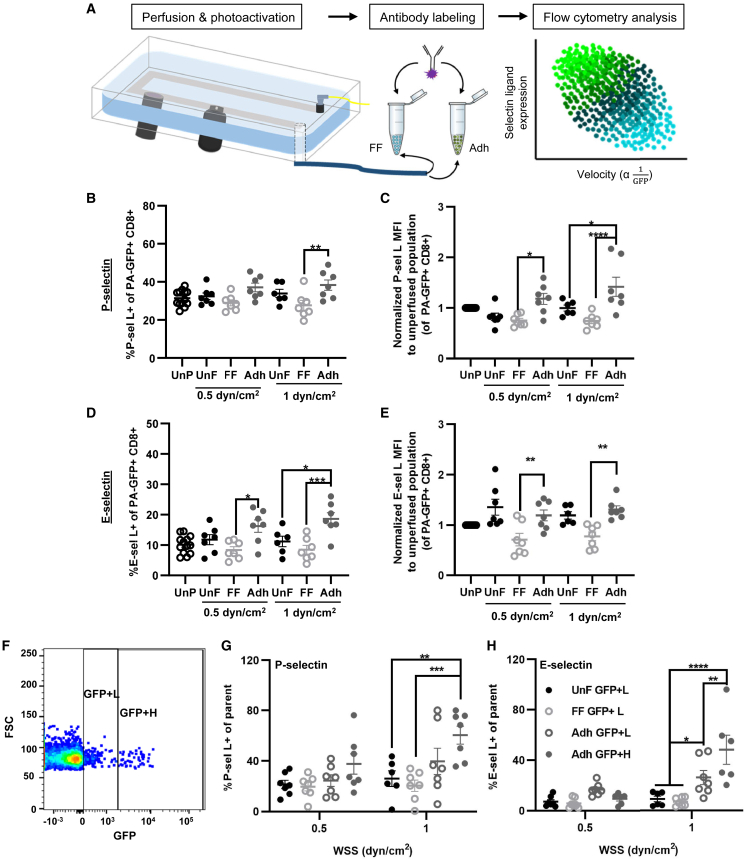
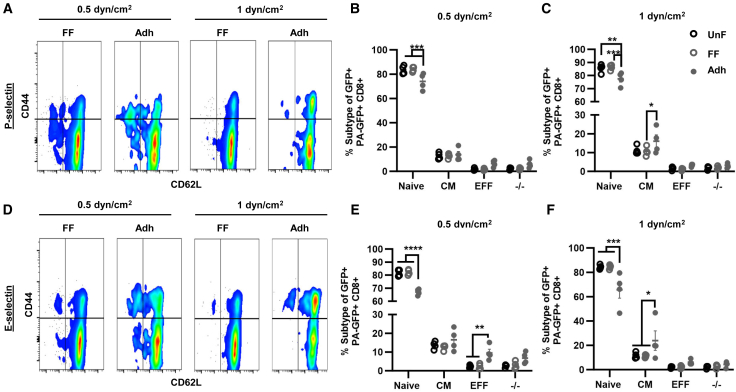
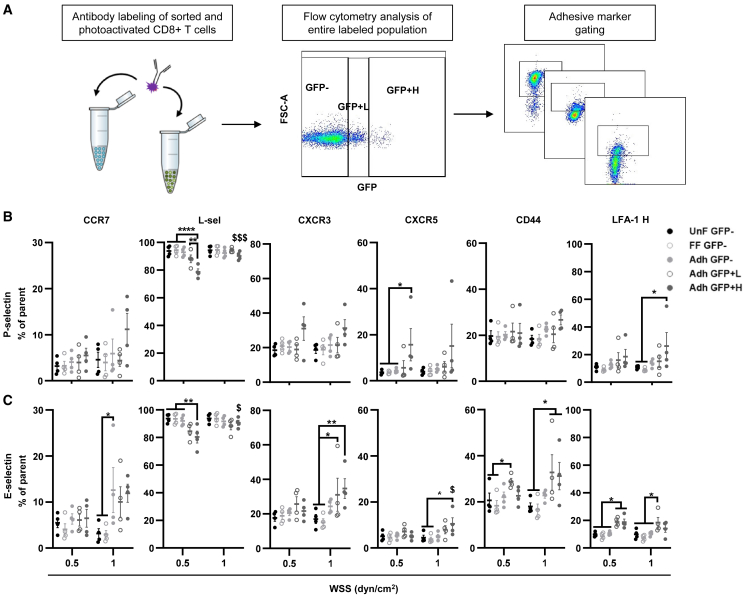
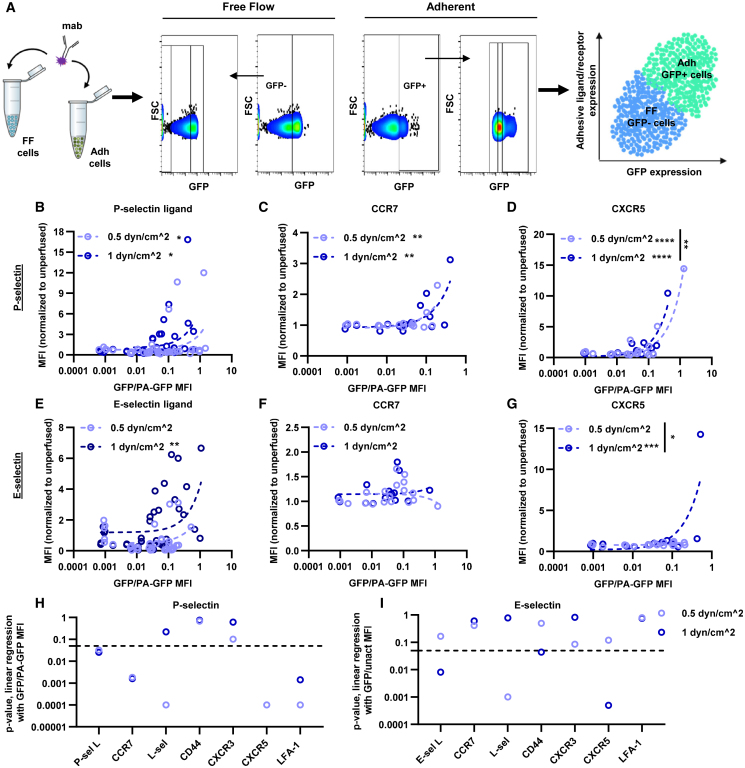
Tissue infiltration by circulating leukocytes occurs via adhesive interactions with the local vasculature, but how the adhesive quality of circulating cells guides the homing of specific phenotypes to different vascular microenvironments remains undefined. We developed an optofluidic system enabling fluorescent labeling of photoactivatable cells based on their adhesive rolling velocity in an inflamed vasculature-mimicking microfluidic device under physiological fluid flow. In so doing, single-cell level multidimensional profiling of cellular characteristics could be characterized and related to the associated adhesive phenotype. When applied to CD8+ T cells, ligand/receptor expression profiles and subtypes associated with adhesion were revealed, providing insight into inflamed tissue infiltration capabilities of specific CD8+ T lymphocyte subsets and how local vascular microenvironmental features may regulate the quality of cellular infiltration. This methodology facilitates rapid screening of cell populations for enhanced homing capabilities under defined biochemical and biophysical microenvironments, relevant to leukocyte homing modulation in multiple pathologies.

Keywords: CP: biotechnology; CP: immunology; cell adhesion; homing; inflamed vasculature; lymphocyte; microfluidic system; photoactivation; selectins; single-cell.


Conflict of interest statement

Declaration of interests The authors declare no competing interests.

Figures

None
Graphical abstract
Figure 1
Figure 1
Optofluidic adhesion chromatography microfluidic system for in vitro single-cell adhesive profiling of hemodynamic microenvironment-regulated mechanisms of CD8+ T cell homing (A) Microfluidic system schematic. (B) Top view indicating the UnF settling region, light exposure window, and functionalized substrate area of the adhesion chromatography channel. (C) Schematic of elution times of cells that do (Adh) or do not (FF) exhibit adhesion to the functionalized substrate during perfusion and how they are fractionated based on their elution time from the perfusion channel. (D) Schematic of a side view of perfused cells inside the hemodynamics-mimicking microfluidic device exhibiting varying adhesive qualities, including slow and fast rolling adhesion and no adhesion. (E) Histograms of the rolling velocity of CD8+ T cells interacting with 10 μg/mL P-selectin- or 10 μg/mL E-selectin-functionalized substrates at various WSSs. Data are pooled from four independently run experiments. (F) Schematic of various potential rolling qualities and how they may persist or vary along the selectin-functionalized substrate length. Cell A is a slow-rolling cell that exhibits sustained adhesion along the channel length. Cell B exhibits slow rolling that is not persistent, changing between slow rolling and FF velocities along the selectin-functionalized substrate length. Cell C exhibits faster rolling adhesion that is sustained along the selectin-functionalized substrate length. Upon entering the channel region containing the selectin-functionalized substrate, Cell D is not Adh and travels at the FF velocity but initiates and sustains rolling adhesion. Cell E does not interact with the adhesive substrate, so it travels through the selectin-functionalized substrate length at the FF velocity. (G and H) Side view of perfusion through a light-source-illuminated window to photoactivated cells in proportion to their velocity in flow on selectin-functionalized substrates in the exposure window (G) to allow for single-cell fluorescent labeling of cell velocities (G), enabling the comparison of cellular characteristics associated with velocities of rolling cell adhesion (H).
Figure 2
Figure 2
Photoactivation of PA-GFP CD8+ T cells is spatiotemporally controlled (A) Fluorescent images of PA-GFP+ CD8+ T cell GFP levels with increasing 405-nm exposure time at a power output of 265 mW/cm2. Scale bar, 20 μm. (B and C) Flow cytometrically measured CD8+ T cells’ unactivated signal and activated signal (GFP) (B) and GFP/unactivated signal ratios (C) per cell and at various times of 405-nm laser exposure at a power intensity of 265 mW/cm2. (D) Representative flow cytometry scatterplots of GFP expression with increased exposure time at a power intensity of 265 mW/cm2. (E and F) Percentage of GFP+ cells (E) and normalized mean fluorescence to the unactivated signal (F) across various exposure times and power outputs. Data represent mean ± SEM from three independently run experiments.
Figure 3
Figure 3
Adh CD8+ T cells relative to FF cell fractions exhibit an increased extent of photoactivation (A) Standard curve relating GFP MFI normalized to the unactivated signal to cell velocity (calculated based on exposure time and length of the exposure window). Dashed lines show average cell velocity for different adhesion proteins at corresponding WSSs. (B) Distribution of single-cell rolling velocities on P- and E-selectin across different exposure time intervals for 10 μg/mL P-selectin and 2.5 μg/mL E-selectin. Shaded purple regions represent the upper experimental runtime limits at a prescribed WSS. Stacked bar graphs represent the proportion of cells below the runtime limits within each exposure time interval. (C) Flow cytometrically measured GFP/unact signal of FF or Adh fractions of CD8+ T cells recovered from a 10 μg/mL P-selectin- or 2.5 μg/mL E-selectin-functionalized channel integrated with a photoactivation window of 1 cm at a 265 mW/cm2 power output at 0.5 or 1 dyn/cm2. (D) Data in (C) represented as GFP mean fluorescence normalized to the unactivated signal. Data represent mean ± SEM from three or more independently run experiments. Statistical comparisons were performed by one-way ANOVA with Tukey’s multiple-comparisons test. ∗p < 0.05, ∗∗p < 0.01.
Figure 4
Figure 4
Slow rolling CD8+ T cells perfused at higher WSS exhibit an increased percentage of selectin ligand+ cells (A) Experiment schematic. (B) Flow cytometry scatterplot of P-selectin ligand expression of the UnP population and the Adh fraction recovered at 1 dyn/cm2. (C and D) Percentage of P-selectin ligand+ cells (C) and mean fluorescence normalized to the UnP population (D) of PA-GFP+ CD8+ T cells of UnP cells, perfused cells through an unfunctionalized (UnF) channel, or sorted cells through a 10 μg/mL P-selectin-functionalized channel at varying WSS levels. (E) Flow cytometry scatterplot of E-selectin ligand expression of the UnP population and the Adh fraction recovered at 1 dyn/cm2. (F and G) Percentage of E-selectin ligand+ cells (F) and normalized mean fluorescence to the UnP population (G) of PA-GFP+ CD8+ T cells UnP or perfused through an UnF channel or cells sorted through a 2.5 μg/ml E-selectin functionalized channel at varying WSS levels. (H) GFP+ cells divided into two different gates, PA1 (lower extent of photoactivation) and PA2 (higher extent of photoactivation). (I) P-selectin ligand expression of cells in gate PA1 or PA2 of cells perfused through an UnF channel or sorted through a 10 μg/mL P-selectin-functionalized channel. (J) E-selectin ligand expression of cells in gate PA1 or PA2 of cells perfused through an UnF channel or sorted through a 2.5 μg/mL E-selectin functionalized channel. Data represent mean ± SEM from three or more independently run experiments. Statistical comparisons were performed by one-way ANOVA (B–E) and two-way ANOVA (G and H) with Tukey’s multiple-comparisons test. ∗p < 0.05, ∗∗p < 0.01, ∗∗∗p < 0.001, ∗∗∗∗p < 0.0001.
Figure 5
Figure 5
More differentiated CD8+ T cell subtypes adhere to selectin-functionalized substrates Shown is the percentage of different CD8+ T cell subtypes of GFP+ cells perfused over an UnF channel or sorted FF and adherent (Adh) cells through a P-selectin-functionalized (A–C) or E-selectin-functionalized (D–F) channel at varying WSSs. Data represent mean ± SEM from four independently run experiments. Statistical comparisons were performed by two-way ANOVA with Tukey’s multiple comparisons test. ∗p < 0.05, ∗∗p < 0.01, ∗∗∗p < 0.001, ∗∗∗∗p < 0.0001.
Figure 6
Figure 6
Enrichment of CD8+ T cells varies depending on the inflamed-like vasculature microenvironment (A) PA-GFP CD8+ T cells were perfused, photoactivated, and sorted over selectin-functionalized substrates. Sorted cells were stained with fluorescently tagged antibodies, allowing for the comparison of marker expression on cells that were not photoactivated (GFP) or had low vs. high photoactivation (GFP+L vs. GFP+H). (B and C) Percentage of expression of different adhesion ligand/receptors of PA-GFP+ CD8+ T cells sorted through 10 μg/mL P-selectin (B) or 2.5 μg/mL E-selectin (C) at 0.5 or 1 dyn/cm2. Data represent mean ± SEM from four independently run experiments. Statistical comparisons were performed by two-way ANOVA with Tukey’s multiple-comparisons test. ∗, significance comparison between UnF GFP, FF GFP, Adh GFP, Adh GFP+L, and Adh GFP+H. $, significance of comparison between 0.5 and 1.0 dyn/cm2. ∗p < 0.05, ∗∗p < 0.01, ∗∗∗p < 0.001, ∗∗∗∗p < 0.0001.
Figure 7
Figure 7
Photoactivation reveals distinct relationships between single-cell velocities and adhesion ligand/receptor expression levels for CD8+ T cells adhering on P- and E-selectin (A) PA-GFP CD8+ T cells were perfused over 10 μg/mL P-selectin or 2.5 μg/mL E-selectin, photoactivated in a manner proportional to their average velocity, sorted into FF and Adh fractions, and gated using flow cytometry into unphotoactivated (PA) and photoactivated (PA+), respectively. Cells collected in each fraction were stained with fluorescently tagged antibodies, allowing correlation between ligand expression and photoactivation. (B–D) The extent of photoactivation (GFP/unact signal) of PA FF cells and PA+ rolling CD8+ T cells perfused over P-selectin related to the expression of P-selectin ligand (B), CCR7 (C), and CXCR5 (D). (E–G) The extent of photoactivation (GFP/unactivated signal) of rolling and FF CD8+ T cells perfused over E-selectin related to the expression of E-selectin ligand (E), CCR7 (F), and CXCR5 (G). (H and I) p values for non-zero slopes of the linear fit between the extent of photoactivation and various adhesion ligands and receptors of FF and rolling cells over P-selectin (H) and E-selectin (I). Flow cytometry gate-normalized data were pooled from four independent experiments and plotted with the corresponding linear fit. ∗p < 0.05, ∗∗p < 0.01, ∗∗∗p < 0.001, and ∗∗∗∗p < 0.0001 represent non-zero slopes of the linear fit with each population.

Similar articles

References

    1. He R., Hou S., Liu C., Zhang A., Bai Q., Han M., Yang Y., Wei G., Shen T., Yang X., et al. Follicular CXCR5-expressing CD8+ T cells curtail chronic viral infection. Nature. 2016;537:412–428. - PubMed
    1. Bogoslowski A., Butcher E.C., Kubes P. Neutrophils recruited through high endothelial venules of the lymph nodes via PNAd intercept disseminating Staphylococcus aureus. Proc. Natl. Acad. Sci. USA. 2018;115:2449–2454. - PMC - PubMed
    1. Alon R., Sportiello M., Kozlovski S., Kumar A., Reilly E.C., Zarbock A., Garbi N., Topham D.J. Leukocyte trafficking to the lungs and beyond: lessons from influenza for COVID-19. Nat. Rev. Immunol. 2021;21:49–64. - PMC - PubMed
    1. Tietz W., Allemand Y., Borges E., von Laer D., Hallmann R., Vestweber D., Hamann A. CD4+ T cells migrate into inflamed skin only if they express ligands for E-and P-selectin. J. Immunol. 1998;161:963–970. - PubMed
    1. Hirata T., Furie B.C., Furie B. P-E-and L-selectin mediate migration of activated CD8+ T lymphocytes into inflamed skin. J. Immunol. 2002;169:4307–4313. - PubMed

Publication types