. 2024 Mar 30;15(1):2779.
doi: 10.1038/s41467-024-47108-8.

TM4SF19-mediated control of lysosomal activity in macrophages contributes to obesity-induced inflammation and metabolic dysfunction

Affiliations

TM4SF19-mediated control of lysosomal activity in macrophages contributes to obesity-induced inflammation and metabolic dysfunction

Cheoljun Choi et al. Nat Commun. .

Abstract

Adipose tissue (AT) adapts to overnutrition in a complex process, wherein specialized immune cells remove and replace dysfunctional and stressed adipocytes with new fat cells. Among immune cells recruited to AT, lipid-associated macrophages (LAMs) have emerged as key players in obesity and in diseases involving lipid stress and inflammation. Here, we show that LAMs selectively express transmembrane 4 L six family member 19 (TM4SF19), a lysosomal protein that represses acidification through its interaction with Vacuolar-ATPase. Inactivation of TM4SF19 elevates lysosomal acidification and accelerates the clearance of dying/dead adipocytes in vitro and in vivo. TM4SF19 deletion reduces the LAM accumulation and increases the proportion of restorative macrophages in AT of male mice fed a high-fat diet. Importantly, male mice lacking TM4SF19 adapt to high-fat feeding through adipocyte hyperplasia, rather than hypertrophy. This adaptation significantly improves local and systemic insulin sensitivity, and energy expenditure, offering a potential avenue to combat obesity-related metabolic dysfunction.


Conflict of interest statement

The authors declare no competing interests.

Figures
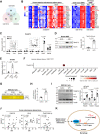
Fig. 1
Fig. 1. Identification of obesity-induced upregulation of TM4SF19 in adipose tissue macrophages.
A Venn diagrams illustrating overlaps between differentially expressed genes (DEGs: fold change >2, p-value < 0.05) from three independent datasets (GSE182930: Transcriptomics profiling of gonadal white adipose tissue (GWAT) of WT mice after normal chow diet (NCD) and high-fat diet (HFD) feeding for 8 weeks, GSE150102: Transcriptomics profiling of GWAT of WT and leptin-deficient mice, GSE59034: Transcriptomics profiling of human subcutaneous WAT of lean and obese subjects). B Heatmap of 17 upregulated genes identified in (A). C Tm4sf19 mRNA expression levels in various tissues and bone marrow-derived macrophages (BMDMs) of mice after 12 weeks of NCD and HFD feeding (n = 6 mice). D Immunoblot analysis of TM4SF19 in GWAT of mice after 12 weeks of NCD and HFD feeding (n = 6 mice). E qPCR analysis of Tm4sf19 expression in floating adipocytes, and MACS-separated F4/80+ and F4/80- stromal vascular fraction (SVF) isolated from GWAT of HFD-fed mice (n = 3 biologically independent replicates). F. TM4SF19 expression levels in different cell types from human white adipose tissue (GEO: GSE176171). G, H Chromatin immunoprecipitation (ChIP) enrichment analysis of recruitment of NF-ĸB to putative NF-ĸB binding site of Tm4sf19 promoter in RAW264.7 macrophages by PCR (G) and q-PCR (H). PCR amplification was carried out with input and DNA fragments immunoprecipitated by anti-NF-ĸB antibody and negative control IgG (n = 6 biologically independent replicates). I TM4SF19 and NF-ĸB expression levels of RAW264.7 macrophages after LPS treatment for 24 h (n = 6 biologically independent replicates). J Correlation analysis of TM4SF19 and NFKB1 gene expression in human subcutaneous adipose tissue and BMI (n = 12 patients). K Schematic diagram illustrating the working model of NF-ĸB-mediated transcriptional control of Tm4sf19 expression in macrophages during obesity-induced inflammation. Data are presented as mean values ± SEM. p-values were determined by the unpaired two-sided Student’s t-test (AE, H, I), and two-tailed Pearson correlation (J). Source Data are provided as a Source Data File.
Fig. 2
Fig. 2. TM4SF19, a lysosomal membrane protein, inhibits V-ATPase V1-V0 holoenzyme assembly and lysosomal acidification by interacting with ATP6V0B.
A Representative fluorescence images of RAW264.7 cells overexpressing GFP-tagged TM4SF19 (green) co-stained with the indicated markers (red) (lysosomal associated membrane protein 1(LAMP1), protein disulfide-isomerase (PDI)) (n = 6 biologically independent replicates). Scale bar = 5 μm. B Immunoprecipitation analysis of Myc-tagged TM4SF19 overexpressing in RAW264.7 cells (representative results from 3 independent experiments). C, D Immunoblot analysis of TM4SF19, ATP6V1B2, ATP6V0B, LAMP1, and β-actin protein levels in membrane and cytosolic fractions of WT and TM4SF19 KO BMDM (C) (n = 6) and TM4SF19 overexpressing RAW264.7 cells (OE) and negative control cells (Mock) (D) (n = 6 biologically independent replicates). E V-ATPase activity of lysosomal fractions from TM4SF19 KO and WT BMDM or TM4SF19 overexpressing RAW264.7 cells and negative controls (n = 6 biologically independent replicates). F Representative images of BMDM obtained from WT and TM4SF19 KO mice, stained with LysoSensor Yellow/Blue dextran. Yellow fluorescence represents an acidic lysosomal environment, and blue fluorescence represents a neutral lysosomal environment (n = 6 biologically independent replicates). Scale bar = 100 μm. G, H Long-term live imaging (G) and imaging of fixed cells (H): WT and TM4SF19 KO BMDMs (stained with DiO: green) cocultured with dying adipocytes (stained with BODIPY: red). Scale bar = 100 μm (G). The arrows indicate CtB (green)-stained BMDM that phagocytosed LipidTOX (red)-labeled lipids (LipidTOX+CtB+). Scale bar = 20 μm (H). The intensity analysis was conducted on each well, with one center field analyzed as six biologically independent replicates (n = 6). I An illustration of the working model where TM4SF19 interacts with V0 domain of V-ATPase, and inhibits the assembly of V1/V0 complex, resulting in reduced lysosomal acidification. Data are presented as mean values ± SEM. p-values were determined by the unpaired two-sided Student’s t-test (CH). Source Data are provided as a Source Data File.
Fig. 3
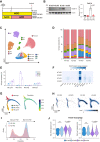
Fig. 3. Tm4sf19 is expressed in Trem2+macrophages and TM4SF19 KO reduces HFD-induced recruitment of Trem2+ macrophages in GWAT.
A Experimental strategy of snRNA-seq analysis of HFD-fed TM4SF19 KO mice. B Confirmation of TM4SF19 expression levels in GWAT of NCD or HFD-fed TM4SF19 KO and WT mice by immunoblot analysis (n = 6 mice). C UMAP plot of total 54,960 nuclei isolated from GWAT of WT and TM4SF19 KO mice fed NCD or HFD for 12 weeks. (two replicates per condition). Clusters are colored by cell types: Adipocyte, mesothelial cell (MC), lymphatic endothelial cell (LEC), vascular endothelial cell (VEC), adipocyte progenitor cell (APC), smooth muscle cell (SMC), Lyve1+macrophage (Mac.Lyve1), Trem2+macrophage (Mac.Trem2), Prg4+macrophage (Mac.Prg4), monocyte, dendritic cell (DC), B cell and T cell. D Total cell type composition of NCD and HFD-fed WT and TM4SF19 KO mice in each sample. E Monocyte and macrophage subtype composition in total cell population for each condition (WT NCD, TM4SF19 KO NCD, WT HFD, TM4SF19 KO HFD). The error bar represents mean ± SD (n = 2 mice). F Average Tm4sf19 expression levels of each cell type in WT and TM4SF19 KO mice fed NCD and HFD. G tSNE plots showing in silico pseudotime analysis of monocyte and macrophage subtypes. Cells were colored by cell types (left) and pseudotime (right). The arrows on the left panel show differentiation directionality. H tSNE plots split by NCD or HFD condition. The color indicates the density of cells. I Density plot showing the distribution of cells into Lyve1+macrophage (Mac.Lyve1) path and Trem2+macrophage (Mac.Trem2) path of HFD-fed WT and TM4SF19 KO mice according to pseudotime. J Mac.Lyve1 (left) and Mac.Trem2 (right) gene signature scores in Trem2+macrophage in each condition (WT NCD, TM4SF19 KO NCD, WT HFD, TM4SF19 KO HFD). ns: p > 0.05. (p-values for mac.Trem2 signature score = 2.03e-36, mac.Lyve1 signature score = 5.98e-22). Data are presented as mean values ± SEM (B) or SD (E). p-values were determined by the unpaired two-sided Student’s t-test (J) and two-way ANOVA followed by Bonferroni post hoc tests (B). Source Data are provided as a Source Data File.
Fig. 4
Fig. 4. Gene module analysis deconstructs adipose tissue macrophage subtypes.
A UMAP plot of monocyte and macrophage population from WT HFD condition. Four different colors demonstrate the different monocyte/macrophage cell types. B Tm4sf19 gene expression level (left) and module eigengenes (MEs) score of Mod4 and Mod2 (right). Tm4sf19 gene expression in the population of monocyte/macrophage from WT HFD is included in Mod4. The number of genes in each module and down- (Mod4) or up-regulated (Mod2) in the TM4SF19 KO HFD condition relative to the WT HFD condition is indicated. C Gene expression in monocyte and macrophage subtypes from WT NCD, KO NCD, WT HFD, and KO HFD condition associated with biological terms chosen from Mod4 down-regulated genes and Mod2 up-regulated genes. D Graph showing the module scores for each biological term in cells ordered along the trajectory from Trem2- to Trem2+ macrophages of GWAT of HFD-fed mice. E Expression levels of Trem2, Lyve1, Mrc1, and Itgax in macrophages. F Trajectory from Trem2- to Trem2+ macrophages on the PCA plot. The cell order along the trajectory is indicated by color. The PCs were selected to distinctly separate the Trem2+ and Trem2- macrophages. G Module scores for each biological term in the macrophage population are shown in a PCA plot. Source data are provided as a Source Data file.
Fig. 5
Fig. 5. TM4SF19 deletion reduces HFD-induced inflammatory responses of adipose tissue.
A GSEA showing enrichment in inflammatory response (NES = −1.916643, adjusted p-value = 1.556454e-03) by genes significantly contributed to all cells of GWAT of WT HFD and TM4SF19 KO HFD mice. Among the variable genes ordered according to WT HFD and TM4SF19 KO HFD group loading, genes associated with the inflammatory response were marked with a black vertical line. B Heatmap of the downregulated genes involved in the inflammatory response in all cells of TM4SF19 KO HFD compared to WT HFD mice. Expression levels were scaled across conditions. C mRNA expression levels of genes involved in the inflammatory response in GWAT of each condition (n = 6 mice). D Immunofluorescence staining of F4/80 (green) with DAPI (blue) counterstaining in paraffin sections. Scale bar = 100 μm. EG Representative flow profiles of CD206 (M2) and CD11C(M1) (E), TREM2 and CD11C (F), and LYVE1 and CD206 (G) expression levels in cells from GWAT of WT and TM4SF19 KO mice fed NCD (n = 3 mice) or HFD (n = 6 mice) for 12 weeks. H Time lapse images from two-photon intravital imaging of CX3CR1-GFP+ macrophages (green) in WT and TM4SF19 KO mice. PDGFRA-tdTomato-reporter (red) expression visualized PDGFRA+ cells and PDGFRA+ progenitor-derived adipocytes. Scale bars = 30 µm. (three biologically independent animals per each condition, showing representative images from a total of six fields: two fields/mouse). I Representative migration plots in the 2-dimensionally projected graph from 3-dimensional intravital images, showing macrophage migration trajectories in WT (n = 43 GFP+ cells from six fields, three biologically independent animals) and TM4SF19 KO (n = 52 GFP+ cells from six fields, three biologically independent animals) PDGFRA-Cre/LSL-tdTomato/CX3CR1-GFP mice (Also See Supplementary Movie 1). J Two-photon intravital imaging of an adipocyte phagocytized by macrophages in adipose tissue. CX3CR1-GFP signals (green) and WGA-blue (red in Figure) visualized phagocytes. The images in the lower panel indicated the destructed area of an adipocyte with dashed lines and the front line of the phagocytic progress with the arrows. Scale bars = 30 µm. (Also See Supplementary Movie 2). Data are presented as mean values ± SEM. p-values were determined by the unpaired two-sided Student’s t-test (D, F, G, I) and two-way ANOVA followed by Bonferroni post hoc tests (C, E). Source data are provided as a Source Data file.
Fig. 6
Fig. 6. TM4SF19 KO restores insulin-sensitive adipocytes in adipose tissue of HFD-fed mice.
A, B Representative images with adipocyte size analysis (A), and adipose tissue cellularity analysis (B) of GWAT from WT and TM4SF19 KO mice fed HFD (n = 6 mice). Scale bars = 50 μm. C Schematic diagram depicting BrdU cumulative labeling. D Immunohistochemical analysis of BrdU (red) incorporation in PLIN1+ (green) adipocytes in GWAT of WT and TM4SF19 KO mice fed HFD (n = 6 mice). Scale bars = 100 μm. E tSNE plot showing the differentiation paths from APC to Adipocytes. The color indicates APC and Adipocyte clusters. The line on the tSNE plot shows the differentiation trajectory. F Heatmap of canonical marker genes used to identify each cluster. The color indicates the scaled expression level of genes. G tSNE plots showing differentiation paths split by condition. The dotted line (Adipocyte.1) highlights the cluster restored by TM4SF19 KO with HFD. H Bar plot showing the composition of APC and adipocyte clusters in each condition. I Selected pathways of GO enrichment analysis up-regulated in Adipocyte.1 or Adipocyte.3. J Violin plots showing gene expression associated with adipokine secretion, insulin sensitivity, lipolysis, and lipid accumulation. K Correlation analysis of Adipocyte.1 and Adipocyte.3 genes in human subcutaneous adipose tissue (n = 12 patients). Data are presented as mean values ± SEM. p-values were determined by the unpaired two-sided Student’s t-test (A, D, J), two-tailed Pearson correlation (K), and two-way ANOVA followed by Bonferroni post hoc tests (B). Source data are provided as a Source Data file.
Fig. 7
Fig. 7. TM4SF19 deletion increased energy expenditure and mitochondrial oxidative metabolism in adipose tissue of mice fed HFD.
WT and TM4SF19 global KO mice were fed HFD for up to 12 weeks. Indirect calorimetry analysis was performed at 10 weeks of HFD feeding. Samples for snRNA-seq and immunoblot analysis were collected at 12 weeks of HFD feeding. A. Regression plots of energy expenditure against body mass (ANCOVA using body mass as a covariate, two-sided without adjustment, n = 6 mice). B ANCOVA -adjusted energy expenditure (EE) (predicted energy expenditure at the mean body mass (45.7 g). p-values were determined by the unpaired two-sided Student’s t-test (n = 6 mice). C GSEA showing enrichment in mitochondrial biogenesis (NES = 1.768443, adjusted p-value = 2.744879e-02) and oxidative phosphorylation (NES = 2.04969, adjusted p-value = 0.001319558) by genes significantly contributed to all cells of GWAT of WT HFD and TM4SF19 KO HFD mice. Among the variable genes ordered according to WT HFD and TM4SF19 KO HFD group loading, genes associated with oxidative phosphorylation and mitochondrial biogenesis were marked with a black vertical line. D Heatmap analysis of the upregulated genes involved in oxidative phosphorylation, and mitochondrial biogenesis in all cells of GWAT of TM4SF19 KO HFD mice. E Western blot analysis of mitochondrial protein levels in TM4SF19 KO mice after feeding HFD for 12 weeks. p-values were determined by two-way ANOVA followed by Bonferroni post hoc tests (n = 6 mice). Data are presented as mean values ± SEM. Source data are provided as a Source Data file.
Fig. 8
Fig. 8. Macrophage-specific TM4SF19 KO improves obesity-induced metabolic dysfunction.
A, B qPCR (A) and immunoblot (B) analysis to confirm macrophage-specific TM4SF19 deletion from GWAT of tamoxifen-induced Tm4sf19flox/flox Csf1r-CreER (TM4SF19 MKO) mice (n = 6 mice). C, D Mouse weights monitoring (C), adipose tissue weight (D) of TM4SF19 MKO mice after HFD feeding for 12 weeks (n = 6 mice). E Body fat and lean mass of TM4SF19 MKO mice after 5 weeks or 12 weeks of HFD feeding (n = 6). F, G Glucose tolerance test (GTT) (F) and insulin tolerance test (ITT) (G) of TM4SF19 MKO mice after HFD feeding for 12 weeks (n = 6 mice). H Regression plots of energy expenditure against body mass (ANCOVA using body mass as a covariate, two-sided without adjustment, n = 6 mice). I ANCOVA -adjusted energy expenditure (EE) (predicted at the mean body mass (34.01 g at HFD 5 weeks/43.7 g at HFD 12 weeks)) (n = 6). J mRNA expression levels of genes involved in inflammatory response from GWAT of TM4SF19 MKO mice after HFD feeding for 12 weeks (n = 6 mice). K Immunofluorescence staining of F4/80 (green) with DAPI (blue) counterstaining in paraffin sections from GWAT of WT and TM4SF19 MKO HFD-fed mice. Scale bar = 100 μm (n = 6 mice). L, M Representative flow profiles of TREM2+macrophages and F4/80 expression levels (L) and BODIPY+F4/80+ macrophages and BODIPY+CD45+ cells (M) from GWAT of TM4SF19 MKO HFD-fed mice (n = 6 mice). Data are presented as mean values ± SEM. p-values were determined by the unpaired two-sided Student’s t-test (A, B, E, IK) and two-way ANOVA followed by Bonferroni post hoc tests (D, F, G, L, M). Source data are provided as a Source Data file.

References

    1. Rosen ED, Spiegelman BM. What we talk about when we talk about fat. Cell. 2014;156:20–44. doi: 10.1016/j.cell.2013.12.012. - DOI - PMC - PubMed
    1. Cinti S, et al. Adipocyte death defines macrophage localization and function in adipose tissue of obese mice and humans. J. Lipid Res. 2005;46:2347–2355. doi: 10.1194/jlr.M500294-JLR200. - DOI - PubMed
    1. Hill DA, et al. Distinct macrophage populations direct inflammatory versus physiological changes in adipose tissue. Proc. Natl Acad. Sci. USA. 2018;115:E5096–E5105. doi: 10.1073/pnas.1802611115. - DOI - PMC - PubMed
    1. Jaitin DA, et al. Lipid-associated macrophages control metabolic homeostasis in a Trem2-dependent manner. Cell. 2019;178:686–698.e614. doi: 10.1016/j.cell.2019.05.054. - DOI - PMC - PubMed
    1. Lee YH, Petkova AP, Granneman JG. Identification of an adipogenic niche for adipose tissue remodeling and restoration. Cell Metab. 2013;18:355–367. doi: 10.1016/j.cmet.2013.08.003. - DOI - PMC - PubMed