. 2024 Mar 30;15(1):2778.
doi: 10.1038/s41467-024-47190-y.

Mitochondrial injury induced by a Salmonella genotoxin triggers the proinflammatory senescence-associated secretory phenotype

Affiliations

Mitochondrial injury induced by a Salmonella genotoxin triggers the proinflammatory senescence-associated secretory phenotype

Han-Yi Chen et al. Nat Commun. .

Abstract

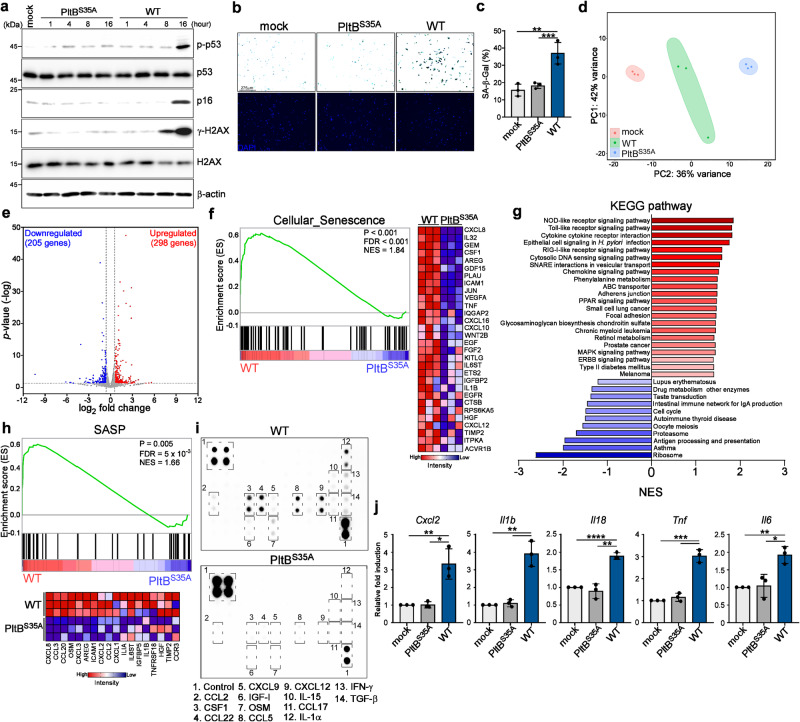
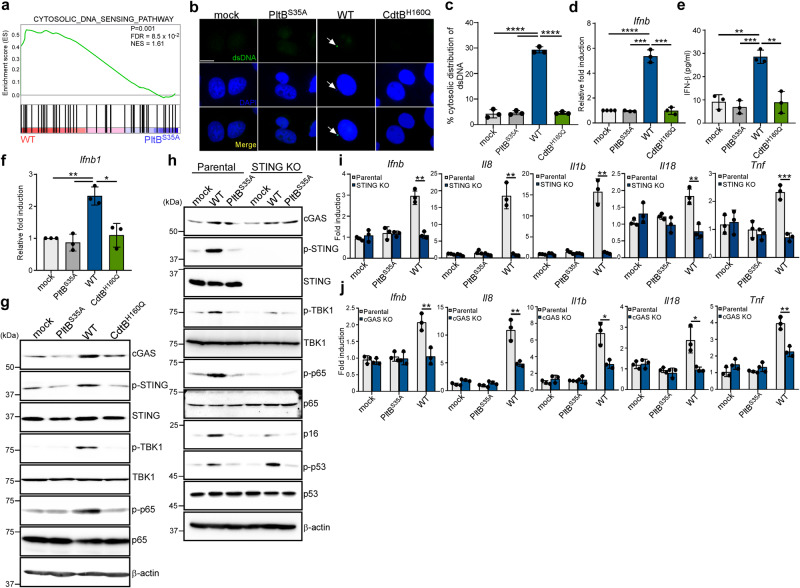
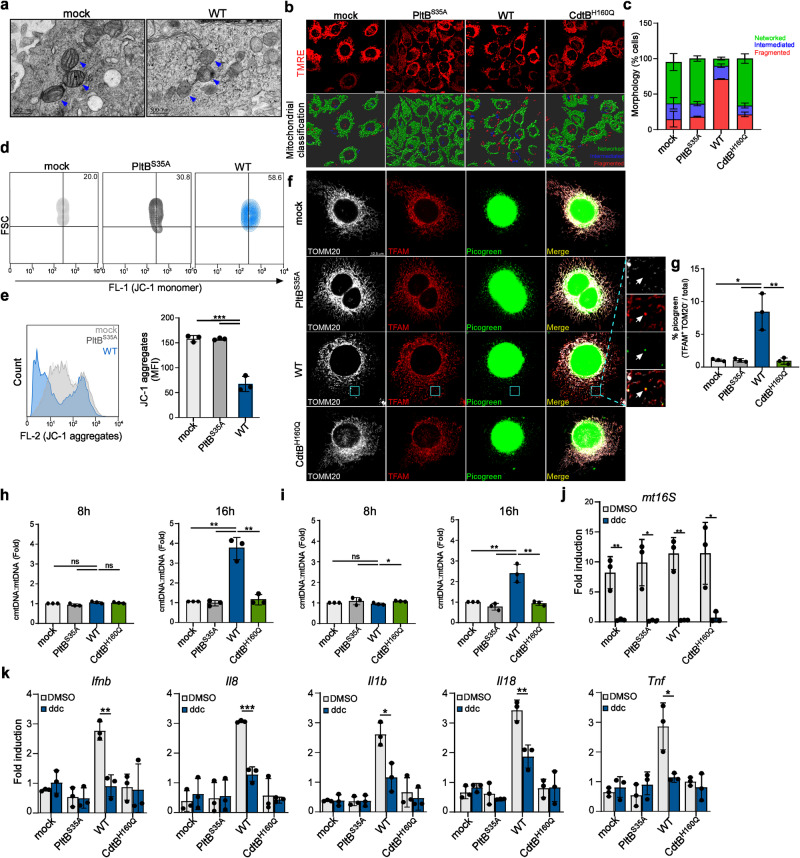
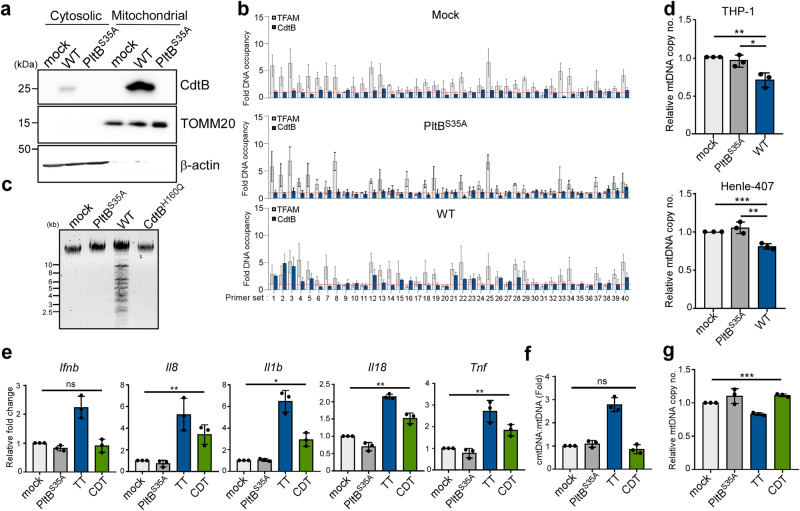
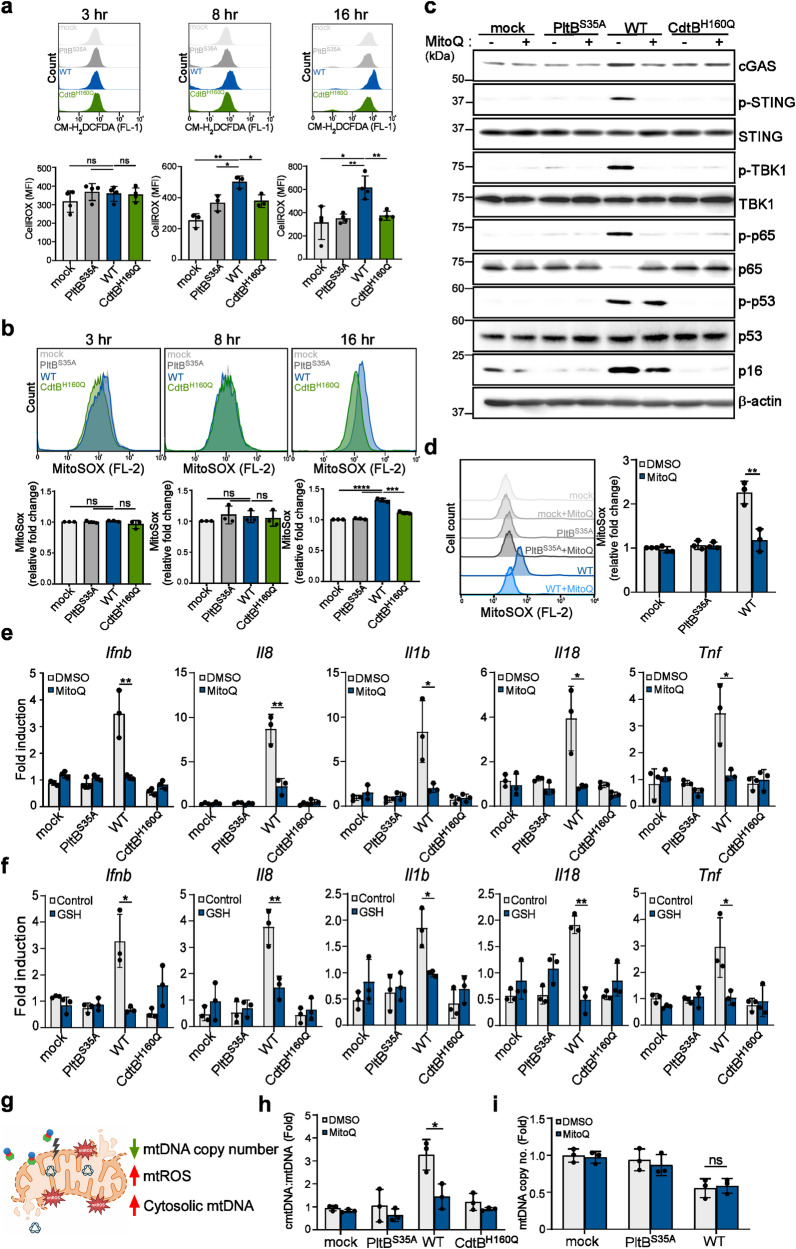
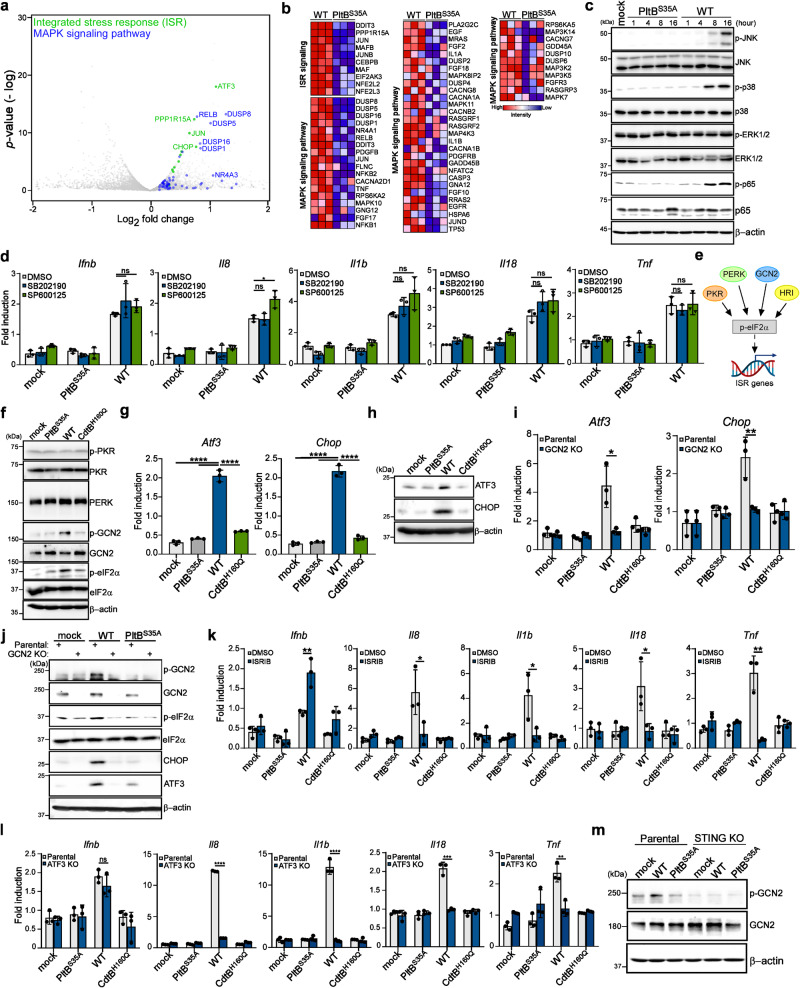
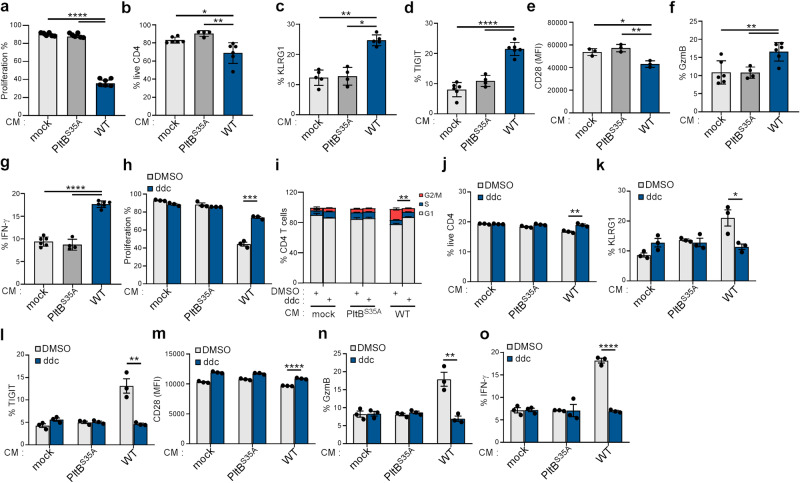
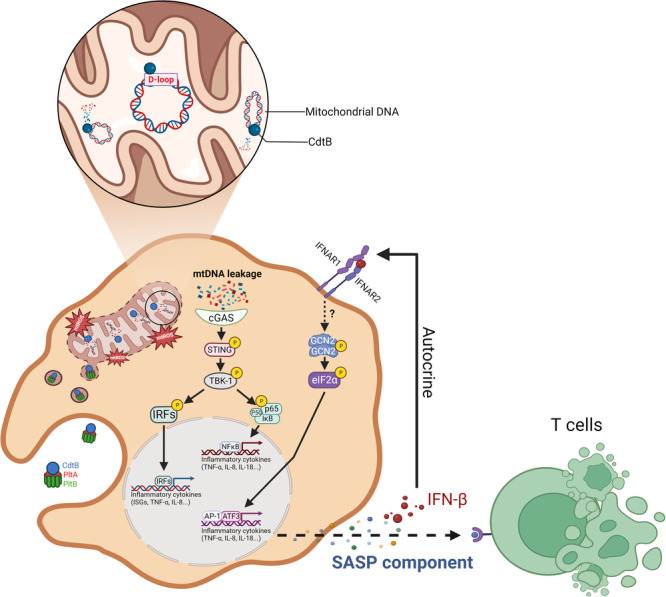
Bacterial genotoxins damage host cells by targeting their chromosomal DNA. In the present study, we demonstrate that a genotoxin of Salmonella Typhi, typhoid toxin, triggers the senescence-associated secretory phenotype (SASP) by damaging mitochondrial DNA. The actions of typhoid toxin disrupt mitochondrial DNA integrity, leading to mitochondrial dysfunction and disturbance of redox homeostasis. Consequently, it facilitates the release of damaged mitochondrial DNA into the cytosol, activating type I interferon via the cGAS-STING pathway. We also reveal that the GCN2-mediated integrated stress response plays a role in the upregulation of inflammatory components depending on the STING signaling axis. These SASP factors can propagate the senescence effect on T cells, leading to senescence in these cells. These findings provide insights into how a bacterial genotoxin targets mitochondria to trigger a proinflammatory SASP, highlighting a potential therapeutic target for an anti-toxin intervention.


Conflict of interest statement

The authors declare no competing interests.

Figures

Fig. 1
Fig. 1. Typhoid toxin induces cellular senescence and proinflammatory SASP in cells.
a Western blot analysis of THP-1-derived macrophages exposed to typhoid toxin. THP-1-derived macrophages were treated with either wild-type (WT) typhoid toxin or the PltBS35A mutant at 37 °C for 1 h and then changed to regular growth medium. The cell lysates were collected at indicated time points and subjected to western blot analysis for protein assessment. b, c THP-1-derived macrophages exposed to typhoid toxin exhibited SA-β-gal activity staining. DAPI staining is shown in blue. Scale bars, 0.275 mm. The quantification results are presented as mean ± s.d (n  =  3) (c). Statistical analysis was performed using unpaired two-sided t-tests; **P  <  0.01, ***P  <  0.001. d Principal component analysis (PCA) of transcriptome data for THP-1-derived macrophages exposed to typhoid toxin. e A volcano plot showing gene expression changes in WT typhoid toxin-treated macrophages compared to PltB mutant toxin-treated macrophages, highlighting upregulated genes in red and down-regulated genes in blue (P < 0.05 and fold change >1.5). f Gene set enrichment analysis (GSEA) showing upregulated genes related to cellular senescence in typhoid toxin-treated macrophages compared with the PltBS35A mutant. A heatmap represents the gene expression levels involved in cellular senescence as determined by RNA-seq. g Additional GSEA was conducted to show Kyoto Encyclopedia of Genes and Genomes (KEGG) pathway enrichment in WT typhoid toxin-treated macrophages versus the PltBS35A mutant, with normalized enrichment scores (NES). h GSEA showing upregulated genes related to the senescence-associated secretory phenotype (SASP) in WT typhoid toxin-treated macrophages compared to the PltBS35A mutant. A heatmap represents gene expression levels involved in the SASP as determined by RNA-seq. i Cytokine profile of conditional medium obtained from THP-1-derived macrophages exposed to WT typhoid toxin or the PltBS35A mutant. The SASP factors are enclosed with labels.  j RT-qPCR analysis of mRNA levels of indicated genes in murine bone marrow-derived macrophages (BMDMs) exposed to WT typhoid toxin and the PltBS35A mutant. Data are presented as mean ± s.d (n  =  3). Statistical analysis was performed using unpaired two-sided t-tests; *P  <  0.05, **P  <  0.01, ***P  <  0.001, ****P  <  0.0001. The western blots shown in (a) are representative of 3 independent experiments. Source data are provided as a Source data file.
Fig. 2
Fig. 2. The cGAS-STING signaling pathway plays a central role in the proinflammatory SASP induced by typhoid toxin.
a GSEA showing upregulated genes related to cytosolic DNA sensing pathway in macrophages treated with wild-type (WT) typhoid toxin compared to those treated with the PltBS35A mutant. b Representative images of immunofluorescent staining in Henle-407 cells treated with WT typhoid toxin, the PltBS35A and the CdtBH160Q mutants with anti-dsDNA and DAPI are shown in green and blue, respectively. Arrowheads indicate the presence of cytosolic dsDNA. Scale bars, 12.5 μm. c Percentage of cytoplasmic distribution of dsDNA 24 h after treatment of typhoid toxin in Henle-407 cells. Values are shown as mean ± s.d. (n = 3). One hundred cells were counted for each condition. Statistical analysis was performed using unpaired two-sided t-tests; ****P  <  0.0001. d RT-qPCR analysis in THP-1-derived macrophages exposed to typhoid toxin. Statistical analysis was performed using unpaired two-sided t-tests (n = 3); ***P  <  0.001, ****P  <  0.0001. e IFN-β protein levels were assessed using ELISA in THP-1-derived macrophages after exposure to WT typhoid toxin and the mutants for 16 h. Data are presented as mean ± s.d (n = 3). Statistical analysis was performed using unpaired two-sided t-tests; **P  <  0.01, ***P  <  0.001. f RT-qPCR analysis in murine bone marrow-derived macrophages exposed to typhoid toxin. Statistical analysis was performed using unpaired two-sided t-tests (n = 3); *P  <  0.05, **P  <  0.01. g THP-1-derived macrophages exposed to typhoid toxin were analyzed using western blot analysis with antibodies against cGAS, phosphorylated STING, phosphorylated TBK1, phosphorylated p65, and β-actin as a loading control. h Analysis of the STING signaling pathway was performed using the STING-deficient THP-1-derived macrophages and its parental cells exposed to typhoid toxin. Cell lysates were analyzed by western blot with antibodies against cGAS, phosphorylated STING, phosphorylated TBK1, phosphorylated p65, p16INK4a, phosphorylated p53, and β-actin as a loading control. i, j The mRNA levels of proinflammatory components were assessed using RT-qPCR in the parental, STING knockout (KO) (i) or cGAS KO (j) macrophages exposed to typhoid toxin. Statistical analysis was performed using unpaired two-sided t-tests (n = 3); *P  <  0.05, **P  <  0.01 ***P  <  0.001. The western blots shown in (g), (h) are representative of 3 independent experiments. Source data are provided as a Source data file.
Fig. 3
Fig. 3. Typhoid toxin activates the cGAS-STING signaling pathway by promoting mtDNA efflux into the cytosol.
a, Transmission electron microscopy of typhoid toxin-treated Henle-407 cells showing mitochondria (blue arrowhead). Scale bars, 500 nm. Cells are from 2 independent experiments. b, c Representative confocal images of TMRE staining in cells exposed to WT typhoid toxin and mutants. Scale bar, 15 μm (b). Mitochondrial morphology was classified into networked, intermediated, and fragmented categories using Imaris, with data representing the mean ± s.d (n = 3). At least 100 cells were counted for each condition (c). d, e Mitochondrial membrane potential measured by flow cytometry. THP-1-derived macrophages were treated with typhoid toxin. Sixteen hours after treatment, cells were stained with JC-1 dye (d). A histogram plot shows JC-1 intensity and quantification of JC-1 aggregate fluorescence indicating normal mitochondrial membrane potential. Data are presented as the mean ± s.d (n = 3) (e). Statistical analysis was performed using unpaired two-sided t-tests; ***P  <  0.001. f, g Fluorescent images of DNA (green), TFAM (red) and mitochondria (white) in Henle-407 cells exposed to typhoid toxin. Scale bar, 12.5 μm. Magnified images show the TFAM co-localizing with cytosolic DNA outside the mitochondrial network (f). Quantification of the ratio of cytosolic DNA foci distinct from those within the mitochondria relative to the total cytosolic DNA foci. Data are represented as the mean ± s.d. (n = 3), with 300 cells assessed for each condition (t-tests; *P < 0.05; **P  <  0.01) (g). h, i RT-qPCR of cytosolic mtDNA (cmtDNA) relative to total mtDNA in THP-1-derived macrophages (h) and Henle-407 cells (i) exposed to typhoid toxin using the mt16S primer set. Data are presented as the mean ± s.d. (n = 3) with statistical significance (t-tests; *P < 0.05, **P  <  0.01, ns, not significant). j RT-qPCR of total mtDNA in THP-1-derived macrophages exposed to typhoid toxin with or without ddC treatment. Mitochondrial DNA copy number was normalized by total nuclear DNA (ACTB). Data are presented as the mean ± s.d (n = 3) with statistical significance (t-tests; *P  <  0.05, **P  <  0.01). k RT-qPCR of indicated genes in THP-1-derived macrophages exposed to typhoid toxin in the presence of ddC treatment. Data are presented as the mean ± s.d (n = 3) with statistical significance (t-tests; *P  <  0.05, **P  <  0.01, ***P  <  0.001). Source data are provided as a Source data file.
Fig. 4
Fig. 4. Typhoid toxin interaction with mitochondrial DNA and damage induction.
a Presence of typhoid toxin in the mitochondrial fractions in the THP-1-derived macrophages. The cells were incubated with 0.2 μg of WT typhoid toxin and the PltBS35A mutant for 5 h and fractionated to determine the amount of typhoid toxin in the cytosolic and mitochondrial fractions by western blot analysis using antibodies against CdtB, TOMM20 (an outer mitochondrial membrane protein), and β-actin as a loading control. b Mitochondrial DNA immunoprecipitation (mtDIP) assay for typhoid toxin binding to mtDNA. CdtB and TFAM binding to mtDNA across the mitochondrial genome using 40 primer sets by RT-qPCR. Fold DNA occupancy calculated relative to the IgG-negative control (n = 3). c Agarose gel analysis of mtDNA samples following PCR amplification. Mitochondrial DNA, isolated from THP-1-derived macrophages exposed to either WT typhoid toxin or its mutants, was subjected to PCR amplification using primers targeting the entire mitochondrial genome. d RT-qPCR of mtDNA copy number normalized by total nuclear DNA (ACTB) in THP-1-derived macrophages and Henle-407 cells exposed to WT typhoid toxin and the PltBS35A mutant version. Data are presented as the mean ± s.d (n = 3). Statistical analysis was performed using unpaired two-sided t-tests; *P  <  0.05, **P  <  0.01, ***P  <  0.001. e RT-qPCR analysis of the mRNA levels in cells exposed to WT typhoid toxin, the PltBS35A mutant and the CDT. Statistical analysis was performed using unpaired two-sided t-tests (n = 3); *P  <  0.05, **P  <  0.01, ns, not significant (P  >  0.05). f RT-qPCR of cytosolic mtDNA (cmtDNA) quantified relative to total mtDNA in THP-1-derived macrophages exposed to WT typhoid toxin (TT) (160 ρM) and the CDT (60 nM). The primer set of mt16S was used to determine. Data are presented as the mean ± s.d (n = 3). Statistical analysis was performed using unpaired two-sided t-tests; ns, not significant (P  >  0.05). g RT-qPCR of mtDNA copy number normalized by total nuclear DNA (ACTB) in THP-1-derived macrophages exposed to WT typhoid toxin and the CDT. Data are presented as the mean ± s.d (n = 3). Statistical analysis was performed using unpaired two-sided t-tests; ***P  <  0.001. The western blots shown in (a) are representative of 3 independent experiments. Source data are provided as a Source data file.
Fig. 5
Fig. 5. Typhoid toxin-induced mitochondrial injury leads to the production of mitochondrial ROS to trigger the cytosolic release of mtDNA.
a Measurement of cellular ROS levels was performed in THP-1-derived macrophages exposed to WT typhoid toxin and different mutants. Mean fluorescence intensity (MFI) is presented as the mean ± s.d (n = 3). Statistical analysis was performed using unpaired two-sided t-tests; *P  <  0.05, **P  <  0.01, ns, not significant (P  >  0.05). b Measurement of mitochondrial ROS was conducted in THP-1-derived macrophages exposed to typhoid toxin. Mean fluorescence intensity (MFI) is presented as the mean ± s.d (n = 3). Statistical analysis was performed using unpaired two-sided t-tests; ***P  <  0.001, ****P  <  0.0001, ns, not significant (P  >  0.05). c THP-1-derived macrophages exposed to typhoid toxin and its mutants were incubated with MitoQ (2 μM) for 16 h. Cell lysates were analyzed using western blot with antibodies against cGAS, phosphorylated STING, phosphorylated TBK1, phosphorylated p65, phosphorylated p53, p16INK4a, and β-actin as a loading control. d Mitochondrial ROS levels were assessed in THP-1-derived macrophages treated with typhoid toxin at 16 h post-treatment. Mean fluorescence intensity is presented as the mean ± s.d (n = 3). Statistical analysis was performed using unpaired two-sided t-tests; **P  <  0.01. e, f RT-qPCR analysis was conducted to measure the mRNA levels of the indicated genes in THP-1-derived macrophages exposed to WT typhoid toxin and different toxin mutants, with or without MitoQ (2 μM) (e) or GSH (10 mM) (f) treatment. Data are presented as the mean ± s.d (n = 3). Statistical analysis was performed using unpaired two-sided t-tests; *P  <  0.05, **P  <  0.01. g The schematic model of mitochondrial damage induced by typhoid toxin (Created with BioRender.com). h RT-qPCR of cytosolic mtDNA (cmtDNA) quantified relative to total mtDNA in THP-1-derived macrophages exposed to typhoid toxin with MitoQ treatment. Data are presented as the mean ± s.d (n = 3). Statistical analysis was performed using unpaired two-sided t-tests; *P  <  0.05. i RT-qPCR of mtDNA copy number in THP-1-derived macrophages exposed to WT typhoid toxin and the PltBS35A mutant with or without MitoQ treatment. Data are presented as the mean ± s.d (n = 3). Statistical analysis was performed using unpaired two-sided t-tests; ns, not significant (P  >  0.05). The western blots shown in (c) are representative of 3 independent experiments. Source data are provided as a Source data file.
Fig. 6
Fig. 6. GCN2-mediated integrated stress response contributes to the production of proinflammatory SASP components.
a Volcano plot showing upregulated genes related to the ISR signaling (green) and mitogen-activated protein kinase cascade (MAPK) signaling pathway (blue) in WT typhoid toxin-treated macrophages compared to PltBS35A mutant toxin-treated macrophages using an arbitrary threshold of P < 0.05 and fold change >1.5. b Expression of genes involved in the ISR signaling and MAPK signaling pathway by RNA-seq. c Immunoblot analyses demonstrate the activation of MAPK signaling pathways in THP-1-derived macrophages treated with typhoid toxin. Phosphorylated JNK, p38, ERK1/2, p65, and β-actin (loading control) were monitored at various time points. d THP-1-derived macrophages exposed to typhoid toxin were treated with p38 MAPK (SB202190) (1 μM) and JNK MAPK (SP600125) (5 μM) inhibitors for 16 h. Total mRNA was analyzed using RT-qPCR. Data are presented as mean ± s.d (n = 3) (t-tests; *P  <  0.05, ns, not significant). e A model (Created with BioRender.com) of the ISR signaling. f The ISR signaling pathway in THP-1-derived macrophages exposed to typhoid toxin was analyzed using western blot analysis with specific antibodies. g, h Total mRNA and protein levels of ISR target genes were quantified using RT-qPCR (g) and western blot analysis (h), respectively. Data are presented as mean ± s.d (n = 3) with statistical significance (t-tests; ****P  <  0.0001). i The mRNA levels of specific genes were assessed using RT-qPCR. Data are presented as mean ± s.d (n = 3). Statistical analysis was performed using unpaired two-sided t-tests; *P  <  0.05, **P  <  0.01. j Western blot analyses were performed to assess the activation of the GCN2-mediated ISR pathway. k, l The mRNA levels of proinflammatory genes were measured in THP-1-derived macrophages exposed to typhoid toxin under ISRIB treatment (30 μM) (k) or in ATF3-deficient cells and their parental cell line (l). RT-qPCR was used for gene expression analysis. Data are presented as mean ± s.d (n = 3) (t-tests; *P  <  0.05, **P  <  0.01, ***P  <  0.001, ****P  <  0.0001, ns, not significant.). m Activation of GCN2 in STING-deficient THP-1-derived macrophages and their parental cell line exposed to typhoid toxin was determined by western blot analysis. The western blots shown in (c), (f), (h), (j), (m) are representative of 3 independent experiments. Source data are provided as a Source data file.
Fig. 7
Fig. 7. Typhoid toxin-induced SASP in senescent macrophages promotes phenotypic characteristics of senescence in T cells.
a Total T cells isolated from wild-type mice were activated with anti-CD3/CD28, labeled with CellTrace Violet, and cultured in supernatants from RAW 264.7 macrophages treated with mock, wild-type (WT) typhoid toxin, or the PltBS35A mutant. The percentages indicate the proportion of cells that exhibited proliferation 6 days. bg Murine primary T cells were activated with anti-CD3/CD28 and then restimulated with ionomycin/TPA for 5 h, and the characteristics of cells were determined by co-staining of indicated surface and intracellular proteins. Frequency of live CD4+ T cells (CD4+) (b). Frequency of cell surface markers KLRG1 (CD4+KLRG1+) and TIGIT (CD4+TIGIT+) in CD4 T cells (c, d). Expression of CD28 in CD4+ T cells (CD4+CD28+) (e) determined by mean fluorescence intensities (MFI). Frequency of granzyme B (CD4+GzmB+) (f) and IFN-γ (CD4+IFN-γ+) (g) positive cells in CD4 T cells. Data are presented as the mean ± s.d (n = 3). Statistical analysis was performed using unpaired two-sided t-tests; *P  <  0.05, **P  <  0.01, ****P  <  0.0001. ho, T cells activated as previously described were cultured in supernatants (CM) from RAW 264.7 macrophages treated with mock, WT typhoid toxin, or the PltBS35A mutant, with or without ddC. T cell proliferation (h), cell cycle (i), cell viability (j), and the expression of indicated surface and intracellular proteins (ko) in CD4 T cells were analyzed using flow cytometry. Data are presented as the mean ± s.d (n = 3). Statistical analysis was performed using unpaired two-sided t-tests; *P  <  0.05, **P  <  0.01, ****P  <  0.0001. Source data are provided as a Source data file.
Fig. 8
Fig. 8. The model for the induction of proinflammatory SASP by typhoid toxin.
Typhoid toxin’s mechanism of action involves its entry into the mitochondria, where it initiates the proinflammatory SASP by directly targeting mitochondrial DNA (mtDNA) and inducing damage to this essential genetic material. This mtDNA damage triggers a cascade of events, beginning with the disruption of mtDNA integrity, which subsequently leads to mitochondrial dysfunction and a disturbance in redox homeostasis. As a consequence of these perturbations, damaged mtDNA is released into the cytosol, activating the cGAS-STING signaling pathway. This activation, in turn, instigates the expression of proinflammatory components, ultimately contributing to the development of the proinflammatory SASP (Created with BioRender.com).

References

    1. Song J, Gao X, Galan JE. Structure and function of the Salmonella Typhi chimaeric A(2)B(5) typhoid toxin. Nature. 2013;499:350–354. doi: 10.1038/nature12377. - DOI - PMC - PubMed
    1. Fowler CC, et al. Emerging insights into the biology of typhoid toxin. Curr. Opin. Microbiol. 2017;35:70–77. doi: 10.1016/j.mib.2017.01.012. - DOI - PMC - PubMed
    1. Galan JE. Typhoid toxin provides a window into typhoid fever and the biology of Salmonella Typhi. Proc. Natl Acad. Sci. USA. 2016;113:6338–6344. doi: 10.1073/pnas.1606335113. - DOI - PMC - PubMed
    1. Nesic D, Hsu Y, Stebbins CE. Assembly and function of a bacterial genotoxin. Nature. 2004;429:429–433. doi: 10.1038/nature02532. - DOI - PubMed
    1. Grasso F, Frisan T. Bacterial genotoxins: merging the DNA damage response into infection biology. Biomolecules. 2015;5:1762–1782. doi: 10.3390/biom5031762. - DOI - PMC - PubMed