

Predicting the dispersal and invasion dynamics of ambrosia beetles through demographic reconstruction and process-explicit modeling
- PMID: 38555364
- PMCID: PMC10981740
- DOI: 10.1038/s41598-024-57590-1
Predicting the dispersal and invasion dynamics of ambrosia beetles through demographic reconstruction and process-explicit modeling
Abstract
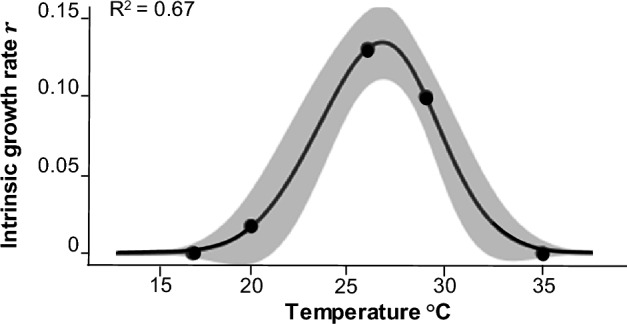
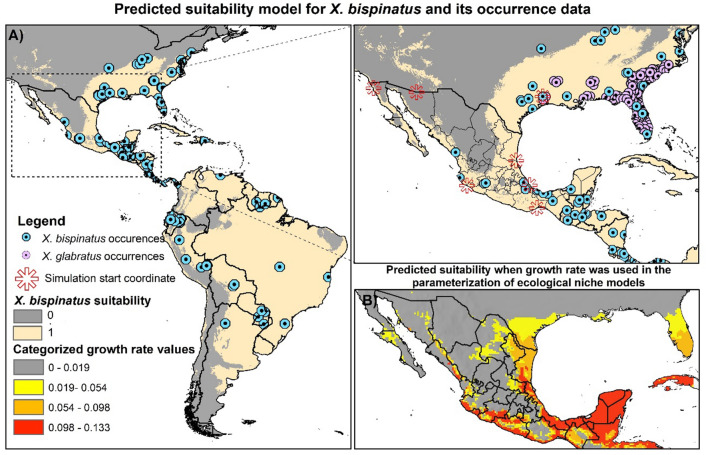
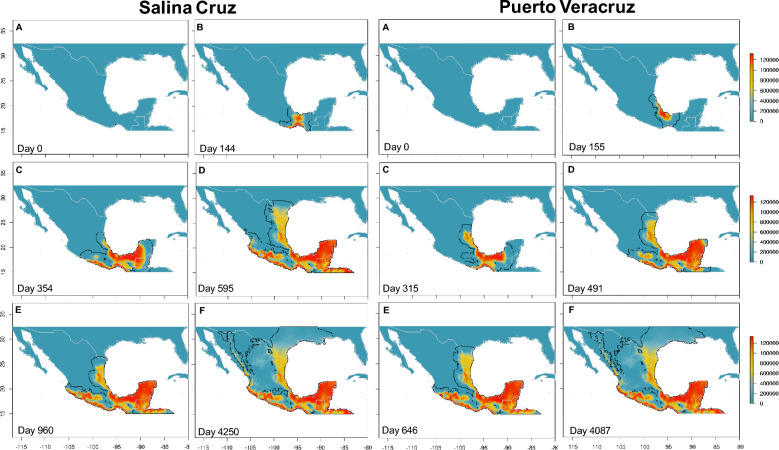
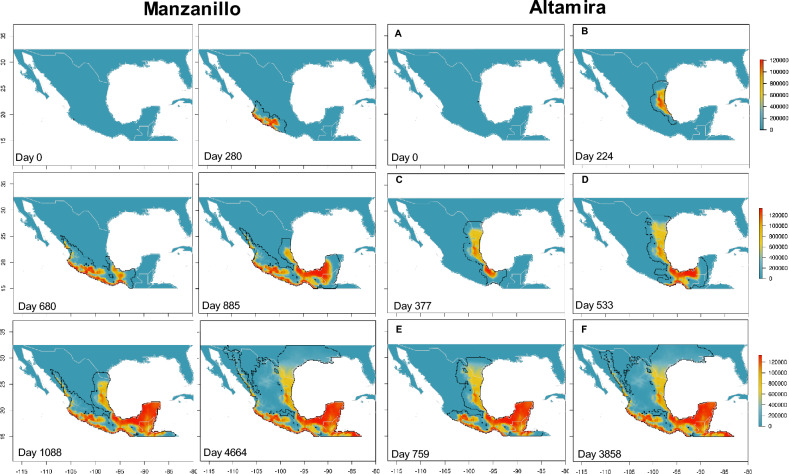
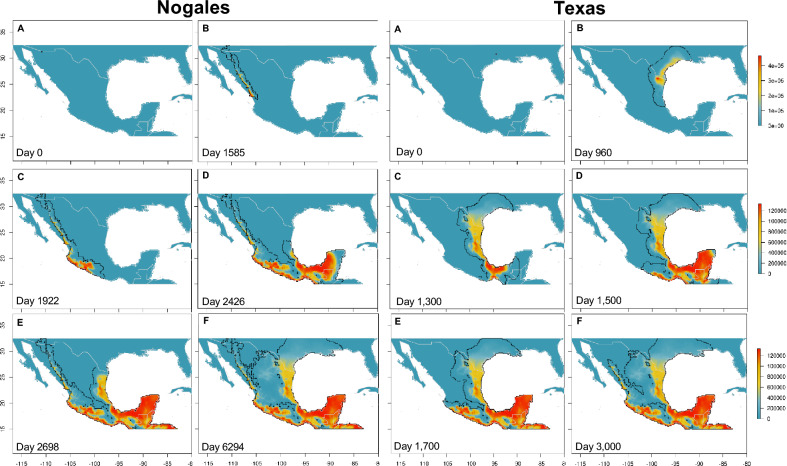
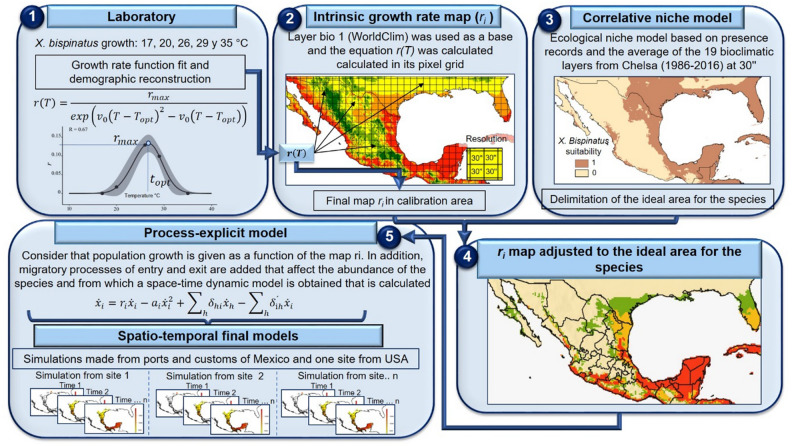
Evaluating potential routes of invasion of pathogens and vectors of sanitary importance is essential for planning and decision-making at multiple scales. An effective tool are process-explicit models that allow coupling environmental, demographic and dispersal information to evaluate population growth and range dynamics as a function of the abiotic conditions in a region. In this work we simulate multiple dispersal/invasion routes in Mexico that could be taken by ambrosia beetles and a specific symbiont, Harringtonia lauricola, responsible for a severe epiphytic of Lauraceae in North America. We used Xyleborus bispinatus Eichhoff 1868 as a study subject and estimated its demography in the laboratory in a temperature gradient (17, 20, 26, 29, 35 °C), which we then used to parameterize a process-based model to estimate its metapopulation dynamics. The maximum intrinsic growth rate of X. bispinatus is 0.13 with a thermal optimum of 26.2 °C. The models suggest important regions for the establishment and dispersal the states of Veracruz, Chiapas and Oaxaca (high host and secondary vectors diversity), the Isthmus of Tehuantepec (connectivity region), and Michoacán and Jalisco (important avocado plantations). The use of hybrid process-based models is a promising tool to refine the predictions applied to the study of biological invasions and species distributions.
© 2024. The Author(s).
Conflict of interest statement
The authors declare no competing interests.
Figures
Similar articles
-
Vertical Distribution and Daily Flight Periodicity of Ambrosia Beetles (Coleoptera: Curculionidae) in Florida Avocado Orchards Affected by Laurel Wilt.J Econ Entomol. 2018 May 28;111(3):1190-1196. doi: 10.1093/jee/toy044. J Econ Entomol. 2018. PMID: 29528426
-
Presence and Prevalence of Raffaelea lauricola, Cause of Laurel Wilt, in Different Species of Ambrosia Beetle in Florida, USA.J Econ Entomol. 2017 Apr 1;110(2):347-354. doi: 10.1093/jee/tow292. J Econ Entomol. 2017. PMID: 28073980
-
Xyleborus bispinatus Reared on Artificial Media in the Presence or Absence of the Laurel Wilt Pathogen (Raffaelea lauricola).Insects. 2018 Feb 28;9(1):30. doi: 10.3390/insects9010030. Insects. 2018. PMID: 29495585 Free PMC article.
-
Partnerships Between Ambrosia Beetles and Fungi: Lineage-Specific Promiscuity Among Vectors of the Laurel Wilt Pathogen, Raffaelea lauricola.Microb Ecol. 2018 Nov;76(4):925-940. doi: 10.1007/s00248-018-1188-y. Epub 2018 Apr 20. Microb Ecol. 2018. PMID: 29675704
-
Fungal mutualisms and pathosystems: life and death in the ambrosia beetle mycangia.Appl Microbiol Biotechnol. 2021 May;105(9):3393-3410. doi: 10.1007/s00253-021-11268-0. Epub 2021 Apr 10. Appl Microbiol Biotechnol. 2021. PMID: 33837831 Review.
Cited by
-
The reemergence of the New World screwworm and its potential distribution in North America.Sci Rep. 2025 Jul 3;15(1):23819. doi: 10.1038/s41598-025-04804-9. Sci Rep. 2025. PMID: 40610581 Free PMC article.
References
-
- Van Der Have, T. M. A proximate model for thermal tolerance in ectotherms. Oikos, 98, 141–155 (2002).
-
- Peterson AT, Papeş M, Soberón J. Mechanistic and correlative models of ecological niches. Eur. J. Ecol. 2015;1:28–38. doi: 10.1515/eje-2015-0014. - DOI
-
- Elton, C. S. The Ecology of Invasions by Animals and Plants. (1958). T. Methuen and Co., London.
-
- Skellam, J. G. Random dispersal in theoretical populations. Biometrika38, 196–218 (1951). - PubMed
MeSH terms
Grants and funding
LinkOut - more resources
Full Text Sources
