. 2024 Mar 30;15(1):2795.
doi: 10.1038/s41467-024-47131-9.

Enzymatic conversion of human blood group A kidneys to universal blood group O

Affiliations

Enzymatic conversion of human blood group A kidneys to universal blood group O

Serena MacMillan et al. Nat Commun. .

Abstract

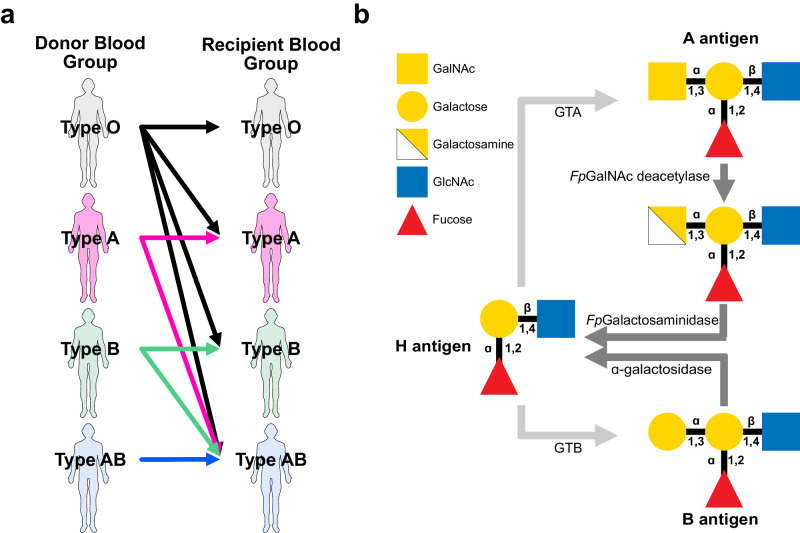
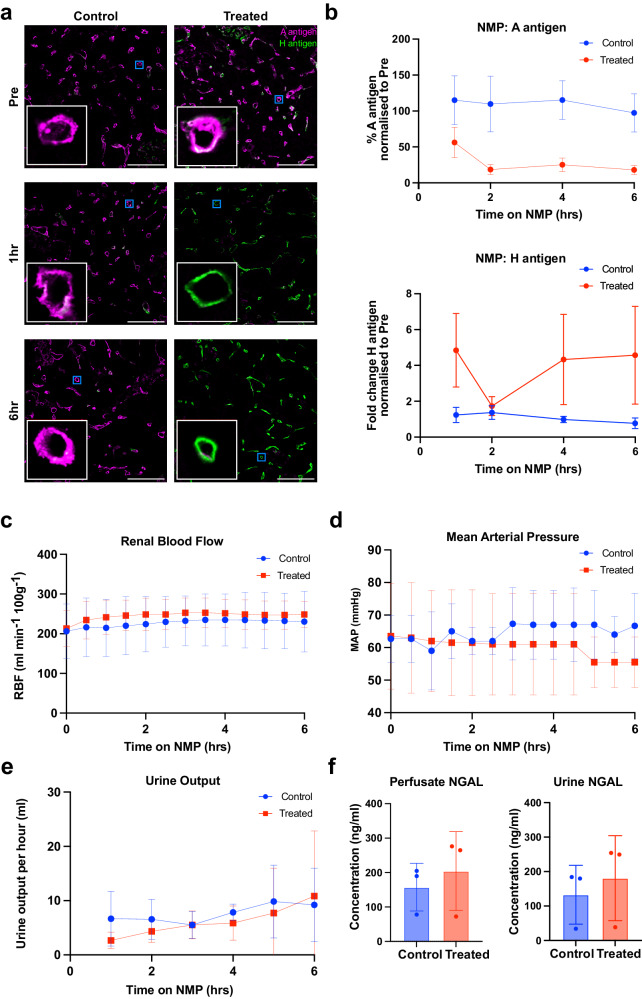
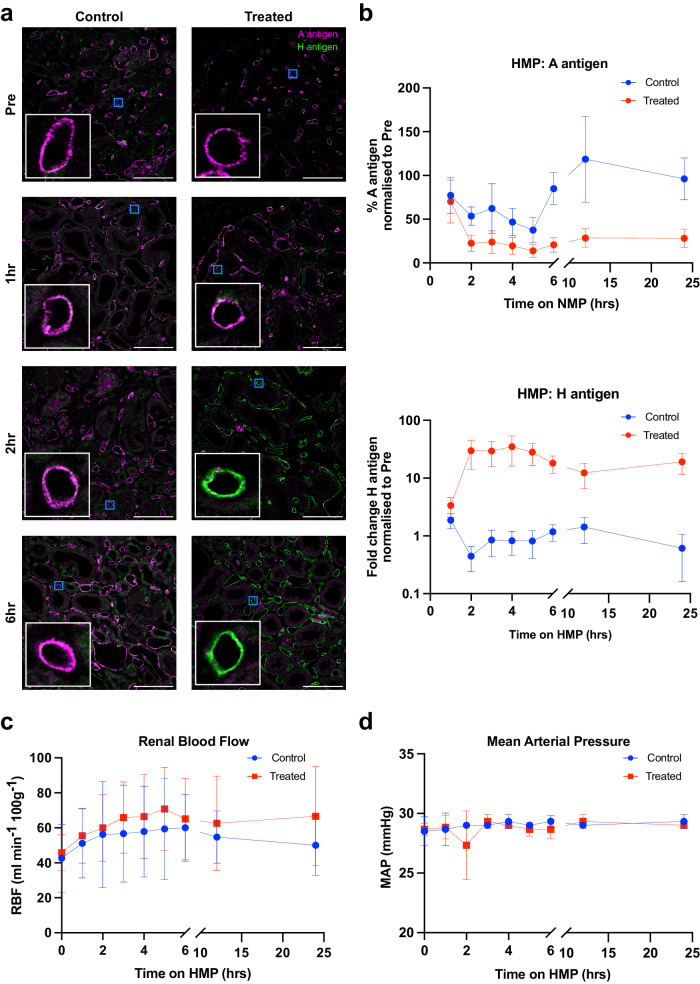
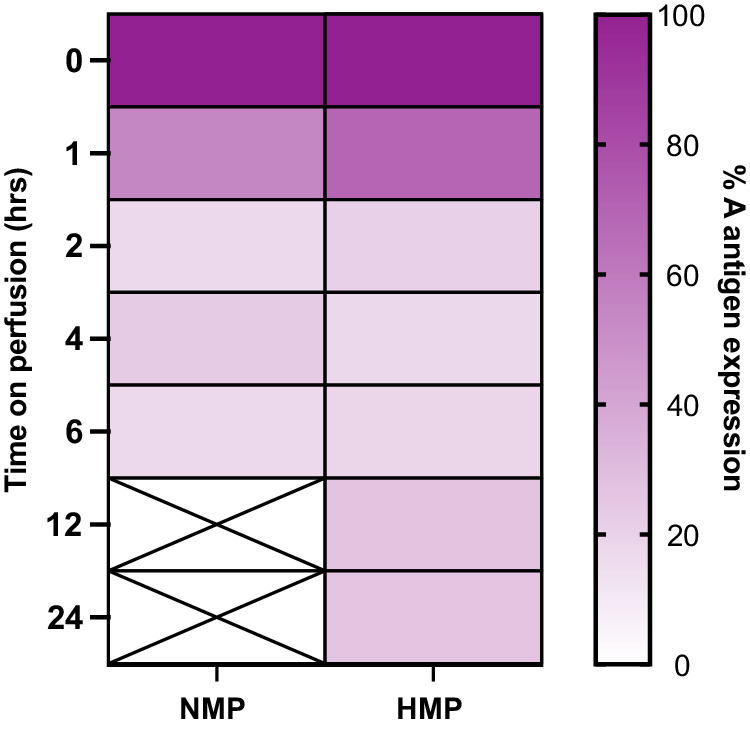
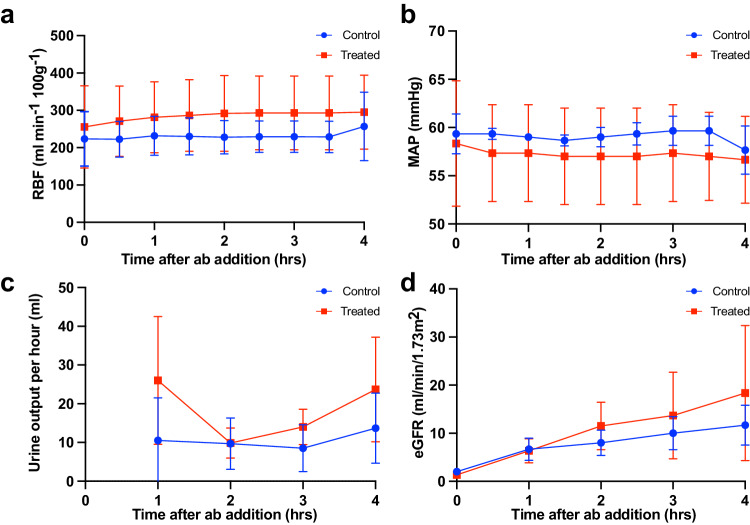
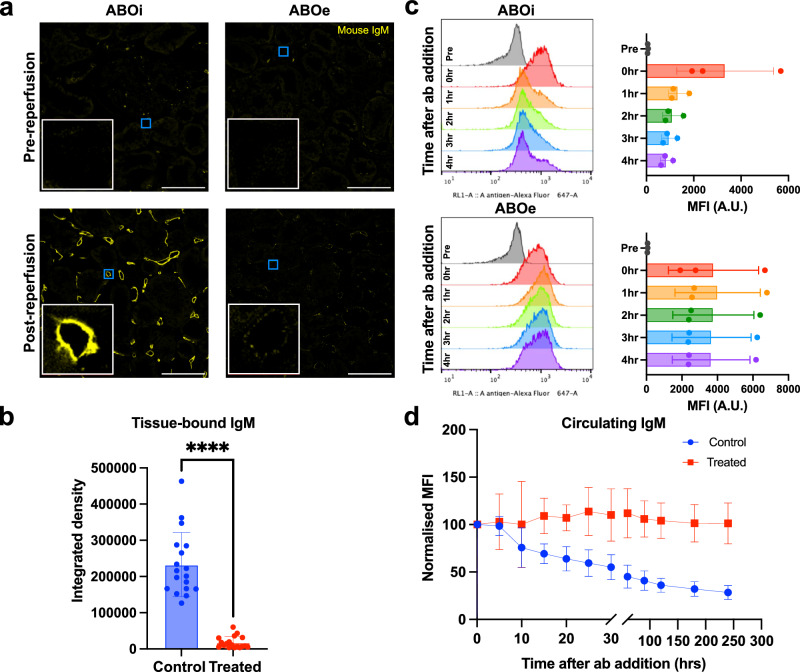
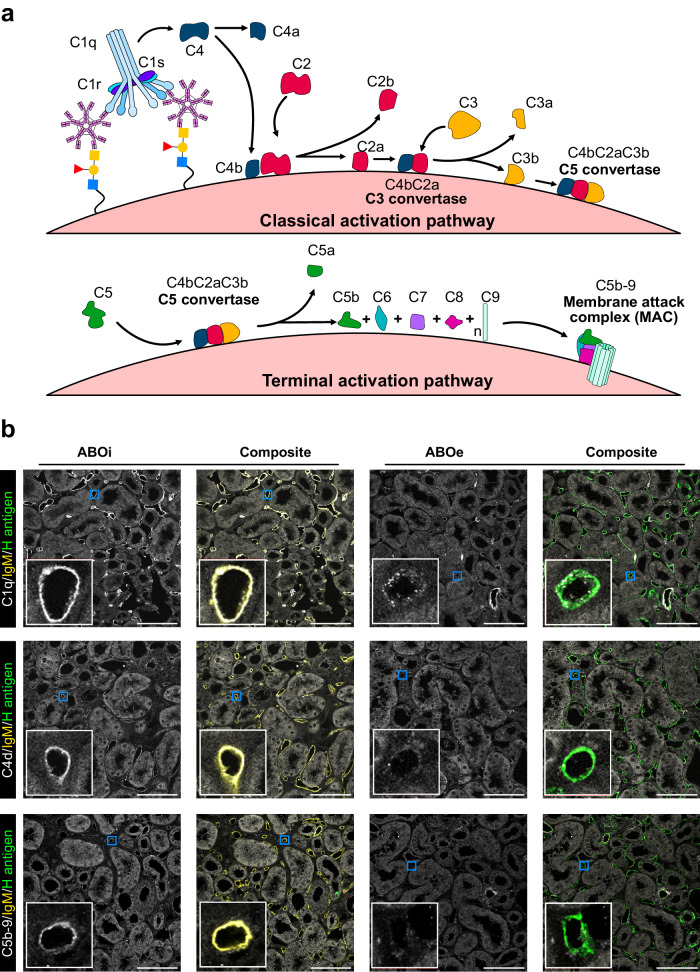
ABO blood group compatibility restrictions present the first barrier to donor-recipient matching in kidney transplantation. Here, we present the use of two enzymes, FpGalNAc deacetylase and FpGalactosaminidase, from the bacterium Flavonifractor plautii to enzymatically convert blood group A antigens from the renal vasculature of human kidneys to 'universal' O-type. Using normothermic machine perfusion (NMP) and hypothermic machine perfusion (HMP) strategies, we demonstrate blood group A antigen loss of approximately 80% in as little as 2 h NMP and HMP. Furthermore, we show that treated kidneys do not bind circulating anti-A antibodies in an ex vivo model of ABO-incompatible transplantation and do not activate the classical complement pathway. This strategy presents a solution to the donor organ shortage crisis with the potential for direct clinical translation to reduce waiting times for patients with end stage renal disease.


Conflict of interest statement

S.G.W., J.N.K., S.Macdonald and P.R. are founders of Avivo Biomedical Inc., which is commercializing the enzymes described. J.N.K., P.R., and S.G.W. are inventors on patent application (PCT no. WO2020034043A1) submitted by the University of British Columbia. The remaining authors declare no competing interests.

Figures

Fig. 1
Fig. 1. ABO blood group compatibility and structure overview.
a ABO compatibility restrictions in transfusion and transplantation between donors and recipients of all four ABO blood groups (O, A, B, and AB). Arrowheads point from donors to ABO-compatible recipients. b Overview of blood group A or B antigen biogenesis from the core H antigen glycan by the action of the enzyme GTA or GTB, respectively. Enzymatic conversion from A or B antigens back to the H antigen by the action of FpGalNAc deacetylase and FpGalactosaminidase, or α-galactosidase, respectively, are shown by the darker grey arrows. Symbols (above) and numbers (below) within glycan structures indicate the type of linkage between monosaccharides. Type 2 antigen structures are shown. All structures follow the standardised Symbol Nomenclature for Glycans,. GalNAc N-acetylgalactosamine, GlcNAc N-acetylglucosamine, GTA blood group A N-acetylgalactosaminyltransferase, GTB blood group B galactosyltransferase.
Fig. 2
Fig. 2. Blood group A antigen removal during normothermic machine perfusion (NMP).
a Immunofluorescence images of blood group A antigen removal during NMP in control (left column) or treated (right column) type A human kidney cortical biopsies. At each timepoint (pre-treatment, 1 h after enzyme addition, or 6 h after enzyme addition), a composite image of blood group A antigens (magenta) and H antigens (green) is shown. An 8× zoom inlay of a representative peritubular capillary (blue box) is shown in the bottom left of each panel (white box). Scale bar represents 100 μm. b Quantification of A and H antigen expression at 1 h, 2 h, 4 h, and 6 h after enzyme addition in control (blue) and treated (red) kidneys. Antigen expression is normalised to expression level in the pre-perfusion biopsies for n = 3 kidney pairs. Error bars show mean ± 95% confidence intervals. Renal blood flow (RBF; panel c), mean arterial pressure (MAP; panel d) and urine output (e) during perfusion are shown for control and treated kidneys. Error bars show mean ± standard deviation. f The concentration of perfusate and urine NGAL after 6 h perfusion in control and treated kidneys. Error bars show mean ± standard deviation. NMP normothermic machine perfusion, NGAL neutrophil gelatinase-associated lipocalin.
Fig. 3
Fig. 3. Blood group A antigen removal during hypothermic machine perfusion (HMP).
a Immunofluorescence images of blood group A antigen removal during HMP in control (left column) or treated (right column) type A human kidney cortical biopsies. At each timepoint (pre-treatment, 1 h, 2 h or 6 h after enzyme addition) a composite image of blood group A antigens (magenta) and H antigens (green) is shown. An 8× zoom inlay of a representative peritubular capillary (blue box) is shown in the bottom left of each panel (white box). Images are representative of a minimum of n = 3 kidney pairs. Scale bar represents 100 μm. b Quantification of A and H antigen expression at 1–6 h, 12 h and 24 h after enzyme addition in control (blue) and treated (red) kidneys. Antigen expression is normalised to expression levels in the pre-biopsies. Error bars show mean ± 95% confidence intervals. Renal blood flow (RBF; panel c) and mean arterial pressure (MAP; panel d) during perfusion are shown for control and treated kidneys. Error bars show mean ± standard deviation. HMP hypothermic machine perfusion.
Fig. 4
Fig. 4. Heat map summary comparing blood group A antigen loss in NMP vs HMP for FpGalNAc DeAc and FpGalNase-treated kidneys.
Y-axis indicates the hours on perfusion post-enzyme addition. Colour gradient represents percentage blood group A antigen expression from 100% (purple) to 0% (white) normalised to pre-perfusion levels (0 h). Data in each column are the mean expression level from n = 3 pairs except 1 h and 6 h timepoints in the HMP column which are derived from n = 6 kidneys. NMP normothermic machine perfusion, HMP hypothermic machine perfusion.
Fig. 5
Fig. 5. Haemodynamic parameters during ABO-incompatible reperfusion.
Measurements of renal blood flow (RBF; a), mean arterial pressure (MAP; b), urine output (c), and eGFR (d) for control and treated kidneys during 4 h ABOi reperfusion for n = 3 kidney pairs. Error bars show mean ± standard deviation. eGFR estimated glomerular filtration rate, ABOi ABO-incompatible.
Fig. 6
Fig. 6. Anti-A binding during ABO-incompatible reperfusion.
a Immunofluorescence images of cortical kidney biopsies pre-reperfusion and 4 h post-reperfusion. Anti-IgM staining is shown in yellow with a representative capillary selected (blue box) for an 8× zoom inlay (white box). Capillaries in IgM negative sections were selected based on anti-H staining (separate channel, not shown). Scale bar shows 100 μm. b Quantification of IgM staining in control vs treated kidneys. Six fields of view were selected per kidney (n = 3) for 18 images total per group. Data were compared between control and treated groups with a two-tailed Wilcoxon matched-pairs signed rank test. c Representative histogram of IgM-stained RBCs in perfusate samples taken before (pre), immediately after (0 h), and 1–4 h after antibody addition in one control (ABOi) and one treated (ABOe) kidney from a single biological pair. MFI of all kidneys at each timepoint is shown to the right per histogram. d MFI values at all time points normalised to 0 h MFI for n = 3 control and treated kidney pairs. In all cases, error bars show mean ± standard deviation. ****p < 0.0001. A.U. arbitrary units, RBCs red blood cells, MFI median fluorescence intensity.
Fig. 7
Fig. 7. Activation of the classical complement cascade during ABOi reperfusion.
a Schematic overview of the activation of the complement cascade, showing activation of the classical activation pathway (top panel), and terminal activation pathway (bottom panel). b Representative immunofluorescence images of kidney cortical biopsies after 4 h ABO-incompatible reperfusion in control (ABOi) and treated (ABOe) kidneys stained for C1q (top row; grey), C4d (middle row; grey), and C5b-9 (bottom row; grey) for n = 3 biological replicates. An 8× zoom inlay of a representative peritubular capillary (blue box) is shown in the bottom left of each panel (white box). Composite images also show IgM (yellow) and H antigen (green) staining. Scale bar represents 100 μm.

Similar articles

Cited by

References

    1. Annual Activity Report. ODT Clinical - NHS Blood and Transplanthttps://www.odt.nhs.uk/statistics-and-reports/annual-activity-report/.
    1. Böhmig GA, Farkas AM, Eskandary F, Wekerle T. Strategies to overcome the ABO barrier in kidney transplantation. Nat. Rev. Nephrol. 2015;11:732–747. doi: 10.1038/nrneph.2015.144. - DOI - PubMed
    1. MacMillan S, Hosgood SA, Nicholson ML. Enzymatic blood group conversion of human kidneys during ex vivo normothermic machine perfusion. Br. J. Surg. 2022;110:133–137. doi: 10.1093/bjs/znac293. - DOI - PMC - PubMed
    1. Wang A, et al. Ex vivo enzymatic treatment converts blood type A donor lungs into universal blood type lungs. Sci. Transl. Med. 2022;14:eabm7190. doi: 10.1126/scitranslmed.abm7190. - DOI - PubMed
    1. Gilmour J, Griffiths C, Pither T, Scott WEI, Fisher AJ. Normothermic machine perfusion of donor-lungs ex-vivo: promoting clinical adoption. Curr. Opin. Organ Transplant. 2020;25:285. doi: 10.1097/MOT.0000000000000765. - DOI - PubMed

Substances

Grants and funding