. 2024 Mar 30;22(1):321.
doi: 10.1186/s12967-024-05127-5.

An integrated framework for prognosis prediction and drug response modeling in colorectal liver metastasis drug discovery

Affiliations

An integrated framework for prognosis prediction and drug response modeling in colorectal liver metastasis drug discovery

Xiuman Zhou et al. J Transl Med. .

Abstract

Background: Colorectal cancer (CRC) is the third most prevalent cancer globally, and liver metastasis (CRLM) is the primary cause of death. Hence, it is essential to discover novel prognostic biomarkers and therapeutic drugs for CRLM.

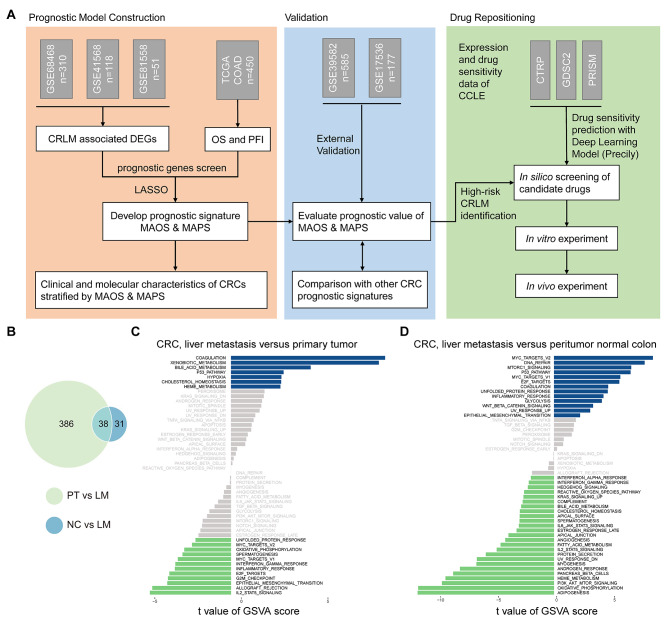
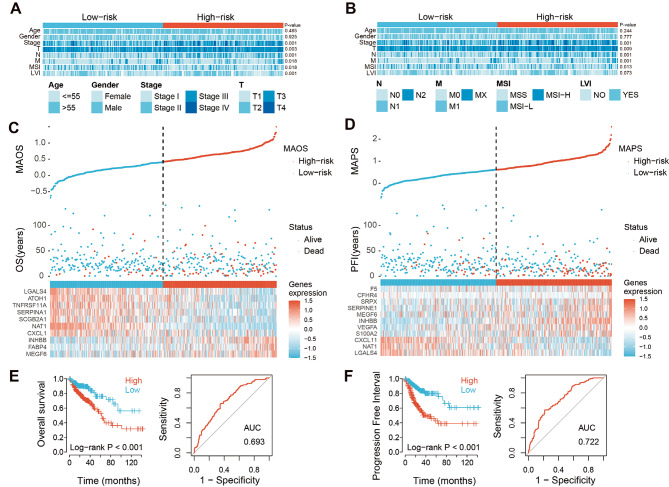
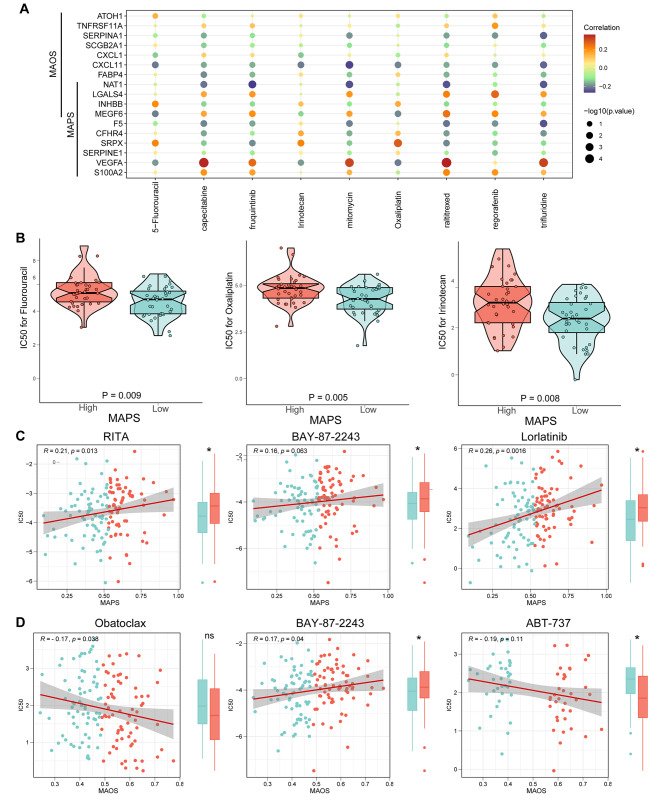
Methods: This study developed two liver metastasis-associated prognostic signatures based on differentially expressed genes (DEGs) in CRLM. Additionally, we employed an interpretable deep learning model utilizing drug sensitivity databases to identify potential therapeutic drugs for high-risk CRLM patients. Subsequently, in vitro and in vivo experiments were performed to verify the efficacy of these compounds.

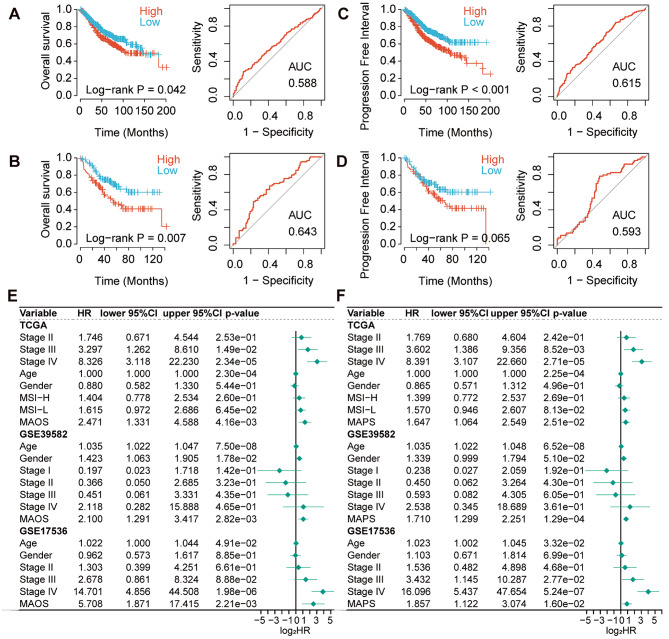
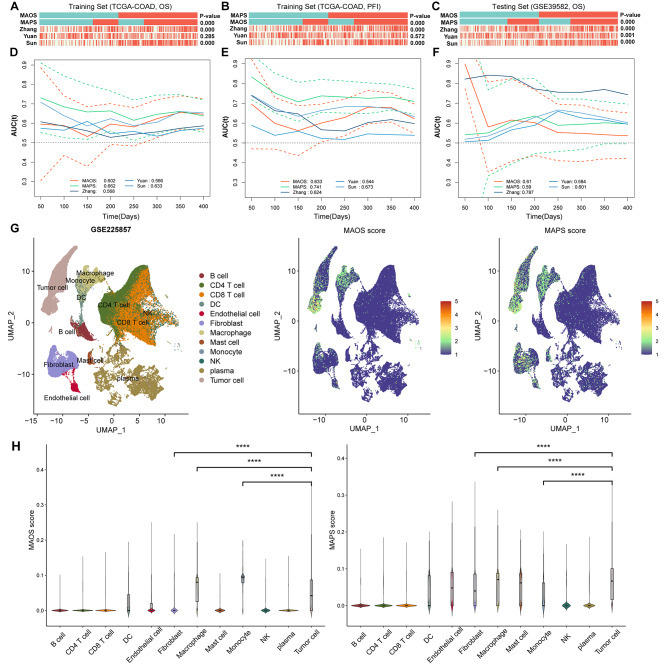
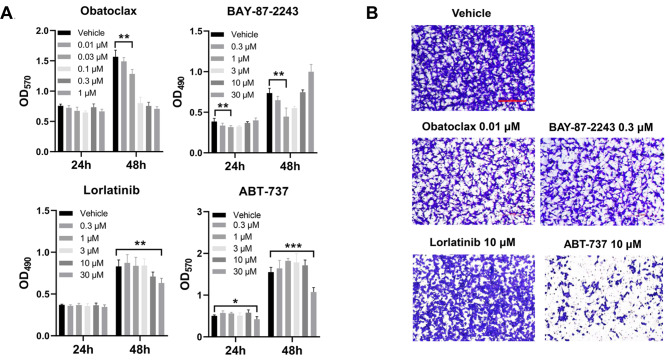
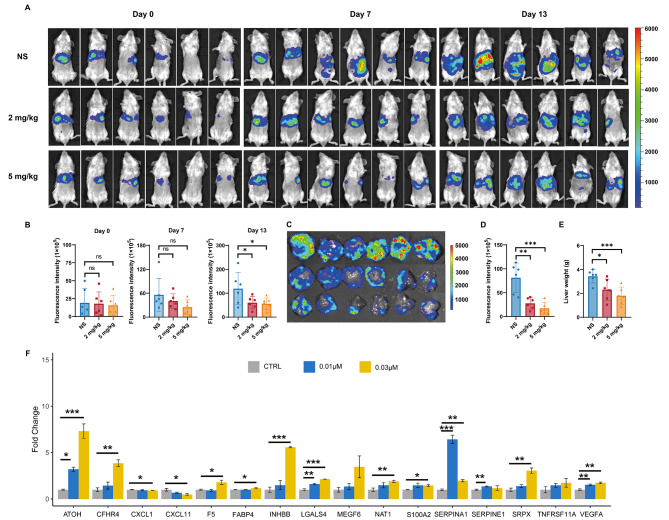
Results: These two prognostic models exhibited superior performance compared to previously reported ones. Obatoclax, a BCL-2 inhibitor, showed significant differential responses between high and low risk groups classified by prognostic models, and demonstrated remarkable effectiveness in both Transwell assay and CT26 colorectal liver metastasis mouse model.

Conclusions: This study highlights the significance of developing specialized prognostication approaches and investigating effective therapeutic drugs for patients with CRLM. The application of a deep learning drug response model provides a new drug discovery strategy for translational medicine in precision oncology.

Keywords: Colorectal liver metastasis; Deep learning; Drug sensitivity; Prognostic biomarker.


Conflict of interest statement

The authors declare no competing interests.

Figures

Fig. 1
Fig. 1
Differentially expressed genes and enriched pathways associated with liver metastases. (A) Schematic diagram of the study design. (B) Venn diagram depicting common liver metastasis-related genes shared by NC vs. LM group and PT vs. LM group. (C) Differences in pathway activities scored by GSVA between liver metastasis tumor and peritumor normal colon. (D) Differences in pathway activities scored by GSVA between liver metastasis tumor and primary colon tumor. NC: peritumor normal colon; LM, liver metastasis; PT, primary colorectal tumor
Fig. 2
Fig. 2
Construction of MAOS and MAPS signatures in TCGA training set. (A and B) Clinical characteristics of MAOS and MAPS signatures in TCGA COAD cohorts, respectively. T, tumor size and local growth; N, extent of lymph node metastases; M, occurrence of distant metastases in tumor-node-metastasis (TNM) system. MSI, microsatellite instability; LVI, Lymphovascular invasion. (C and D) The distribution of risk score, survival status and gene expression panel in the TCGA training set for MAOS and MAPS, respectively. For each patient, a risk score was calculated based on the prognostic signature, and all patients are displayed (sorted from low to high score). The vertical dotted line indicates the median cutoff dividing patients into low-risk and high-risk groups. (E and F) Kaplan-Meier survival analysis and ROC curve analysis for patients in TCGA training set of MAOS and MAPS, respectively
Fig. 3
Fig. 3
Validation of MAOS and MAPS signatures in training and validation datasets. (A and B) Kaplan-Meier plots and the receiver operating characteristic (ROC) curve of MAOS in GSE39582 and GSE17536 validation sets. (C and D) Kaplan-Meier plots and ROC curve of MAPS in the two validation datasets (GSE39582 and GSE17536). (E and F) The multivariate Cox analysis of the MAOS and MAPS signature with other clinicopathological factors in the training TYGA-COAD datasets and two validation datasets (GSE39582 and GSE17536), respectively
Fig. 4
Fig. 4
Evaluation of prognostic value and targeting cell types of MAOS and MAPS. (A) The association between MAOS, MAPS and other three prognostic signatures in TCGA COAD training dataset using overall survival (OS) information. (B) The association between MAOS, MAPS and other three prognostic signatures in TCGA COAD training dataset using progression free interval (PFI) information. (C) The association between MAOS, MAPS and other three prognostic signatures in validation dataset using OS information. (D) The time-dependent area under the receiver operating characteristic (ROC) curves of MAOS, MAPS and other three prognostic signatures in TCGA COAD training dataset using OS information. (E) The time-dependent ROC curves of MAOS, MAPS and other three prognostic signatures in TCGA COAD training dataset using PFI information. (F) The time-dependent ROC curves of MAOS, MAPS and other three prognostic signatures in validation dataset using OS information. Survival difference was compared using log-rank test. Red and Green dotted lines on the time-dependent area under the ROC curve plots represent 95% CI of MAOS and MAPS, respectively. (G) (left) UMAP plot visualization of all cell subtypes from six CRLM patients. Different cell subtypes were annotated by Seurat algorithm. (middle) UMAP plot visualization of the distribution of MAOS score. (right) UMAP plot visualization of the distribution of MAPS score. (H) Violin plot of MAOS (left) and MAPS (right) scores in different cell types. ****, P < 0.0001
Fig. 5
Fig. 5
Identification of candidate drugs for CRLM patients. (A) Bubble plot of the relationship between approved CRLM drugs and signature genes of MAOS and MAPS. (B) Box plots of the comparison of predicted IC50 of approved CRLM drugs Fluorouracil, Oxaliplatin and Irinotecan between high- and low-MAPS groups. (C) Correlation between the predicted IC50 of candidate drugs (RITA, BAY-87-2243 and lorlatinib) and MAPS scores in CRLM cohort. (D) Correlation between the predicted IC50 of candidate drugs (Obatoclax, BAY-87-2243 and ABT-737) and MAOS scores in CRLM cohort. Lower IC50 values imply greater drug sensitivity. P-values of boxplots and violin plots were obtained from the two-sided Wilcoxon rank-sum test
Fig. 6
Fig. 6
The effects of candidate drugs on the proliferation and migration of CT26 cells. (A) Cell proliferation of CT26 cells treated with the candidate drugs at the indicated concentration or the vehicle detected by MTT measuring the absorbance at 490–570 nm. *, P < 0.05, **, P < 0.01, ***, P < 0.001. (B) The migration of CT26 cells treated with the candidate drugs at the indicated concentration or the vehicle for 24 h detected by the Transwell assay. Bar = 250 μm. Representative results of at least three independent experiments were shown
Fig. 7
Fig. 7
The effects of Obatoclax on the liver metastasis of colorectal cancer in vivo. (A) Representative IVIS luciferase in vivo images of mice with CT26-Luc2 cells injected in the spleen and treated with normal saline (NS), 2 mg/kg or 5 mg/kg Obatoclax (n = 6). The images obtained on indicated days were quantified with a unified fluorescence scale. (B) Summary data of the fluorescence intensity of the mice treated on day 0, 7 and 13. *P < 0.05. (C) Images of liver from the tumor bearing mice on day 13. The images obtained were quantified with a unified fluorescence scale. (D) Summary data of fluorescence intensity of the liver. **P < 0.01, *** P < 0.001. (E) Summary data of the liver weight. **P < 0.01, *** P < 0.001. (F) The fold change (FC) in mRNA expression of MAOS and MAPS signature genes in the CT26 cell line before and after treatment with Obatoclax. FC values were calculated by converting the normalized average log2 values of gene expression levels before and after treatment with Obatoclax at concentrations of 0.01 µM and 0.3 µM

Similar articles

Cited by

References

    1. Biller LH, Schrag D. Diagnosis and treatment of metastatic colorectal Cancer: a review. JAMA. 2021;325(7):669–85. doi: 10.1001/jama.2021.0106. - DOI - PubMed
    1. Riihimäki M, Hemminki A, Sundquist J, Hemminki K. Patterns of metastasis in colon and rectal cancer. Sci Rep. 2016;6:29765. doi: 10.1038/srep29765. - DOI - PMC - PubMed
    1. Yamasaki M, Takemasa I, Komori T, Watanabe S, Sekimoto M, Doki Y, Matsubara K, Monden M. The gene expression profile represents the molecular nature of liver metastasis in colorectal cancer. Int J Oncol. 2007;30(1):129–38. - PubMed
    1. Eide PW, Moosavi SH, Eilertsen IA, Brunsell TH, Langerud J, Berg KCG, Rosok BI, Bjornbeth BA, Nesbakken A, Lothe RA, et al. Metastatic heterogeneity of the consensus molecular subtypes of colorectal cancer. NPJ Genom Med. 2021;6(1):59. doi: 10.1038/s41525-021-00223-7. - DOI - PMC - PubMed
    1. Siegel RL, Miller KD, Goding Sauer A, Fedewa SA, Butterly LF, Anderson JC, Cercek A, Smith RA, Jemal A. Colorectal cancer statistics, 2020. CA Cancer J Clin. 2020;70(3):145–64. doi: 10.3322/caac.21601. - DOI - PubMed

Publication types