

Risk analysis of the association between different hemoglobin glycation index and poor prognosis in critical patients with coronary heart disease-A study based on the MIMIC-IV database
- PMID: 38555454
- PMCID: PMC10981833
- DOI: 10.1186/s12933-024-02206-1
Risk analysis of the association between different hemoglobin glycation index and poor prognosis in critical patients with coronary heart disease-A study based on the MIMIC-IV database
Abstract
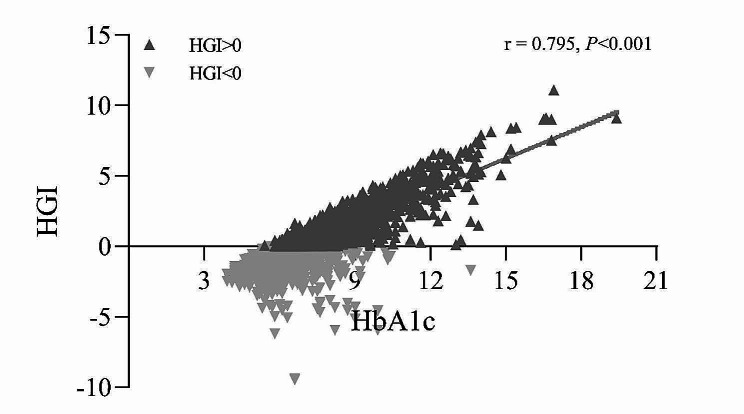
Background: The hemoglobin glycation index (HGI) is the difference between the observed and predicted values of glycosylated hemoglobin (HbA1c), which is closely associated with a variety of poor prognoses. However, there are still no studies on the correlation between HGI and poor prognosis in patients with critical coronary artery disease. The purpose of this study was to analyze the correlation between HGI and all-cause mortality in patients with critical coronary artery disease using the MIMIC-IV database.
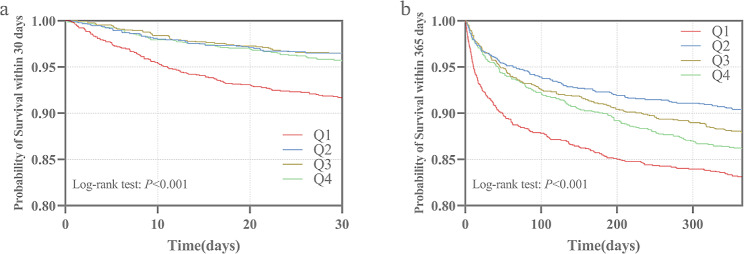
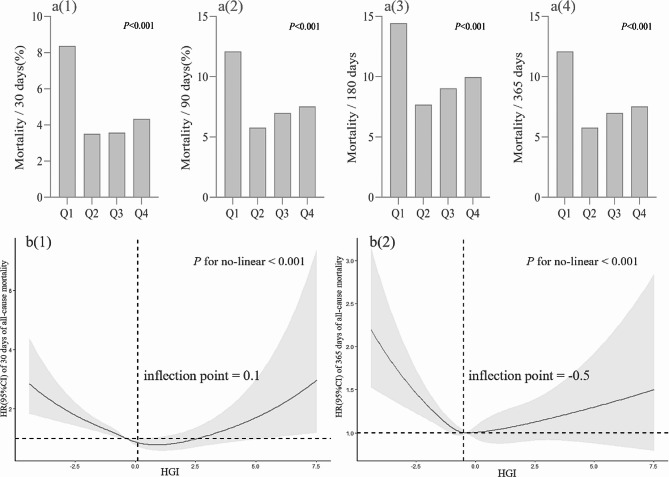
Methods: The HGI was calculated by constructing a linear regression equation between HbA1c and fasting plasma glucose (FPG). A Kaplan‒Meier survival analysis model was constructed based on the HGI quartiles to clarify the differences in all-cause mortality rates between groups, and the log-rank test was used to assess the differences between groups. The hazard ratio (HR) of HGI as a risk factor for outcome events was assessed using the Cox proportional risk model and restricted cubic spline (RCS), with the Q2 group serving as the reference group.
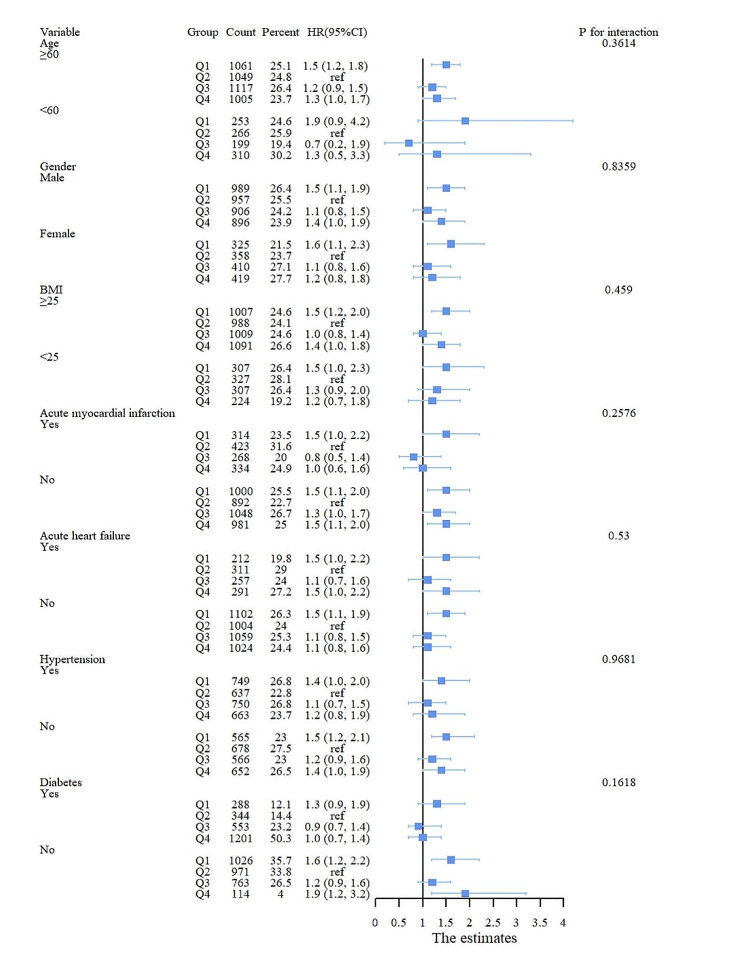
Results: A total of 5260 patients were included in this study. The 30-day mortality rate of the patients was 4.94% and the mortality rate within 365 days was 13.12%. A low HGI was significantly associated with 30-day mortality (HR, 1.96; 95% CI, (1.38, 2.78); P < 0.001) and 365-day mortality (HR, 1.48; 95% CI, (1.19, 1.85); P < 0.001) in patients with critical coronary artery disease in the completely adjusted Cox proportional risk model. In addition, high levels of HGI were associated with 365-day mortality (HR, 1.31; 95% CI, (1.02, 1.69); P < 0.05). RCS analysis revealed a U-shaped relationship between HGI and outcome events. According to the stratified analysis, the interaction test revealed that the correlation between HGI and outcome events remained stable.
Conclusion: There was a significant correlation between HGI and all-cause mortality in patients with critical coronary artery disease, particularly in those with low HGI. HGI can be used as a potential indicator for assessing the short- and long-term risk of mortality in such patients.
Keywords: All-cause mortality; Coronary heart disease; Hemoglobin glycation index; ICU; MIMIC-IV.
© 2024. The Author(s).
Conflict of interest statement
The authors declare no competing interests.
Figures

References
-
- Hasbani NR, Ligthart S, Brown MR, Heath AS, Bebo A, Ashley KE, Boerwinkle E, Morrison AC, Folsom AR, Aguilar D, de Vries PS. American Heart Association’s life’s simple 7: lifestyle recommendations, polygenic risk, and lifetime risk of Coronary Heart Disease. Circulation. 2022;145(11):808–18. doi: 10.1161/CIRCULATIONAHA.121.053730. - DOI - PMC - PubMed
-
- Wang Y, O’Neil A, Jiao Y, Wang L, Huang J, Lan Y, Zhu Y, Yu C. Sex differences in the association between diabetes and risk of cardiovascular disease, cancer, and all-cause and cause-specific mortality: a systematic review and meta-analysis of 5,162,654 participants. BMC Med. 2019;17(1):136. doi: 10.1186/s12916-019-1355-0. - DOI - PMC - PubMed
-
- Peters SA, Huxley RR, Woodward M. Diabetes as risk factor for incident coronary heart disease in women compared with men: a systematic review and meta-analysis of 64 cohorts including 858,507 individuals and 28,203 coronary events. Diabetologia. 2014;57(8):1542–51. doi: 10.1007/s00125-014-3260-6. - DOI - PubMed
MeSH terms
Substances
LinkOut - more resources
Full Text Sources
Medical
