Development and validation of a prognostic model for predicting post-discharge mortality risk in patients with ST-segment elevation myocardial infarction (STEMI) undergoing primary percutaneous coronary intervention (PPCI)
- PMID: 38555468
- PMCID: PMC10981323
- DOI: 10.1186/s13019-024-02665-3
Development and validation of a prognostic model for predicting post-discharge mortality risk in patients with ST-segment elevation myocardial infarction (STEMI) undergoing primary percutaneous coronary intervention (PPCI)
Abstract
Background: Accurately predicting post-discharge mortality risk in patients with ST-segment elevation myocardial infarction (STEMI) undergoing primary percutaneous coronary intervention (PPCI) remains a complex and critical challenge. The primary objective of this study was to develop and validate a robust risk prediction model to assess the 12-month and 24-month mortality risk in STEMI patients after hospital discharge.
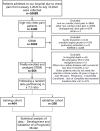
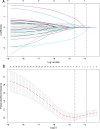
Methods: A retrospective study was conducted on 664 STEMI patients who underwent PPCI at Xiangtan Central Hospital Chest Pain Center between 2020 and 2022. The dataset was randomly divided into a training cohort (n = 464) and a validation cohort (n = 200) using a 7:3 ratio. The primary outcome was all-cause mortality following hospital discharge. The least absolute shrinkage and selection operator (LASSO) regression model was employed to identify the optimal predictive variables. Based on these variables, a regression model was constructed to determine the significant predictors of mortality. The performance of the model was evaluated using receiver operating characteristic (ROC) curve analysis and decision curve analysis (DCA).
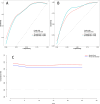
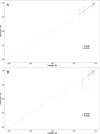
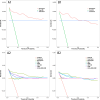
Results: The prognostic model was developed based on the LASSO regression results and further validated using the independent validation cohort. LASSO regression identified five important predictors: age, Killip classification, B-type natriuretic peptide precursor (NTpro-BNP), left ventricular ejection fraction (LVEF), and the usage of angiotensin-converting enzyme inhibitors/angiotensin receptor blockers/angiotensin receptor-neprilysin inhibitors (ACEI/ARB/ARNI). The Harrell's concordance index (C-index) for the training and validation cohorts were 0.863 (95% CI: 0.792-0.934) and 0.888 (95% CI: 0.821-0.955), respectively. The area under the curve (AUC) for the training cohort at 12 months and 24 months was 0.785 (95% CI: 0.771-0.948) and 0.812 (95% CI: 0.772-0.940), respectively, while the corresponding values for the validation cohort were 0.864 (95% CI: 0.604-0.965) and 0.845 (95% CI: 0.705-0.951). These results confirm the stability and predictive accuracy of our model, demonstrating its reliable discriminative ability for post-discharge all-cause mortality risk. DCA analysis exhibited favorable net benefit of the nomogram.
Conclusion: The developed nomogram shows potential as a tool for predicting post-discharge mortality in STEMI patients undergoing PPCI. However, its full utility awaits confirmation through broader external and temporal validation.
Keywords: All-cause mortality risk; Decision Curve Analysis (DCA); Least Absolute Shrinkage and Selection Operator (LASSO); Predictive model; ST-segment elevation myocardial infarction (STEMI).
© 2024. The Author(s).
Conflict of interest statement
The authors declare no competing interests.
Figures


Similar articles
-
Short-term efficacy of angiotensin receptor-neprilysin inhibitor treatment in patients with ST-segment elevation myocardial infarction with reduced ejection fraction after primary percutaneous coronary intervention: a propensity score matching study.BMC Cardiovasc Disord. 2022 Nov 4;22(1):463. doi: 10.1186/s12872-022-02906-0. BMC Cardiovasc Disord. 2022. PMID: 36333668 Free PMC article.
-
Establishment and validation of a risk model for prediction of in-hospital mortality in patients with acute ST-elevation myocardial infarction after primary PCI.BMC Cardiovasc Disord. 2020 Dec 9;20(1):513. doi: 10.1186/s12872-020-01804-7. BMC Cardiovasc Disord. 2020. PMID: 33297955 Free PMC article.
-
A Predictive Model for Contrast-Induced Acute Kidney Injury After Percutaneous Coronary Intervention in Elderly Patients with ST-Segment Elevation Myocardial Infarction.Clin Interv Aging. 2023 Mar 22;18:453-465. doi: 10.2147/CIA.S402408. eCollection 2023. Clin Interv Aging. 2023. PMID: 36987461 Free PMC article. Clinical Trial.
-
Treatment and Care of Patients with ST-Segment Elevation Myocardial Infarction-What Challenges Remain after Three Decades of Primary Percutaneous Coronary Intervention?J Clin Med. 2024 May 15;13(10):2923. doi: 10.3390/jcm13102923. J Clin Med. 2024. PMID: 38792463 Free PMC article. Review.
-
Mortality prediction algorithms for patients undergoing primary percutaneous coronary intervention.J Thorac Dis. 2020 Apr;12(4):1706-1720. doi: 10.21037/jtd.2019.12.83. J Thorac Dis. 2020. PMID: 32395313 Free PMC article. Review.
Cited by
-
An integrated signature of clinical metrics and immune-related genes as a prognostic indicator for ST-segment elevation myocardial infarction patient survival.Heliyon. 2024 May 15;10(10):e31247. doi: 10.1016/j.heliyon.2024.e31247. eCollection 2024 May 30. Heliyon. 2024. PMID: 38813183 Free PMC article.
References
-
- Ibanez B, James S, Agewall S, Antunes MJ, Bucciarelli-Ducci C, Bueno H, Caforio A, Crea F, Goudevenos JA, Halvorsen S, Hindricks G, Kastrati A, Lenzen MJ, Prescott E, Roffi M, Valgimigli M, Varenhorst C, Vranckx P, Widimsky P. 2017 ESC Guidelines for the management of acute myocardial infarction in patients presenting with ST-segment elevation: The Task Force for the management of acute myocardial infarction in patients presenting with ST-segment elevation of the European Society of Cardiology (ESC) EUR HEART J. 2018;39(2):119–177. doi: 10.1093/eurheartj/ehx393. - DOI - PubMed
-
- Morrow DA, Antman EM, Charlesworth A, Cairns R, Murphy SA, de Lemos JA, Giugliano RP, McCabe CH, Braunwald E. TIMI risk score for ST-elevation myocardial infarction: a convenient, bedside, clinical score for risk assessment at presentation: an intravenous nPA for treatment of infarcting myocardium early II trial substudy. Circulation. 2000;102(17):2031–2037. doi: 10.1161/01.CIR.102.17.2031. - DOI - PubMed
-
- Antman EM, Cohen M, Bernink PJ, McCabe CH, Horacek T, Papuchis G, Mautner B, Corbalan R, Radley D, Braunwald E. The TIMI risk score for unstable angina/non-ST elevation MI: a method for prognostication and therapeutic decision making. JAMA. 2000;284(7):835–842. doi: 10.1001/jama.284.7.835. - DOI - PubMed
-
- Fang C, Chen Z, Zhang J, Jin X, Yang M. Construction and evaluation of nomogram model for individualized prediction of risk of major adverse cardiovascular events during hospitalization after percutaneous coronary intervention in patients with acute ST-segment elevation myocardial infarction. Front Cardiovasc Med. 2022;9:1050785. doi: 10.3389/fcvm.2022.1050785. - DOI - PMC - PubMed
MeSH terms
Substances
LinkOut - more resources
Full Text Sources

