. 2024 Apr;56(4):890-903.
doi: 10.1038/s12276-024-01188-0. Epub 2024 Apr 1.

The acute phase reactant orosomucoid-2 directly promotes rheumatoid inflammation

Affiliations

The acute phase reactant orosomucoid-2 directly promotes rheumatoid inflammation

Ki-Myo Kim et al. Exp Mol Med. 2024 Apr.

Abstract

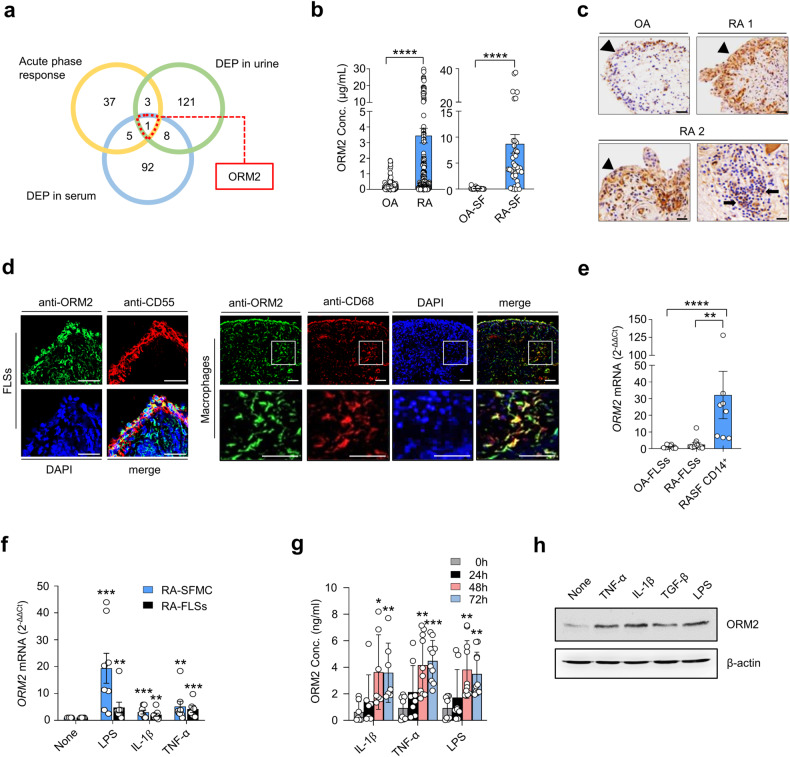
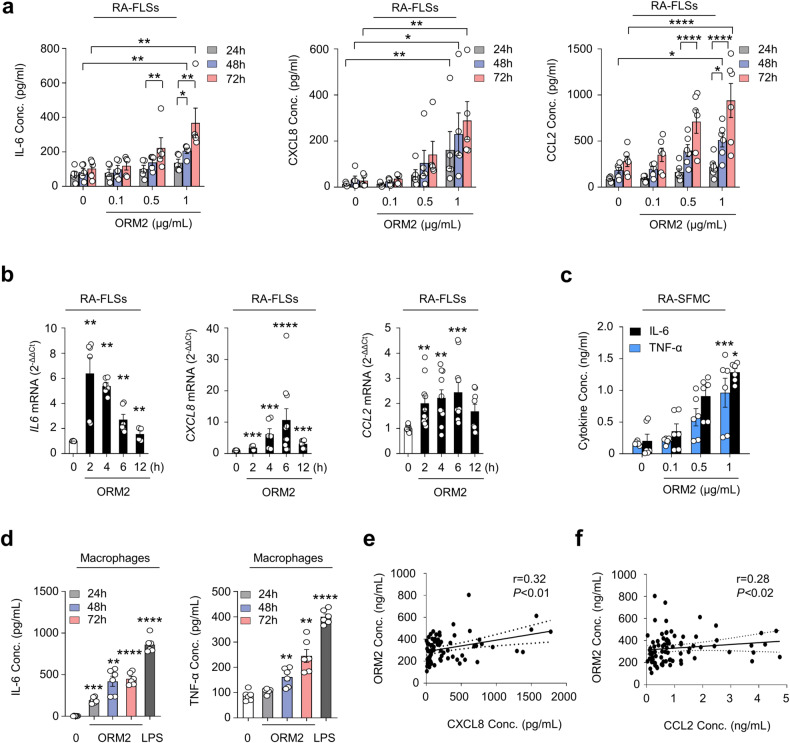
Acute phase proteins involved in chronic inflammatory diseases have not been systematically analyzed. Here, global proteome profiling of serum and urine revealed that orosomucoid-2 (ORM2), an acute phase reactant, was differentially expressed in rheumatoid arthritis (RA) patients and showed the highest fold change. Therefore, we questioned the extent to which ORM2, which is produced mainly in the liver, actively participates in rheumatoid inflammation. Surprisingly, ORM2 expression was upregulated in the synovial fluids and synovial membranes of RA patients. The major cell types producing ORM2 were synovial macrophages and fibroblast-like synoviocytes (FLSs) from RA patients. Recombinant ORM2 robustly increased IL-6, TNF-α, CXCL8 (IL-8), and CCL2 production by RA macrophages and FLSs via the NF-κB and p38 MAPK pathways. Interestingly, glycophorin C, a membrane protein for determining erythrocyte shape, was the receptor for ORM2. Intra-articular injection of ORM2 increased the severity of arthritis in mice and accelerated the infiltration of macrophages into the affected joints. Moreover, circulating ORM2 levels correlated with RA activity and radiographic progression. In conclusion, the acute phase protein ORM2 can directly increase the production of proinflammatory mediators and promote chronic arthritis in mice, suggesting that ORM2 could be a new therapeutic target for RA.


Conflict of interest statement

The authors declare no competing interests.

Figures

Fig. 1
Fig. 1. Expression of ORM2 in the synovia, synovial fluids, and synoviocytes of RA patients.
a Venn diagram depicting the number of common and distinct acute phase response proteins, differentially expressed proteins (DEPs) in RA patient urine, and DEPs in RA patient serum. b ORM2 concentrations in the sera of RA patients (n = 179, left panel), the sera of osteoarthritis (OA) patients (n = 109, left panel), the synovial fluids of RA patients (RA-SF; n = 40, right panel), and the synovial fluids of OA patients (OA-SF; n = 25, right panel) as determined by ELISA. The bar graphs represent the mean ± SD. ****P < 0.0001 according to the Mann‒Whitney U test. c Immunohistochemical staining for ORM2 in the synovial tissues of RA patients (RA1 and RA2) and an OA patient using anti-ORM2 antibodies (Abs). Arrowheads and arrows indicate the lining layer and sublining leukocytes, respectively. Scale bars: 50 μm. d Double immunofluorescence staining of RA synovial tissue using Abs against ORM2, CD55, and CD68. Scale bars: 50 μm. The rectangular area in the top panel is magnified to the bottom panel. Scale bars: 50 μm. See Supplementary Fig. 2 for the immunofluorescence staining of the synovium from three other RA patients. e qRT‒PCR assays for ORM2 expression in cultured fibroblast-like synoviocytes from OA patients (OA-FLSs, n = 12), cultured FLSs from RA patients (RA-FLSs, n = 12), and CD14+ macrophages/monocytes (n = 8) isolated from the synovial fluids of RA patients as determined by qRT‒PCR. ORM2 mRNA expression levels were first normalized to those of GAPDH (internal control) and subsequently further normalized to the mean mRNA expression level in OA-FLSs. f Induction of ORM2 in RA mononuclear cells and RA-FLSs by LPS and proinflammatory cytokines. Mononuclear cells (5 × 105) freshly isolated from the synovial fluid of RA patients (RA-SFMCs) and RA-FLSs (2 × 105) were stimulated with LPS (1 μg/mL), TNF-α (10 ng/mL), or IL-1β (1 ng/mL) for 24 h. ORM2 mRNA expression levels, which were determined by qRT‒PCR, were first normalized to the expression of GAPDH and subsequently further normalized to the mean mRNA expression in unstimulated cells. g ORM2 secretion by CD14+ cells. CD14+ cells were isolated from RA synovial fluids and then stimulated with IL-1β (1 ng/mL), TNF-α (10 ng/mL), and LPS (1 μg/mL) for the indicated times. ORM2 levels in culture supernatants were measured via ELISA. h Western blot analysis of ORM2 expression in RA-FLSs. RA-FLSs were stimulated with TNF-α (10 ng/mL), IL-1β (1 ng/mL), TGF-β (10 ng/mL), and LPS (1 μg/mL) for 48 h; a representative of more than three experiments is shown. The data are presented as the mean ± SEM of more than three independent experiments. *P < 0.05, **P < 0.01, ***P < 0.001, and ****P < 0.0001 according to the Kruskal–Wallis test (E: P = 0.0001, RA-SFMC in (f): P = 0.0001; RA-FLSs in (f): P = 0.0027; IL-1β in (g): P = 0.0025; TNF-α in (g): P = 0.0002; and LPS in (g): P = 0.0004) with Dunn’s multiple comparisons test for (e) and (g) or with post hoc pairwise comparisons test using a Mann–Whitney U test for (f).
Fig. 2
Fig. 2. Increase in proinflammatory cytokine production after treatment with recombinant ORM2.
a Upregulation of IL-6, CXCL8, and CCL2 expression in RA-FLSs induced by recombinant ORM2. RA-FLSs (2 × 104, n = 5–6) were cultured in DMEM supplemented with 1% FBS and stimulated with recombinant ORM2 at various concentrations (0.1 to 1 μg/mL) in the presence of polymyxin B (30 μg/mL) for the indicated times. The IL-6 and CXCL8 concentrations (Conc.) in the culture supernatants were measured via ELISA. b ORM2 upregulated the mRNA expression of the IL6, CXCL8, and CCL2 in RA-FLSs, as determined by qRT‒PCR. RA-FLSs were stimulated with recombinant ORM2 (1 μg/mL) for the indicated times. GAPDH mRNA was used as an internal control. c, d ORM2 increased IL-6 and TNF-α production in synovial fluid mononuclear cells from RA patients (RA-SFMCs) (c) and in macrophages differentiated from peripheral monocytes (d). RA-SFMCs (1 × 106) were freshly isolated from the synovial fluids of RA patients and then stimulated with various concentrations of ORM2 (0.1–1 μg/mL) for 72 h. Peripheral monocytes were obtained from blood samples of healthy donors (n = 6) and differentiated into macrophages by incubating them in the presence of M-CSF (20 ng/mL) for 3 days. The resulting macrophages (1 × 106) were stimulated with recombinant ORM2 (1 μg/mL) in the presence of polymyxin B (30 μg/mL) for the indicated times. IL-6 and TNF-α levels in culture supernatants were determined via ELISA. The data in (ad) represent the mean ± SEM of more than three independent experiments. *P < 0.05, **P < 0.01, ***P < 0.001, and ****P < 0.0001 according to the Friedman test (IL-6 in a: P < 0.0001, CXCL8 in A: P < 0.0001) with post hoc pairwise comparisons using a Mann–Whitney U test; two-way ANOVA (P < 0.0001) with Tukey’s multiple comparisons test for CCL2 in (a); Kruskal–Wallis test (IL6 in (b): P = 0.0001; CXCL8 in (b): P < 0.0001; CCL2 in (b): P = 0.003; and TNF-α in (c): P = 0.009) with post hoc pairwise comparisons using the Mann–Whitney U test for IL6 and CXCL8 in (b) or with Dunn’s multiple comparisons for CCL2 in (b) and TNF-α in (c); and Brown-Forsythe and Welch ANOVA (IL-6 in (c): P = 0.0084, IL-6 in (d): P < 0.0001, and TNF-α in (d): P < 0.0001) with the Dunnett T3 multiple-comparison test versus untreated cells. e, f Scatter plot presenting the correlations between the ORM2 concentration and the CXCL8 (e) or CCL2 (f) level in RA synovial fluid (n = 81). The data were assessed by Spearman’s correlation coefficient analysis.
Fig. 3
Fig. 3. Involvement of the NF-κB and p38 pathways in ORM2-induced cytokine production.
a Effect of NF-κB and p38 MAP kinase inhibitors on ORM2-stimulated IL6 and CXCL8 expression. RA-FLSs were pretreated with PDTC (10 μM), BAY 117082 (40 μM), or SB203580 (10 μM) for 1 h and then stimulated with recombinant ORM2 (1 μg/mL) for 6 h. IL6 and CXCL8 mRNA levels were assessed by qRT‒PCR. The data are presented as the mean ± SEM of more than three independent experiments. **P < 0.01 and ****P < 0.0001 versus ORM2 according to the Kruskal–Wallis test (IL6: P < 0.0001, CXCL8: P < 0.0001) with post hoc pairwise comparisons test using the Mann–Whitney U test. b Immunocytochemistry analysis of NF-κB p65 in RA-FLSs. Cells were activated with ORM2 (1 μg/mL) or LPS (100 ng/mL) for the indicated times. Representative confocal images of p65 translocation to the nucleus are presented. The extent of nuclear translocation (%) was manually counted and is presented in the bar graph. The data are presented as the mean ± SEM of more than three independent experiments. **P < 0.01 and ***P < 0.001 versus no ORM2 according to two-way ANOVA (P < 0.0001) with Sadik’s multiple comparisons. Scale bar: 20 μm. c Western blot analysis of IκB-α, NF-κB phospho-p65 (p-p65), and NF-κB p65 in RA-FLSs stimulated with ORM2 for the indicated times (minutes [m]). d, e Decrease in ORM2-induced IL6 and CXCL8 mRNA levels induced by knockdown of NF-κB p65. RA-FLSs were transfected with NF-κB p65 siRNAs (si-p65, 50 nM) or control siRNAs (si Con, 50 nM) for 24 h. NF-κB p65 expression was determined by qRT‒PCR (left in d) and Western blot analysis (right in d). IL6 and CXCL8 expression levels were determined by qRT‒PCR (e). f Total p38 and phospho-p38 (p-p38) expression levels in RA-FLSs determined by Western blotting after stimulation with ORM2 for the indicated times (minutes). g Downregulation of p38 expression after 24 h of transfection with p38 siRNAs (si p38, 50 nM), as determined by qRT‒PCR (left) and Western blot analysis (right). h qRT‒PCR analysis of IL6 and CXCL8 expression. i NF-κB p65 and p38 expression in double-knockdown cells was analyzed via qRT‒PCR. After p38 transcripts were knocked down for 24 h, RA-FLSs (n = 6) were transfected again with si-p65 for an additional 24 h. j qRT‒PCR analysis of IL6 and CXCL8 expression. The qRT‒PCR data in (e), (h), and (j) were obtained for the siRNA-transfected RA-FLSs (n = 5) 6 h after stimulation with ORM2 (1 μg/mL). The Western blot data in (c), (d), (f), and (g) are representative of three independent experiments. The bar graphs represent the mean ± SEM. *P < 0.05, **P < 0.01, ***P < 0.001, and ****P < 0.0001 according to the Mann‒Whitney U test for (d) and (g); one-way ANOVA (IL6 in (e): P = 0.0003; IL6 in (h): P = 0.0004) with Tukey’s multiple comparisons test; Kruskal‒Wallis test (CXCL8 in (e): P < 0.0001; CXCL8 in (h): P < 0.0001; p38 in (i): P = 0.0002; and IL6 in (j): P = 0.001) with post hoc pairwise comparisons test using a Mann‒Whitney U test; and Brown-Forsythe and Welch ANOVA (P < 0.0001) with Dunnett T3 multiple-comparison test for CXCL8 in (j).
Fig. 4
Fig. 4. Expression and function of glycophorin C in macrophages and RA-FLSs.
a Flow cytometry analysis of the effect of glycophorin C (GYPC) on macrophages. CD14+ monocytes were isolated from healthy donors (n = 4) and differentiated into macrophages by treatment with M-CSF (20 ng/mL) for 3 days. The cells were then cultured in the absence or presence of IL-1β (10 ng/mL), TNF-α (10 ng/mL), LPS (100 ng/mL), or IL-6 (10 ng/mL) for 24 h. A representative plot is shown in the left panel. The data are presented as the mean ± SEM. *P < 0.05, **P < 0.001 versus media alone according to one-way ANOVA (P = 0.01) with Dunnett’s multiple comparisons test. b Flow cytometry analysis of GYPC on RA-FLSs. RA-FLSs (n = 4) were stimulated with media alone, IL-1β (10 ng/mL), TNF-α (10 ng/mL), or LPS (100 ng/mL) for 48 h. A representative plot is shown in the left panel. The data are presented as the mean ± SEM. *P < 0.05, ***P < 0.001, and ****P < 0.0001 versus media alone according to one-way ANOVA (P < 0.0001) with Tukey’s multiple comparisons test for GYPC+ cells and the Kruskal–Wallis test (P < 0.0001) with Dunn’s multiple comparisons test for relative expression of GYPC. c Double immunofluorescence staining of an RA synovium using antibodies against GYPC, CD68, and CD90. The rectangular area in the top panel is magnified to the bottom panel. Scale bars: 50 μm. For additional immunofluorescence staining data, see Supplementary Fig. 7. d Knockdown of GYPC in RA-FLSs. Cells were transfected with GYPC siRNAs (si GYPC) for 24 h and subjected to qRT‒PCR. e Decrease in ORM2-induced IL6 and CXCL8 mRNA expression in RA-FLSs by GYPC knockdown. RA-FLSs were transfected with si GYPC or si Con for 24 h, stimulated with ORM2 (1 μg/mL) for 6 h, and then subjected to qRT‒PCR to measure IL6 and CXCL8 mRNA expression. f GYPC siRNA reduced IL-6 and CXCL8 secretion by RA-FLSs. The cells were transfected with si GYPC or si Con for 24 h and then stimulated with ORM2 for 72 h. The IL-6 and CXCL8 concentrations (Conc.) in the culture supernatants were measured via ELISA. g No effects of si GYPC on TNF-α-induced IL6 and CXCL8 mRNA expression was not detected via qRT‒PCR. RA-FLSs were transfected with si GYPC for 24 h and then stimulated with TNF-α (10 ng/mL) for 6 h. The bar graphs show the mean ± SEM of more than three independent experiments. *P < 0.05, **P < 0.01, ***P < 0.001, and ****P < 0.0001 according to Welch’s t test for (d) and the Kruskal–Wallis test (IL6 in (e): P = 0.0159, CXCL8 in (e): P = 0.0005; IL-6 in (f): P = 0.0022; CXCL8 in (f): P = 0.0182; IL6 in (g): P = 0.0035; and CXCL8 in (g): P = 0.0023) with Dunn’s multiple comparisons test for (e) and (g) or with post hoc pairwise comparisons test using a Mann–Whitney U test for (f).
Fig. 5
Fig. 5. Interaction of ORM2 with its receptor GYPC.
a Proximity ligation assays of RA-FLSs treated with recombinant ORM2 (1 μg/mL). The red fluorescent dots indicate sites at which the ORM2 and GYPC proteins interact on RA-FLSs. The rectangular area in the middle panel (scale bars: 50 μm) is magnified to the right panel (scale bar: 10 μm). b ELISA showing the specific binding of ORM2 to GYPC. The binding plates were coated with recombinant GYPC (rGYPC: 0, 0.5, or 5 μg) and then treated with different amounts (0, 5, 25, or 125 μg) of recombinant ORM2 (rORM2) or bovine serum albumin (BSA). The ‘rORM2 only’ indicates the ELISA results performed with rORM2 at 0, 5, 25, and 125 μg in the absence of the rGYPC coating. c Inhibition of IL-6 and CXCL8 production by the soluble form of GYPC. The cells were pretreated with (soluble) recombinant GYPC (rGYPC: 0.25 and 1 μg/mL) for 1 h and then stimulated with 1 μg/mL recombinant ORM2 (rORM2) for 48 h. IL-6 and CXCL8 levels in the culture supernatants were measured via ELISA. *P < 0.05, **P < 0.01, and ****P < 0.0001. The bar graph in (c) indicates the mean ± SEM of more than three independent experiments; the P values were determined by two-way ANOVA (P < 0.0001) for (b) and one-way ANOVA (IL-6: P < 0.0001; CXCL8: P = 0.0029) with Tukey’s multiple comparisons test for (c).
Fig. 6
Fig. 6. ORM2 expression in mouse synovial tissues and its role in cytokine production.
a Upregulated ORM2 expression in the synovial tissues of mice with collagen-induced arthritis (CIA). Mice treated with vehicle alone were used as controls. Left panel: Immunohistochemical staining of arthritic joints from mice with CIA using an anti-ORM2 Ab. The rectangular area in the top panel (scale bars: 1000 μm) is magnified to the bottom panel (scale bars: 200 μm). Right panel: qRT‒PCR analysis of Orm2 expression in the synovia of mice with CIA (n = 10) and control mice (n = 8). The data are presented as the mean ± SD. ****P < 0.0001 versus control mice according to Welch’s t test. b Double immunofluorescence staining of synovial tissues from mice with CIA using an anti-ORM2 Ab, an anti-CD55 Ab (for synovial fibroblasts), and an anti-F4/80 Ab (for synovial macrophages). In the merged images, ORM2+ cells costained with an anti-CD55 Ab or an anti-F4/80 Ab are shown in yellow. The rectangular area in the upper panel is magnified to the lower panel. Scale bars: 50 μm. For additional immunofluorescence staining data, see Supplementary Fig. 9, which includes synovium staining for two other mice with CIA. c ORM2 upregulated Tnf, Il6, and Ccl2 expression in mouse BMDMs and FLSs. The cells were stimulated with mouse ORM2 (1 μg/mL) for 2 or 6 h and then subjected to qRT‒PCR. *P < 0.05 and **P < 0.01 versus untreated cells. d IL-6, TNF-α, and CCL2 secretion by ORM2-stimulated mouse BMDMs and FLSs was determined via ELISA. The cells were stimulated with mouse ORM2 for 12, 24, or 72 h. *P < 0.05 and **P < 0.01 versus untreated cells. The data in (c) and (d) are presented as the mean ± SEM of more than three independent experiments; the P values were calculated by Brown-Forsythe and Welch ANOVA (P = 0.0023) with Dunnett T3 multiple-comparison test for TNF-α secretion by BMDMs in (c) and Kruskal–Wallis test (Il6 by BMDMs in (c): P < 0.0001; Il6 by FLSs in (c): P < 0.0001; Ccl2 by FLSs in (c): P = 0.0005; IL-6 by BMDMs in (d): P = 0.003; TNF-α by BMDMs in (d): P = 0.0081; IL-6 by FLSs in (d): P = 0.0014; and CCL2 by FLSs in (d): P = 0.0004) with post hoc pairwise comparisons test using a Mann–Whitney U test.
Fig. 7
Fig. 7. In vivo effect and clinical significance of ORM2 in chronic arthritis.
a Dynamic expression of Orm2 in the liver and joints of mice with IL-1β-induced arthritis. After inducing arthritis with IL-1β, the liver (top) and affected joints (bottom) of the mice were harvested on days (d) 0, 1, 3, and 7 and then subjected to qRT‒PCR. The bar graphs represent the mean ± SD. *P < 0.05, **P < 0.01, and ****P < 0.0001 versus Day 0 without arthritis according to the Kruskal–Wallis test (P < 0.0001) with Dunn’s multiple comparisons test for the liver and Brown-Forsythe and Welch ANOVA (P = 0.0003) with the Dunnett T3 multiple-comparison test for the affected joint. b Increased arthritis severity in mice with ORM2-accelerated arthritis (n = 10) compared to mice with IL-1β-induced arthritis only (control mice), as determined by the histological grade of the affected knee joint on Day 7. ORM2-accelerated arthritis was generated by injecting recombinant mouse ORM2 (4 μg) into the ipsilateral knee joint of mice with IL-1β-induced arthritis. IFLM, inflammation; SH, synovial hyperplasia; BD, bone destruction. The rectangular area in the upper panel (scale bars: 1000 μm) is magnified to the bottom panel (scale bars: 200 μm). c Immunohistochemical staining of the affected knee joints of mice with ORM2-accelerated arthritis versus control mice using an anti-NIMP-R14 Ab and an anti-F4/80 Ab. The number of cells positive for each antibody was manually counted. Scale bars: 200 μm. The data are presented as the mean ± SD. ***P < 0.001 and ****P < 0.0001 versus control mice according to the Mann‒Whitney U test for (b) and an unpaired two-tailed t test for (c). d Spearman’s rank correlations of the serum ORM2 concentration with the blood inflammatory marker levels in RA patients. ESR, erythrocyte sedimentation rate; CRP, C-reactive protein; DAS28, Disease Activity Scale with 28-joint assessment. (e) Serum ORM2 concentration (Conc.) according to the radiographic severity of RA. Disease severity was assessed by evaluating radiographic damage via X-rays of the hands and feet, which were taken at baseline and annually thereafter. The statistical analysis in (d) and (e) was performed with Spearman’s correlation coefficient test: *P < 0.05, ***P < 0.001, and ****P < 0.0001.

Similar articles

Cited by

References

    1. Moshage H. Cytokines and the hepatic acute phase response. J. Pathol. 1997;181:257–266. doi: 10.1002/(SICI)1096-9896(199703)181:3<257::AID-PATH756>3.0.CO;2-U. - DOI - PubMed
    1. Gabay C, Kushner I. Acute-phase proteins and other systemic responses to inflammation. N. Engl. J. Med. 1999;340:448–454. doi: 10.1056/NEJM199902113400607. - DOI - PubMed
    1. Hochepied T, Berger FG, Baumann H, Libert C. Alpha(1)-acid glycoprotein: an acute phase protein with inflammatory and immunomodulating properties. Cytokine Growth Factor Rev. 2003;14:25–34. doi: 10.1016/S1359-6101(02)00054-0. - DOI - PubMed
    1. Pepys MB, Hirschfield GM. C-reactive protein: a critical update. J. Clin. Investig. 2003;111:1805–1812. doi: 10.1172/JCI200318921. - DOI - PMC - PubMed
    1. Rodriguez W, et al. Prevention and reversal of nephritis in MRL/lpr mice with a single injection of C-reactive protein. Arthritis Rheumatol. 2006;54:325–335. doi: 10.1002/art.21556. - DOI - PubMed

Publication types

MeSH terms