. 2024 Mar 31;147(1):64.
doi: 10.1007/s00401-024-02714-0.

Microglial phagolysosome dysfunction and altered neural communication amplify phenotypic severity in Prader-Willi Syndrome with larger deletion

Affiliations

Microglial phagolysosome dysfunction and altered neural communication amplify phenotypic severity in Prader-Willi Syndrome with larger deletion

Felipe Correa-da-Silva et al. Acta Neuropathol. .

Abstract

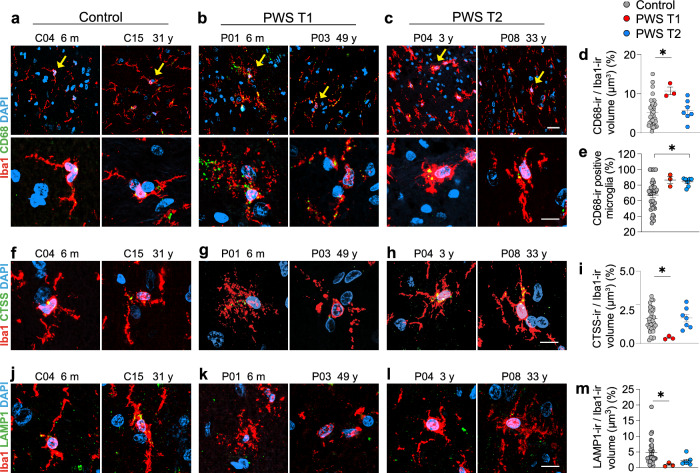
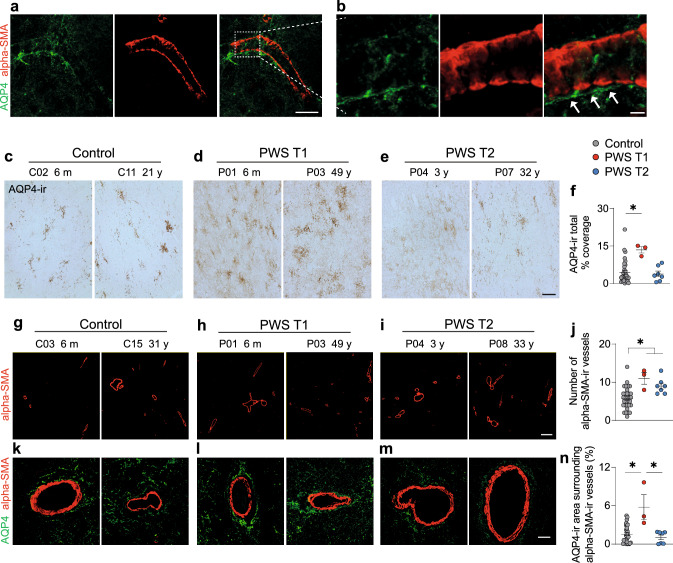
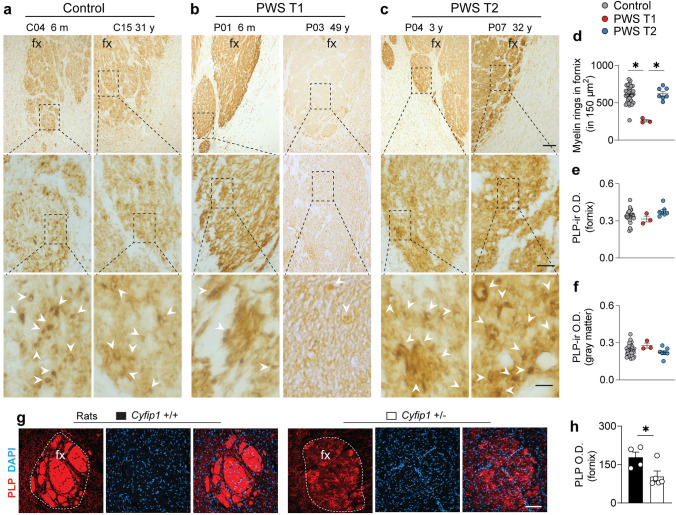
Prader-Willi Syndrome (PWS) is a rare neurodevelopmental disorder of genetic etiology, characterized by paternal deletion of genes located at chromosome 15 in 70% of cases. Two distinct genetic subtypes of PWS deletions are characterized, where type I (PWS T1) carries four extra haploinsufficient genes compared to type II (PWS T2). PWS T1 individuals display more pronounced physiological and cognitive abnormalities than PWS T2, yet the exact neuropathological mechanisms behind these differences remain unclear. Our study employed postmortem hypothalamic tissues from PWS T1 and T2 individuals, conducting transcriptomic analyses and cell-specific protein profiling in white matter, neurons, and glial cells to unravel the cellular and molecular basis of phenotypic severity in PWS sub-genotypes. In PWS T1, key pathways for cell structure, integrity, and neuronal communication are notably diminished, while glymphatic system activity is heightened compared to PWS T2. The microglial defect in PWS T1 appears to stem from gene haploinsufficiency, as global and myeloid-specific Cyfip1 haploinsufficiency in murine models demonstrated. Our findings emphasize microglial phagolysosome dysfunction and altered neural communication as crucial contributors to the severity of PWS T1's phenotype.

Keywords: Fornix; Glymphatic system; Hypothalamus; Immunosurveillance; Microglia; Myelin; Oxytocin.


Conflict of interest statement

The authors have declared that no conflict of interest exists.

Figures

Fig. 1
Fig. 1
Schematic flow of the experimental setup and genetic profiling. a Postmortem hypothalamic tissues were formalin-fixed paraffin-embedded (FFPE) sections, and the consecutive FFPE sections were used for morphological profiling by immunohistochemistry or immunofluorescence. DNA and RNA isolated from these sections were used for genotyping and next-generation RNA sequencing. b Multiplex Ligation-dependent Probe Amplification (MLPA)-assisted genotyping of PWS with copy number. No deletion was observed in control subjects; PWS type 1 (PWS T1) subjects showed a 50% gene dose from BP1 to BP3 (red circles, starting from NIPA1 and TUBGCP5 between BP1 and BP2 (NIPA2 and CYFIP1 between BP1 and BP2 were not included in the MLPA analysis)), PWS type 2 (PWS T2) subjects showed a 50% gene dose from BP2 to BP3 (red circles, starting from MKRN3 and MAGEL2). c The significant differentially expressed genes (DEGs) are depicted as within-gene Z-scores in the heatmap, representing all the genes that are significantly up- or down-regulated when comparing PWS T1 and T2. d The majority of the biological processes down-regulated in PWS T1 compared to PWS T2. e Brain non-neuronal cell-type-specific genes among the DEGs within-gene Z-score. Genes in red color are down-regulated in PWS T1 comparing to PWS T2, genes in black color are down-regulated in PWS T1 comparing to controls
Fig. 2
Fig. 2
PWS T1 deletion is associated with dysmorphic microglia that are partially driven by Cyfip1 haploinsufficiency. a-c Representative images of Iba1-ir cells in the mediobasal hypothalamus of the control (n = 32), PWS T1 (n = 3), and PWS T2 (n = 7) subjects. Dark arrow-pointed microglia in the upper panel of a are shown at a higher magnification in the lower panel. m, months; y, years. d, e Comparison of the hypothalamic Iba1 soma number and relative area of coverage. f Immunohistochemistry for Iba1-ir microglia in the mediobasal hypothalamus of wild-type (n = 6) and Cyfip1 haploinsufficient (n = 8) male rats. Dark arrow-pointed microglia in the left panel of each genotype in f are shown with higher magnification in the two right panels. g-i Iba1-ir cell number and soma size and primary processes in Cyfip1+/− male rats. j Iba1-ir microglia in the mediobasal hypothalamus of control mice (Cx3cr1Cre−ERT+/− Cyfip1fl−/−) (n = 8) or Cx3cr1Cre−ERT+/− Cyfip1fl+/− mice (n = 7) at the age of 32 weeks. Dark arrow-pointed microglia in the left panel of each genotype in j are shown at higher magnification in the right panels. Scale bar: 20 µm in a-c upper panel, 100 µm in f, 50 µm in j. Data are represented as mean ± SEM. Significance in d and e was calculated using the Kruskal–Wallis test, significance in i and m was calculated using the Student’s t-test. * p < 0.05, ** p < 0.01
Fig. 3
Fig. 3
Dysmorphic microglia with PWS T1 deletion are defective in phagolysosome activity. a-c Representative images of CD68 expression in Iba1-ir microglia in the mediobasal hypothalamus of control (n = 32), PWS T1 (n = 3), and PWS T2 (n = 7) subjects. Yellow arrow-pointed microglia in the upper panel are shown at higher magnification in the lower panel of a-c. d-e Quantitative analysis of CD68-ir positive microglia among total Iba1-ir cells and CD68-ir volume relative to the Iba1-ir volume. f–h Representative images of CTSS expression in Iba1-ir microglia. i Quantitative analysis of CTSS-ir volume relative to Iba1-ir volume. j-l Representative images of LAMP1 expression in Iba1-ir microglia. m Quantitative analysis of LAMP1-ir volume relative to Iba1-ir volume. m, months; y, years. Scale bar: 30 µm in the upper panel of a-c, 10 µm in the lower panel of a-c, fh and j-l. Data are presented as mean ± SEM. Significance was calculated using the Kruskal–Wallis test for all comparisons. * p < 0.05
Fig. 4
Fig. 4
Enhanced glymphatic component aquaporin 4 expression in PWS T1 deletion. a, b Illustration of AQP4-ir astrocytes surrounding alpha-SMA-ir vessels that form the perivascular glymphatic system. The white dashed line-framed area in a is shown with higher magnification in b, and white arrows indicate the space between the AQP4-ir astrocytes and the alpha-SMA-ir vessel. c-e Representative images of AQP4-expressing astrocytes in control, PWS T1, and PWS T2 subjects. f Quantitative analysis of AQP4-ir covered area in the hypothalamus. g-i Representative images of alpha-SMA-ir vessels in control, PWS T1, and PWS T2 subjects. j Quantitative analysis of the number of alpha-SMA-ir vessels in the hypothalamus. k-m Representative images of the AQP4-ir astrocytes surrounding the alpha-SMA-ir vessels in control, PWS T1, and PWS T2 subjects. n Quantitative analysis of the area of AQP4-ir surrounding the alpha-SMA-ir vessels. m, months; y, years. Scale bar: 30 µm in a, 5 µm in b, 50 µm in c-e, 150 µm in g-i, 10 µm in k-m. Data are presented as mean ± SEM. Significance was calculated using the Kruskal–Wallis test for all comparisons. * p < 0.05
Fig. 5
Fig. 5
Abnormal white matter microstructure in the fornix of PWS T1 subjects. a-c Representative images of PLP-ir at the level of the fornix in the hypothalamus of controls (n = 32), PWS T1 (n = 3), and PWS T2 (n = 7) individuals. Framed areas in upper and middle panels are displayed in details in their lower panels respectively. Individuals with PWS T1 deletion have aberrant white matter structures, as shown by a drastic reduction in PLP-ir nodes (myelin rings, indicated by white arrowheads) throughout the fornix. d-f Comparison of PLP-ir myelin rings and optical density in the fornix or gray matter outside the fornix. g Fornix outlined by PLP-ir in the hypothalamus of wild-type (n = 4) and Cyfip1 haploinsufficient (n = 4) rats. h Comparison of the PLP-ir optical density in the fornix. Fx, fornix; O.D., optical density; m, months; y, years. Scale bar in a-c, 100 µm in upper panel, 20 µm in middle panel, and 5 µm in lower panel; 100 µm in g. Data are represented as the mean ± SEM. Significance was calculated using the Kruskal–Wallis test for d, e, and f. * p < 0.05
Fig. 6
Fig. 6
Reduced hypothalamic synaptophysin expression in PWS T1 subjects. a-c Representative images of synaptophysin immunoreactivity in the hypothalamus of control (n = 32), PWS T1 (n = 3), and PWS T2 individuals (n = 7). PWS T1 hypothalami showed a reduction in synaptophysin-ir compared to controls indicating defective neuron-neuron communication. Dotted lines frame the fornix. d Quantitative analysis of the hypothalamic synaptophysin, as demonstrated by the relative area of coverage. Fx, fornix; m, months; y, years. Scale bar: 100 µm. Data are represented as mean ± SEM. Significance was calculated using the Kruskal–Wallis test in d. * p < 0.05
Fig. 7
Fig. 7
Schematic representation of the potential mechanism underlying genotype–phenotype association in patients with PWS T1 or T2 deletion. Aberrant actin cytoskeleton in PWS T1 causes cytorrhectic changes in microglia, hampers phagosome-lysosome fusion processes, causes defective myelination by oligodendrocytes, and impairs synaptic transmission. The overall disturbances in microglial immune surveillance in PWS T1 lead to the accumulation of more waste in the microenvironment and stimulate glymphatic system activity

References

    1. Bochukova EG, Lawler K, Croizier S, Keogh JM, Patel N, Strohbehn G, et al. A transcriptomic signature of the hypothalamic response to fasting and BDNF deficiency in Prader-Willi Syndrome. Cell Rep. 2018;22:3401–3408. doi: 10.1016/j.celrep.2018.03.018. - DOI - PMC - PubMed
    1. Braak H, Alafuzoff I, Arzberger T, Kretzschmar H, Del Tredici K. Staging of Alzheimer disease-associated neurofibrillary pathology using paraffin sections and immunocytochemistry. Acta Neuropathol. 2006;112:389–404. doi: 10.1007/s00401-006-0127-z. - DOI - PMC - PubMed
    1. Bray NL, Pimentel H, Melsted P, Pachter L. Near-optimal probabilistic RNA-seq quantification. Nat Biotechnol. 2016;34:525–527. doi: 10.1038/nbt.3519. - DOI - PubMed
    1. Brown SSG, Manning KE, Fletcher P, Holland A. In vivo neuroimaging evidence of hypothalamic alteration in Prader-Willi syndrome. Brain Commun. 2022 doi: 10.1093/braincomms/fcac229. - DOI - PMC - PubMed
    1. Burnett LC, LeDuc CA, Sulsona CR, Paull D, Rausch R, Eddiry S, Carli JF, Morabito MV, Skowronski AA, Hubner G, et al. Deficiency in prohormone convertase PC1 impairs prohormone processing in Prader-Willi syndrome. J Clin Invest. 2017;127:293–305. doi: 10.1172/JCI88648. - DOI - PMC - PubMed

Publication types

Substances