

Laser Capture Microscopy RNA Sequencing for Topological Mapping of Synovial Pathology During Rheumatoid Arthritis
- PMID: 38556917
- PMCID: PMC11949376
- DOI: 10.1002/art.42853
Laser Capture Microscopy RNA Sequencing for Topological Mapping of Synovial Pathology During Rheumatoid Arthritis
Abstract
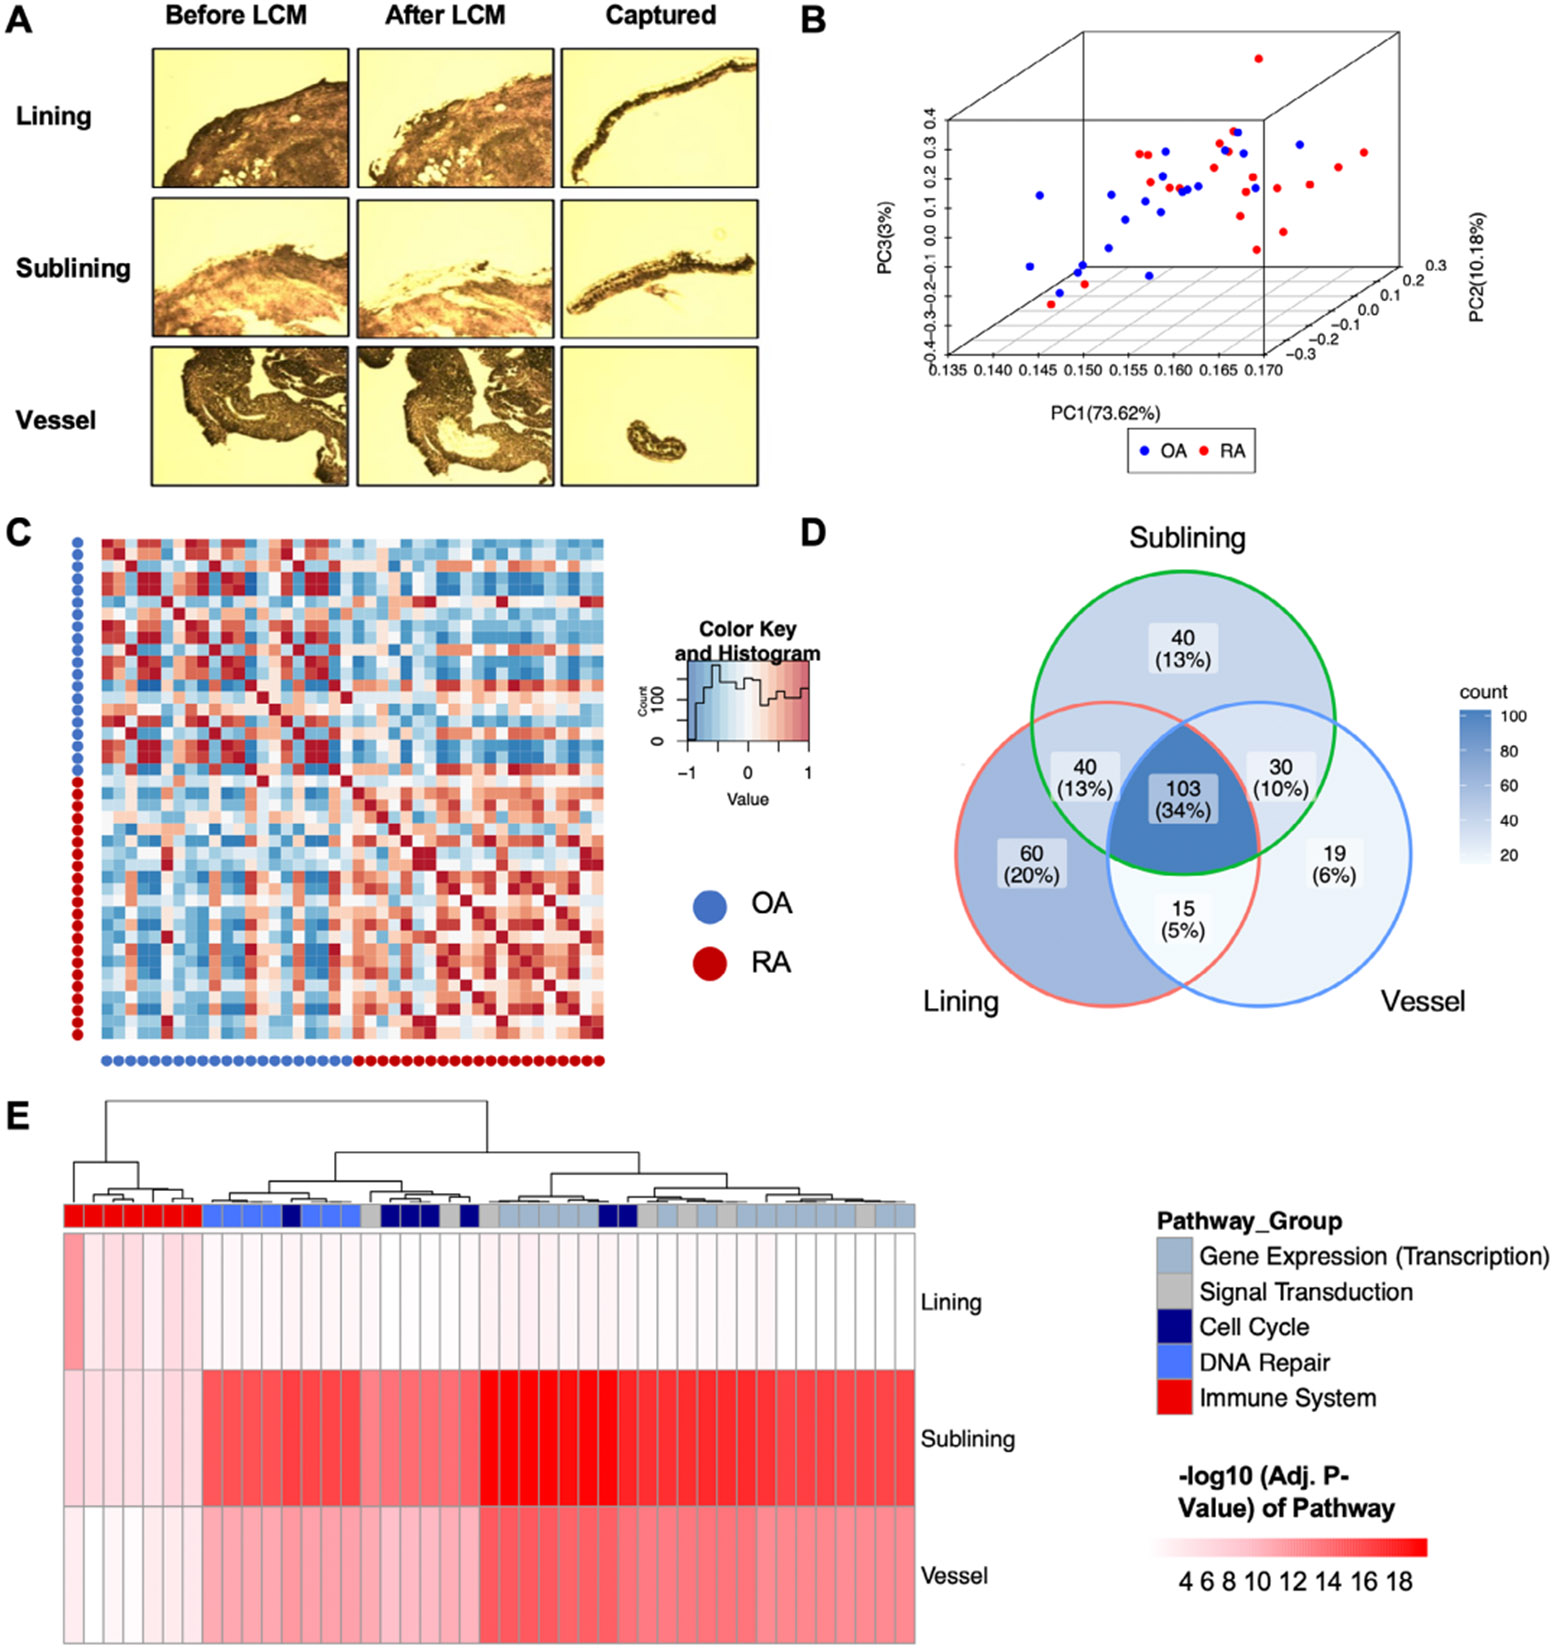
Objective: Rheumatoid arthritis (RA) is an autoimmune disease in which the joint lining or synovium becomes highly inflamed and majorly contributes to disease progression. Understanding pathogenic processes in RA synovium is critical for identifying therapeutic targets. We performed laser capture microscopy (LCM) followed by RNA sequencing (LCM-RNAseq) to study regional transcriptomes throughout RA synovium.
Methods: Synovial lining, sublining, and vessel samples were captured by LCM from seven patients with RA and seven patients with osteoarthritis (OA). RNAseq was performed on RNA extracted from captured tissue. Principal component analysis was performed on the sample set by disease state. Differential expression analysis was performed between disease states based on log2 fold change and q value parameters. Pathway analysis was performed using the Reactome Pathway Database on differentially expressed genes among disease states. Significantly enriched pathways in each synovial region were selected based on the false discovery rate.
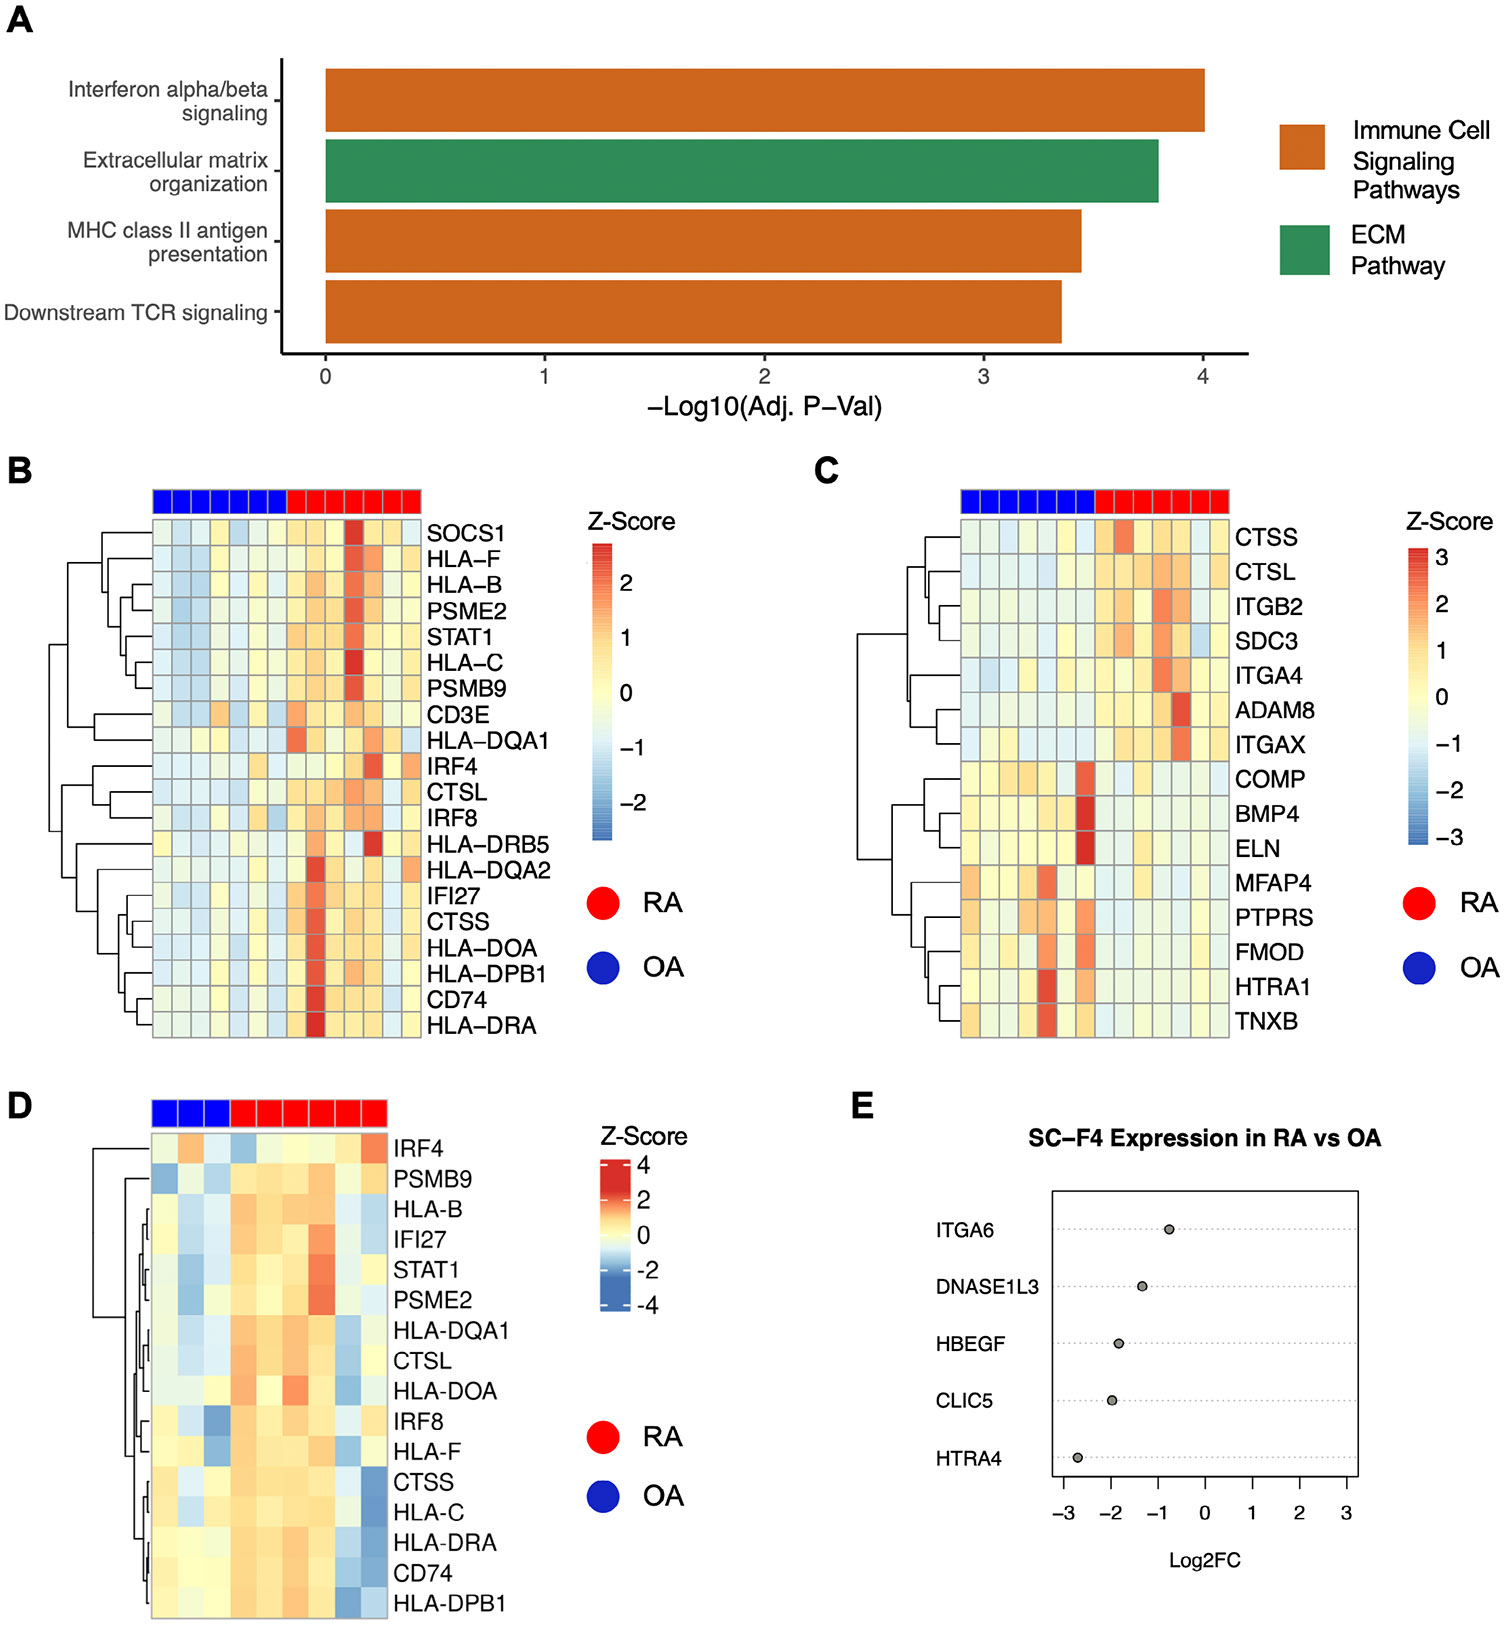
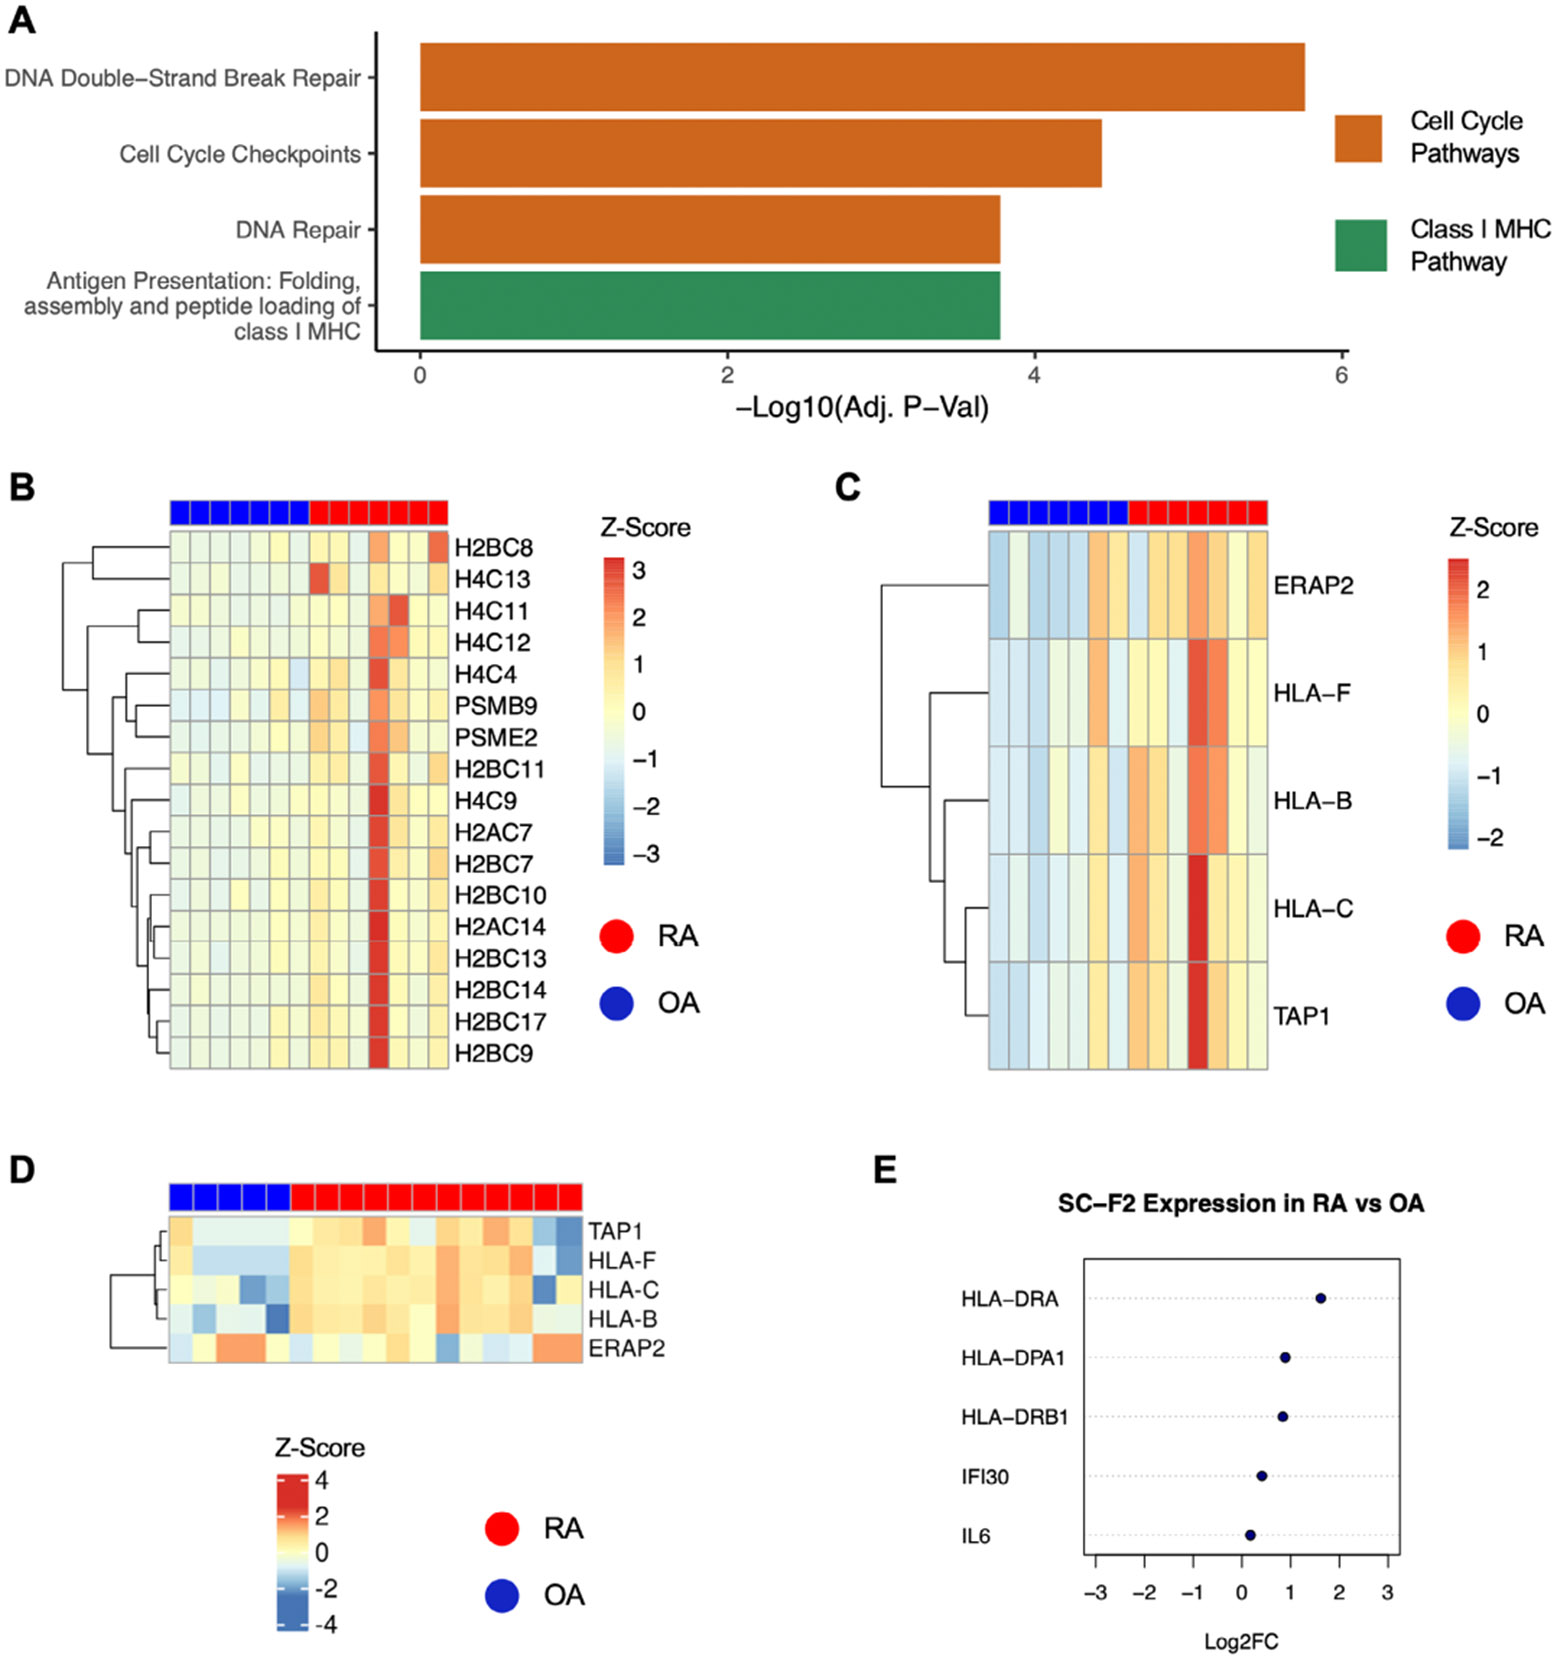
Results: RA and OA transcriptomes were distinguishable by principal component analysis. Pairwise comparisons of synovial lining, sublining, and vessel samples between RA and OA revealed substantial differences in transcriptional patterns throughout the synovium. Hierarchical clustering of pathways based on significance revealed a pattern of association between biologic function and synovial topology. Analysis of pathways uniquely enriched in each region revealed distinct phenotypic abnormalities. As examples, RA lining samples were marked by anomalous immune cell signaling, RA sublining samples were marked by aberrant cell cycle, and RA vessel samples were marked by alterations in heme scavenging.
Conclusion: LCM-RNAseq confirms reported transcriptional differences between the RA synovium and the OA synovium and provides evidence supporting a relationship between synovial topology and molecular anomalies in RA.
© 2024 American College of Rheumatology.
Figures
Similar articles
-
Gene expression analysis of rheumatoid arthritis synovial lining regions by cDNA microarray combined with laser microdissection: up-regulation of inflammation-associated STAT1, IRF1, CXCL9, CXCL10, and CCL5.Scand J Rheumatol. 2012 May;41(3):170-9. doi: 10.3109/03009742.2011.623137. Epub 2012 Mar 9. Scand J Rheumatol. 2012. PMID: 22401175 Free PMC article.
-
Kinesin-like protein CENP-E is upregulated in rheumatoid synovial fibroblasts.Arthritis Res. 1999;1(1):71-80. doi: 10.1186/ar13. Epub 1999 Oct 26. Arthritis Res. 1999. PMID: 11056662 Free PMC article.
-
Chronically inflamed synovium from spondyloarthropathy and rheumatoid arthritis investigated by protein expression profiling followed by tandem mass spectrometry.Proteomics. 2005 May;5(8):2247-57. doi: 10.1002/pmic.200401109. Proteomics. 2005. PMID: 15846842
-
Emerging influence of RNA post-transcriptional modifications in the synovial homeostasis of rheumatoid arthritis.Front Immunol. 2024 Dec 9;15:1494873. doi: 10.3389/fimmu.2024.1494873. eCollection 2024. Front Immunol. 2024. PMID: 39717780 Free PMC article. Review.
-
Synovial Tissue Insights into Heterogeneity of Rheumatoid Arthritis.Curr Rheumatol Rep. 2024 Mar;26(3):81-88. doi: 10.1007/s11926-023-01129-2. Epub 2023 Dec 29. Curr Rheumatol Rep. 2024. PMID: 38157158 Free PMC article. Review.
References
-
- Alivernini S, Firestein GS, McInnes IB. The pathogenesis of rheumatoid arthritis. Immunity 2022;55(12):2255–2270. - PubMed
-
- Greenberg JD, Reed G, Decktor D, et al.; CORRONA Investigators. A comparative effectiveness study of adalimumab, etanercept and infliximab in biologically naive and switched rheumatoid arthritis patients: results from the US CORRONA registry. Ann Rheum Dis 2012;71(7):1134–1142. - PubMed
-
- Orr C, Vieira-Sousa E, Boyle DL, et al. Synovial tissue research: a state-of-the-art review. Nat Rev Rheumatol 2017;13(10):630. - PubMed
-
- Gravallese EM, Firestein GS. Rheumatoid arthritis - common origins, divergent mechanisms. N Engl J Med 2023;388(6):529–542. - PubMed
MeSH terms
Grants and funding
LinkOut - more resources
Full Text Sources
Medical
Research Materials
