. 2024 Apr 10;146(14):9665-9678.
doi: 10.1021/jacs.3c13288. Epub 2024 Apr 1.

Electrocatalytic Nitrate and Nitrite Reduction toward Ammonia Using Cu2O Nanocubes: Active Species and Reaction Mechanisms

Affiliations

Electrocatalytic Nitrate and Nitrite Reduction toward Ammonia Using Cu2O Nanocubes: Active Species and Reaction Mechanisms

Lichen Bai et al. J Am Chem Soc. .

Abstract

The electrochemical reduction of nitrate (NO3-) and nitrite (NO2-) enables sustainable, carbon-neutral, and decentralized routes to produce ammonia (NH3). Copper-based materials are promising electrocatalysts for NOx- conversion to NH3. However, the underlying reaction mechanisms and the role of different Cu species during the catalytic process are still poorly understood. Herein, by combining quasi in situ X-ray photoelectron spectroscopy (XPS) and operando X-ray absorption spectroscopy (XAS), we unveiled that Cu is mostly in metallic form during the highly selective reduction of NO3-/NO2- to NH3. On the contrary, Cu(I) species are predominant in a potential region where the two-electron reduction of NO3- to NO2- is the major reaction. Electrokinetic analysis and in situ Raman spectroscopy was also used to propose possible steps and intermediates leading to NO2- and NH3, respectively. This work establishes a correlation between the catalytic performance and the dynamic changes of the chemical state of Cu, and provides crucial mechanistic insights into the pathways for NO3-/NO2- electrocatalytic reduction.


Conflict of interest statement

The authors declare no competing financial interest.

Figures

Figure 1
Figure 1
Characterization and electrocatalytic NO3RR and NO2RR performances of Cu2O NCs. (a) TEM image of the as prepared Cu2O NCs. (b) Linear scan voltammograms (LSV) of Cu2O NCs without adding NO3/NO2 sources (black) and in the presence of NaNO3 (red) and NaNO2 (blue), respectively, using a scan rate of 50 mV/s. (c,d) Potential-dependent FEs for NH3/NO2 production during 2 h chronoamperometric NO3RR (c) and NO2RR (d). The error bars represent the standard deviation from three independent experiments. Experimental conditions: 0.1 M Na2SO4 electrolyte (pH 12) + 8 mM NaNO3 or NaNO2.
Figure 2
Figure 2
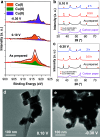
Quasi in situ and postreaction ex situ characterization of Cu2O NCs after NO3RR. (a) Quasi in situ XPS Cu LMM AES of Cu2O NCs after NO3RR (1 h) at different potentials. (b,c) Ex situ GI-PXRD of Cu2O NCs before and after NO3RR at 0.10 VRHE (b) and −0.30 VRHE (c). TEM of Cu2O NCs after NO3RR at 0.10 VRHE (d) and −0.30 VRHE (e). Electrolyte: 0.1 M NaSO4 + 8 mM NaNO3, pH 12.
Figure 3
Figure 3
Operando XAS data for Cu2O NCs during NO3RR. (a) Normalized Cu K-edge XANES spectra collected at OCP, 0.10 VRHE and −0.30 VRHE. (b) Linear combination analysis (LCA) results of the XANES spectra, showing the variation of the Cu oxidation state. The full squares indicate the time-dependent FE(NO2) (red) and FE(NH3) (blue) obtained by NO3RR electrolysis experiments. The first data point is measured at 0.10 VRHE for 2 h, while the other data points are measured at −0.30 VRHE with the corresponding reaction times. The error bars are calculated based on three independent experiments. (c) Fourier-transformed (FT) Cu K-edge EXAFS spectra of Cu2O NCs at OCP, 0.10 VRHE, and −0.30 VRHE. (d) EXAFS fitting results showing the evolution of Cu–Cu and Cu–O coordination numbers. The error bars indicate the fitting uncertainty. Electrolyte: pH 12, 0.1 M Na2SO4 + 8 mM NaNO3.
Figure 4
Figure 4
Electrokinetic analysis of NO3RR and NO2RR in alkaline conditions. (a) Tafel plots of Cu2O NCs at different pH (11.5–12.9) derived from staircase voltammetry. Electrolyte: 0.1 M Na2SO4 with 8 mM NaNO3 at different pH values. (b) Scan rate-dependent CVs of Cu2O NCs at pH 12.0. Typical reductive peaks are labeled. (c) Rotating rate dependent LSVs of Cu2O NCs on rotating disk electrodes at pH 12.0. (d) Tafel plots of Cu2O NCs at different pH (11.5–12.9) derived from staircase voltammetry. Electrolyte: 0.1 M Na2SO4 with 8 mM NaNO2 with different pH values.
Figure 5
Figure 5
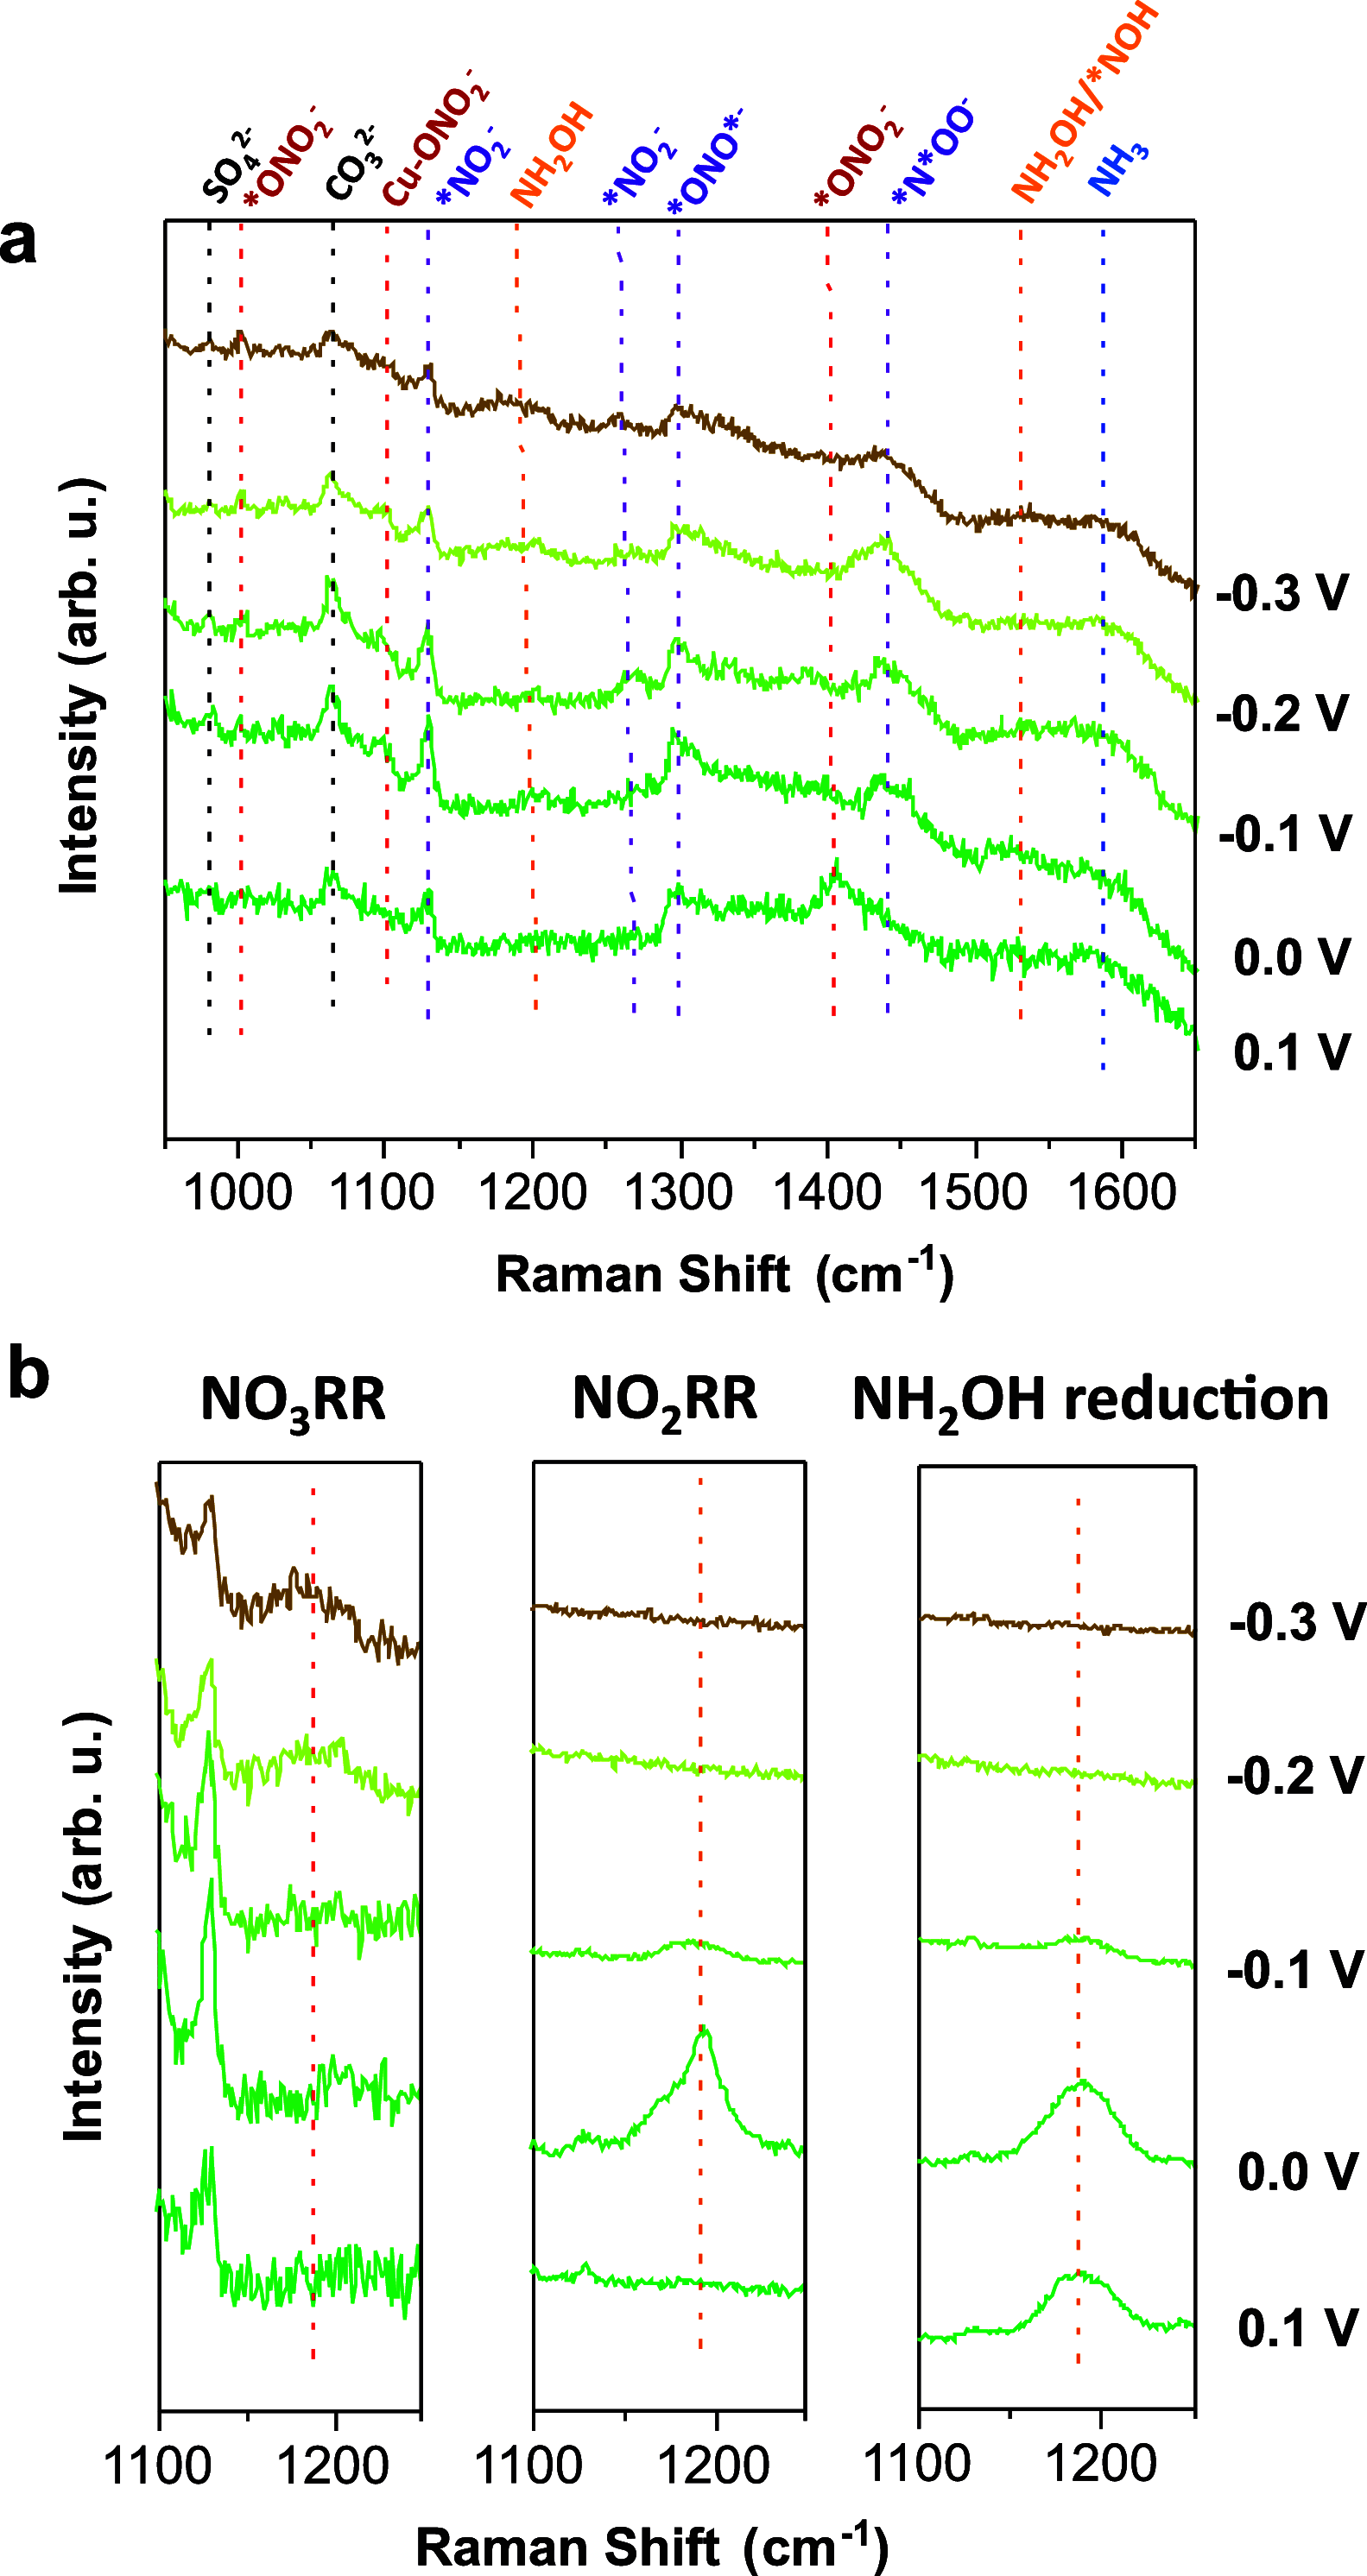
In situ Raman spectroscopy data of Cu2O NCs. (a) Enlarged in situ Raman spectra during NO3RR in the range of 950–1650 cm–1 Raman shift, with the applied potentials ranging from the 0.1 to −0.3 VRHE. Full spectra are shown in Figure S49a, Supporting Information. Electrolyte: pH 12, 0.1 M Na2SO4 + 8 mM NaNO3. The NO3, NO2, NH2OH and NH3 related peaks are labeled with red, violet, orange, and blue dotted lines, respectively. The asterisk denoted the atoms adsorbed on the catalyst surface. Peaks at 983 and 1065 cm–1 correspond to SO42– and CO32– in solution (labeled with a black dotted line),, respectively, as they always appeared in the electrolyte containing Na2SO4 (pH 12). (b) In situ Raman spectra in the range of 1100–1250 cm–1 during NO3RR (left, pH 12, 0.1 M Na2SO4 + 8 mM NaNO3), NO2RR (middle, pH 12, 0.1 M Na2SO4 + 8 mM NaNO2), NH2OH reduction (right, pH 12, 0.1 M Na2SO4 + 8 mM NH2OH). The NH2OH related peaks are labeled with orange dashed lines. The intensity of NO3RR Raman spectra is manually increased five times for clarity.
Figure 6
Figure 6
Active species and possible reaction mechanisms. (a) Schematics of the structural and oxidation state change of the catalyst under NO3RR/NO2RR conditions. (b) Proposed mechanisms for NO3RR/NO2RR to ammonia over Cu2O NCs. The species that been determined based on experimental evidence (either detected by in situ Raman or deduced from electrokinetic analysis) are in bold. The left side (yellow background) correspond to reaction conditions where Cu(I)/Cu(0) species are present, while on the right-hand side (red background) the catalyst is mostly metallic.

References

    1. Qing G.; Ghazfar R.; Jackowski S. T.; Habibzadeh F.; Ashtiani M. M.; Chen C. P.; Smith M. R.; Hamann T. W. Recent Advances and Challenges of Electrocatalytic N2 Reduction to Ammonia. Chem. Rev. 2020, 120 (12), 5437–5516. 10.1021/acs.chemrev.9b00659. - DOI - PubMed
    1. Wang M.; Khan M. A.; Mohsin I.; Wicks J.; Ip A. H.; Sumon K. Z.; Dinh C.-T.; Sargent E. H.; Gates I. D.; Kibria M. G. Can sustainable ammonia synthesis pathways compete with fossil-fuel based Haber-Bosch processes?. Energy Environ. Sci. 2021, 14 (5), 2535–2548. 10.1039/D0EE03808C. - DOI
    1. Wang J.; Feng T.; Chen J.; Ramalingam V.; Li Z.; Kabtamu D. M.; He J.-H.; Fang X. Electrocatalytic nitrate/nitrite reduction to ammonia synthesis using metal nanocatalysts and bio-inspired metalloenzymes. Nano Energy 2021, 86, 106088.10.1016/j.nanoen.2021.106088. - DOI
    1. Elishav O.; Mosevitzky Lis B.; Miller E. M.; Arent D. J.; Valera-Medina A.; Grinberg Dana A.; Shter G. E.; Grader G. S. Progress and Prospective of Nitrogen-Based Alternative Fuels. Chem. Rev. 2020, 120 (12), 5352–5436. 10.1021/acs.chemrev.9b00538. - DOI - PubMed
    1. Wu S.; Salmon N.; Li M. M.-J.; Bañares-Alcántara R.; Tsang S. C. E. Energy Decarbonization via Green H2 or NH3?. ACS Energy Lett. 2022, 7 (3), 1021–1033. 10.1021/acsenergylett.1c02816. - DOI