. 2024 Jul 9;150(2):132-150.
doi: 10.1161/CIRCULATIONAHA.123.066430. Epub 2024 Apr 1.

BRCC3 Regulation of ALK2 in Vascular Smooth Muscle Cells: Implication in Pulmonary Hypertension

Affiliations

BRCC3 Regulation of ALK2 in Vascular Smooth Muscle Cells: Implication in Pulmonary Hypertension

Hui Shen et al. Circulation. .

Abstract

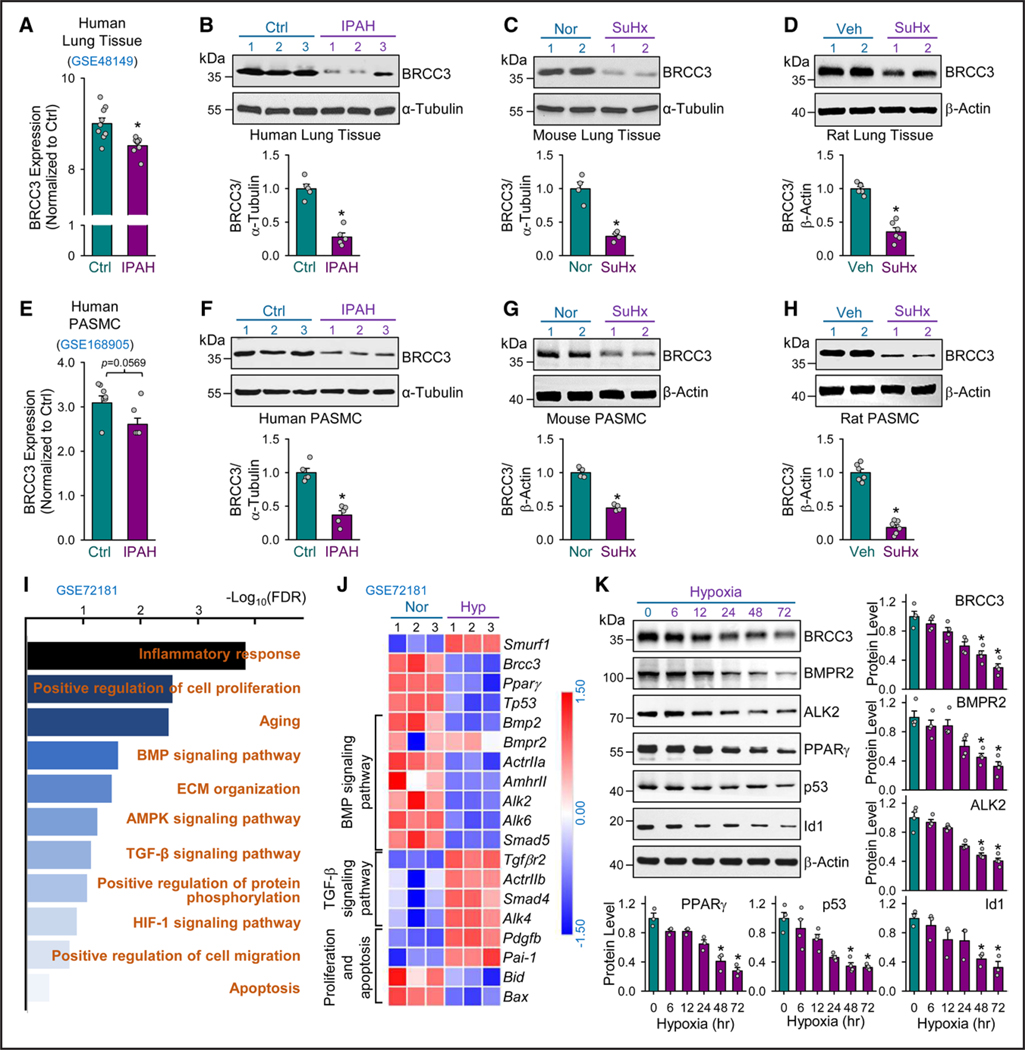
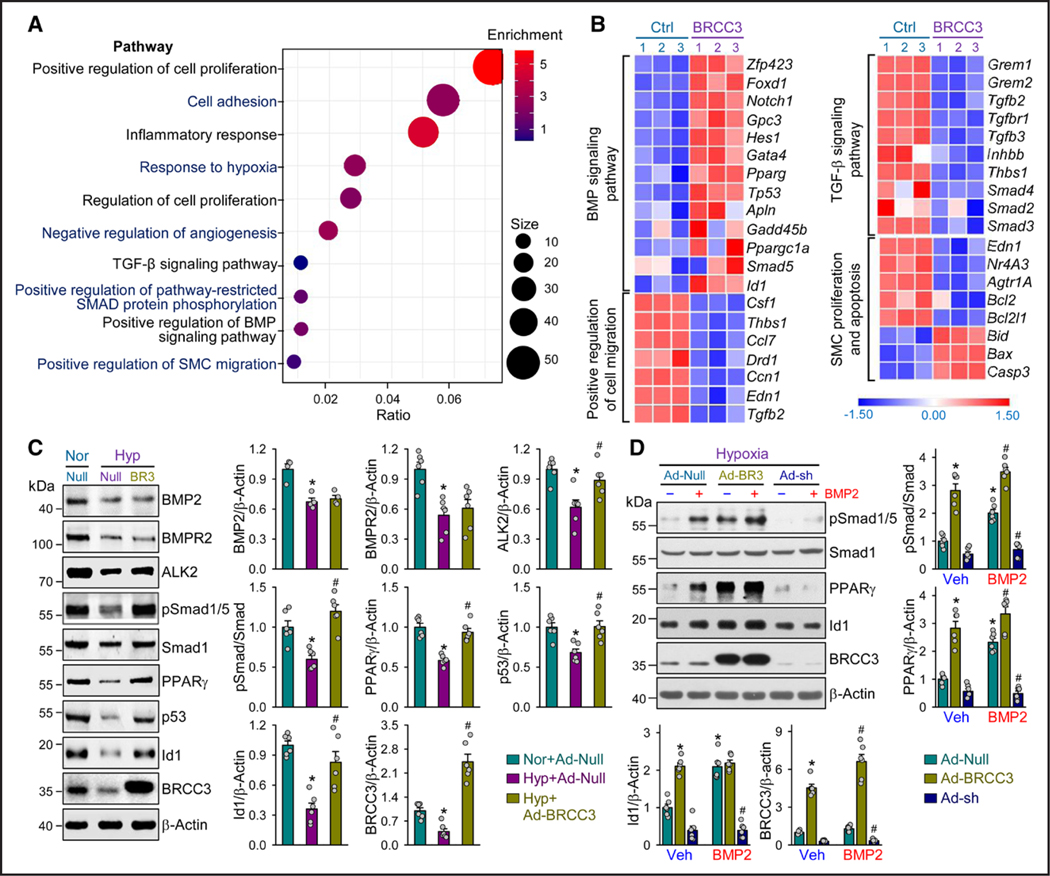
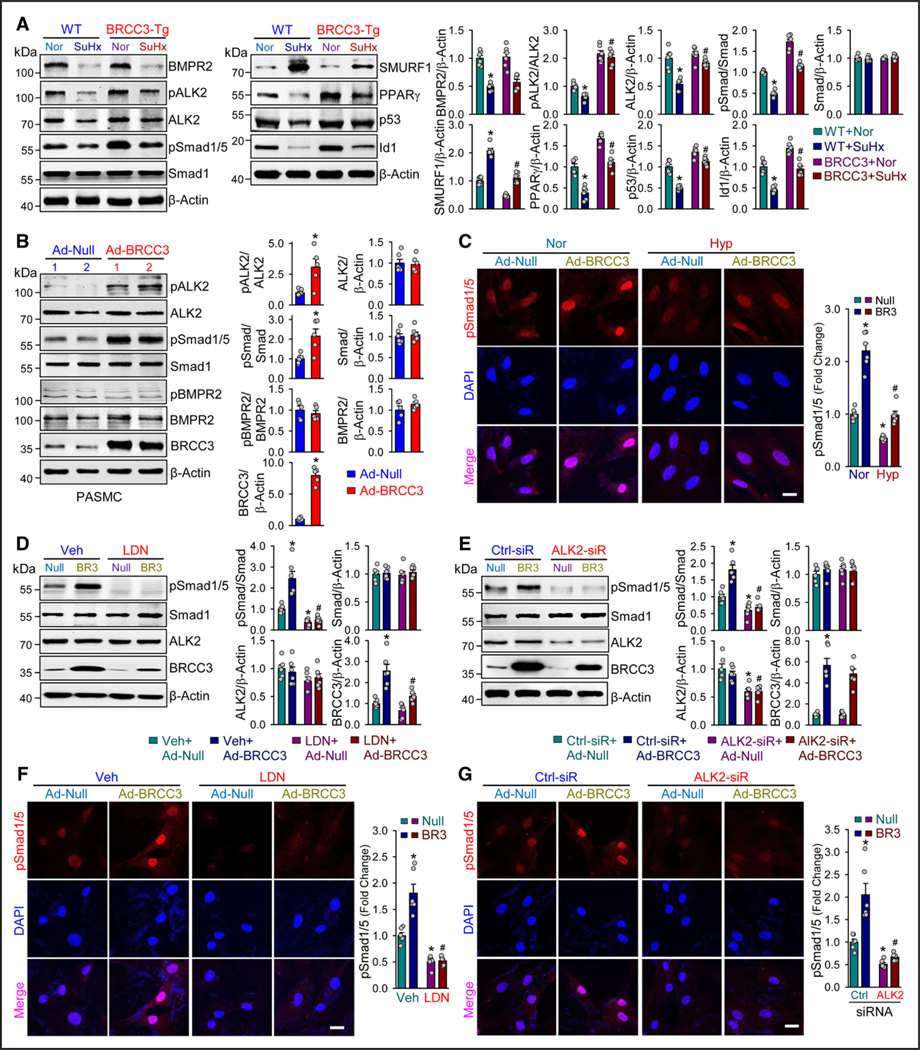
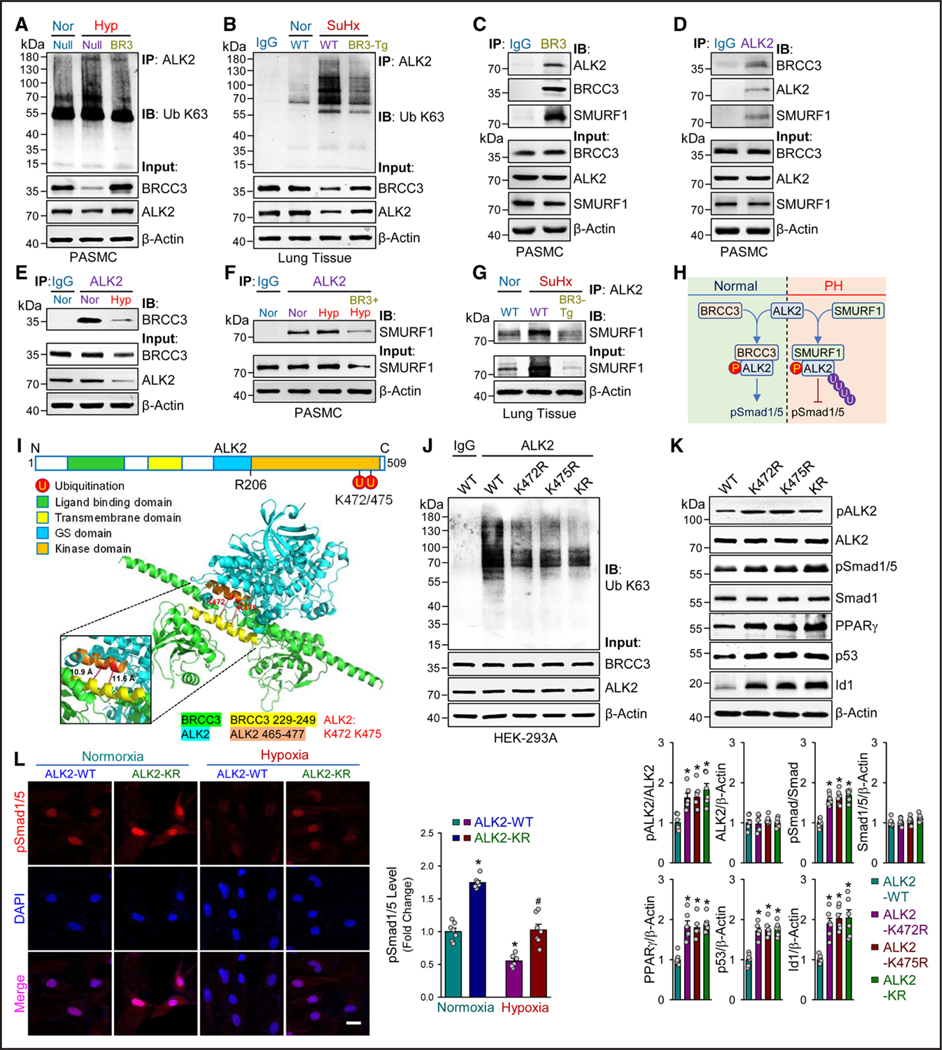
Background: An imbalance of antiproliferative BMP (bone morphogenetic protein) signaling and proliferative TGF-β (transforming growth factor-β) signaling is implicated in the development of pulmonary arterial hypertension (PAH). The posttranslational modification (eg, phosphorylation and ubiquitination) of TGF-β family receptors, including BMPR2 (bone morphogenetic protein type 2 receptor)/ALK2 (activin receptor-like kinase-2) and TGF-βR2/R1, and receptor-regulated Smads significantly affects their activity and thus regulates the target cell fate. BRCC3 modifies the activity and stability of its substrate proteins through K63-dependent deubiquitination. By modulating the posttranslational modifications of the BMP/TGF-β-PPARγ pathway, BRCC3 may play a role in pulmonary vascular remodeling, hence the pathogenesis of PAH.

Methods: Bioinformatic analyses were used to explore the mechanism by which BRCC3 deubiquitinates ALK2. Cultured pulmonary artery smooth muscle cells (PASMCs), mouse models, and specimens from patients with idiopathic PAH were used to investigate the rebalance between BMP and TGF-β signaling in regulating ALK2 phosphorylation and ubiquitination in the context of pulmonary hypertension.

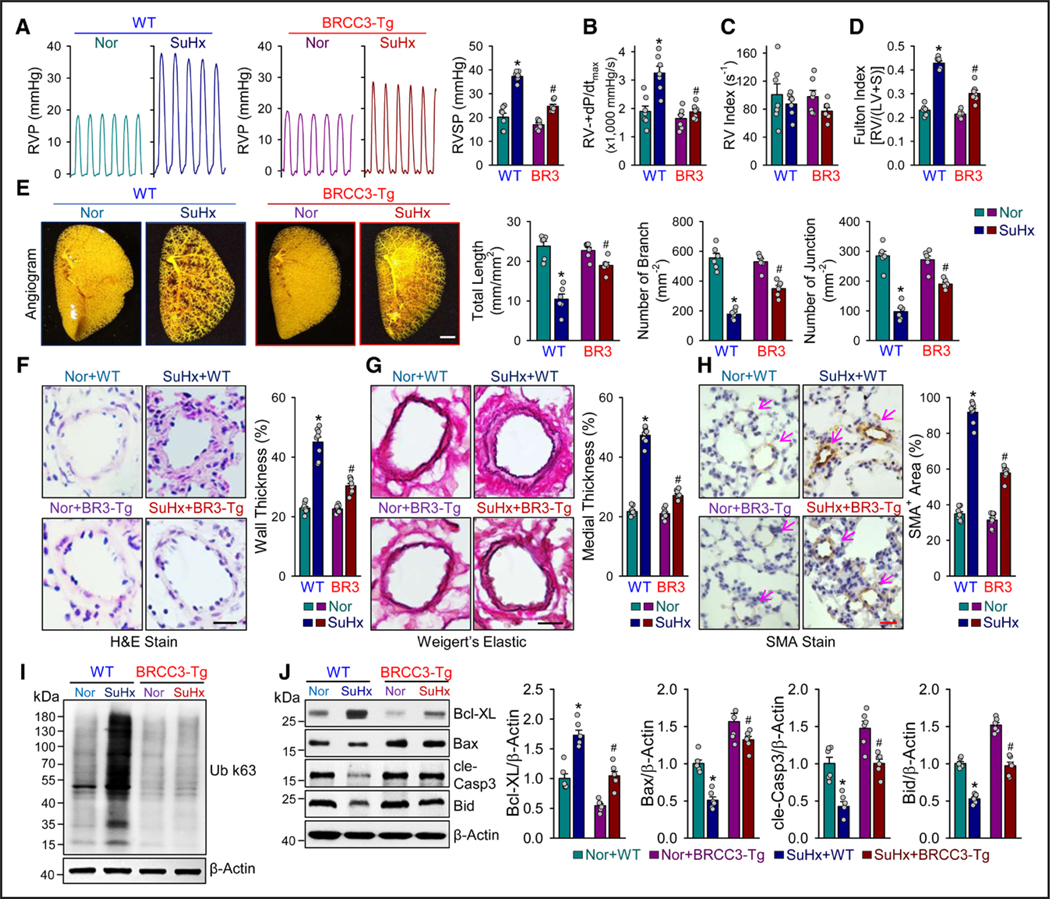
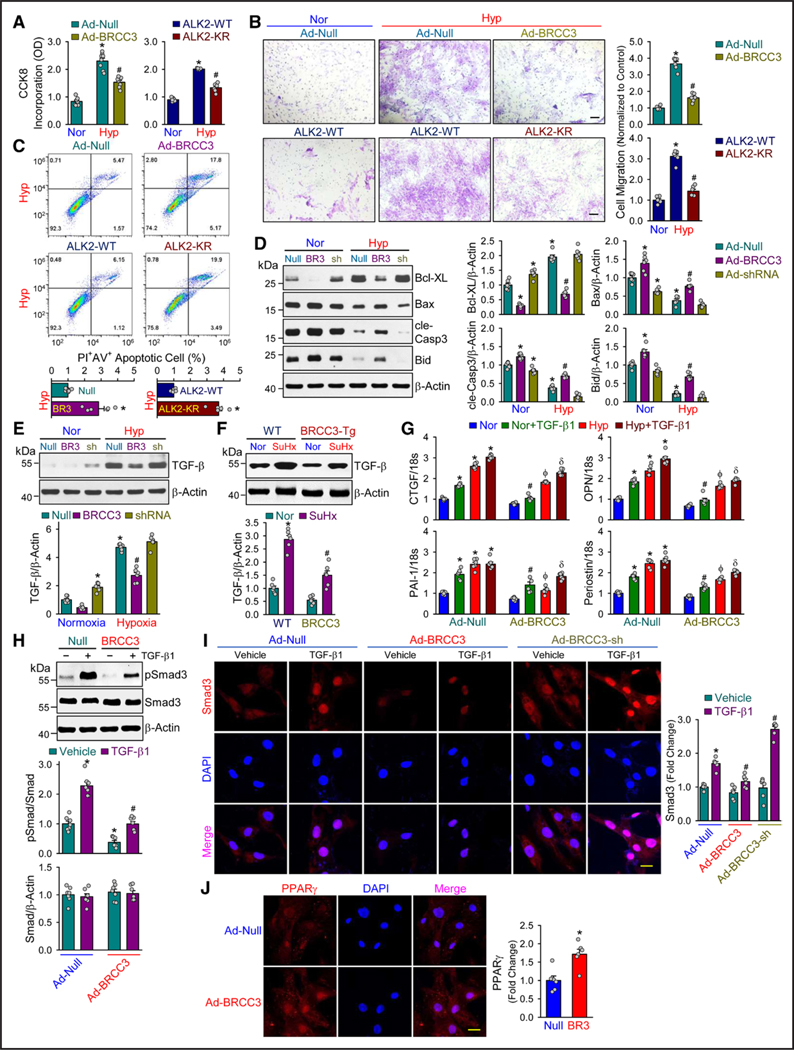
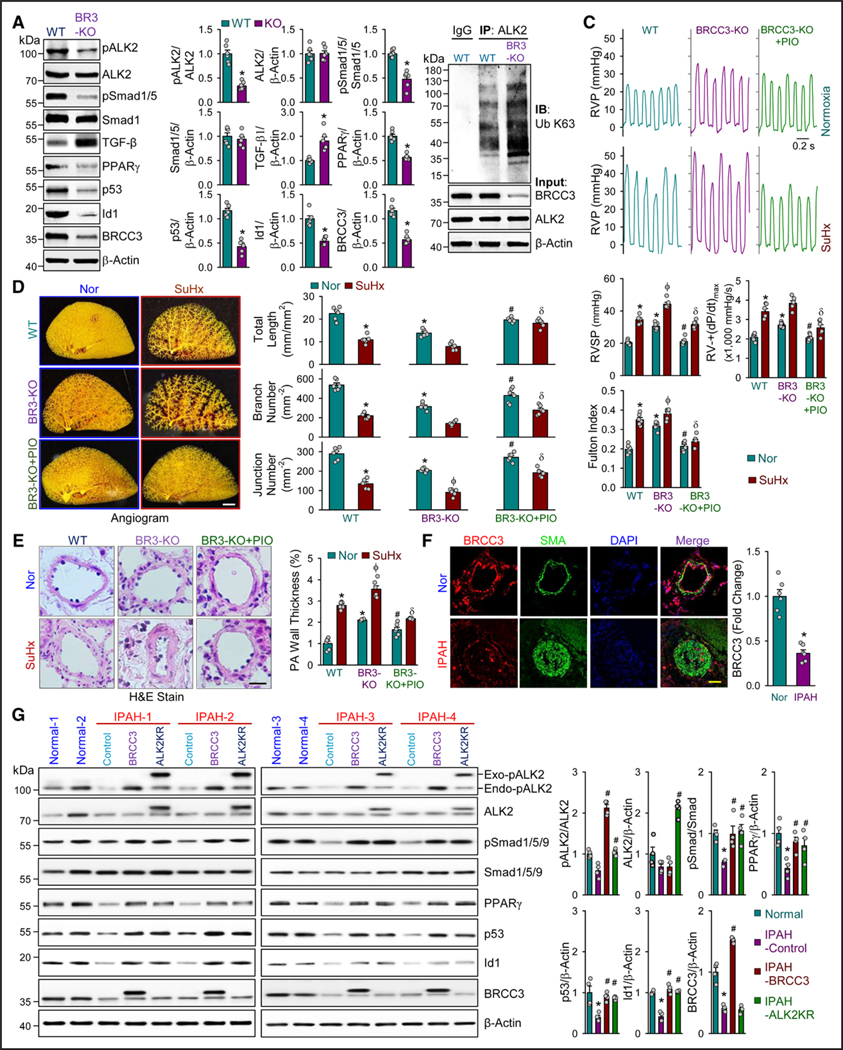
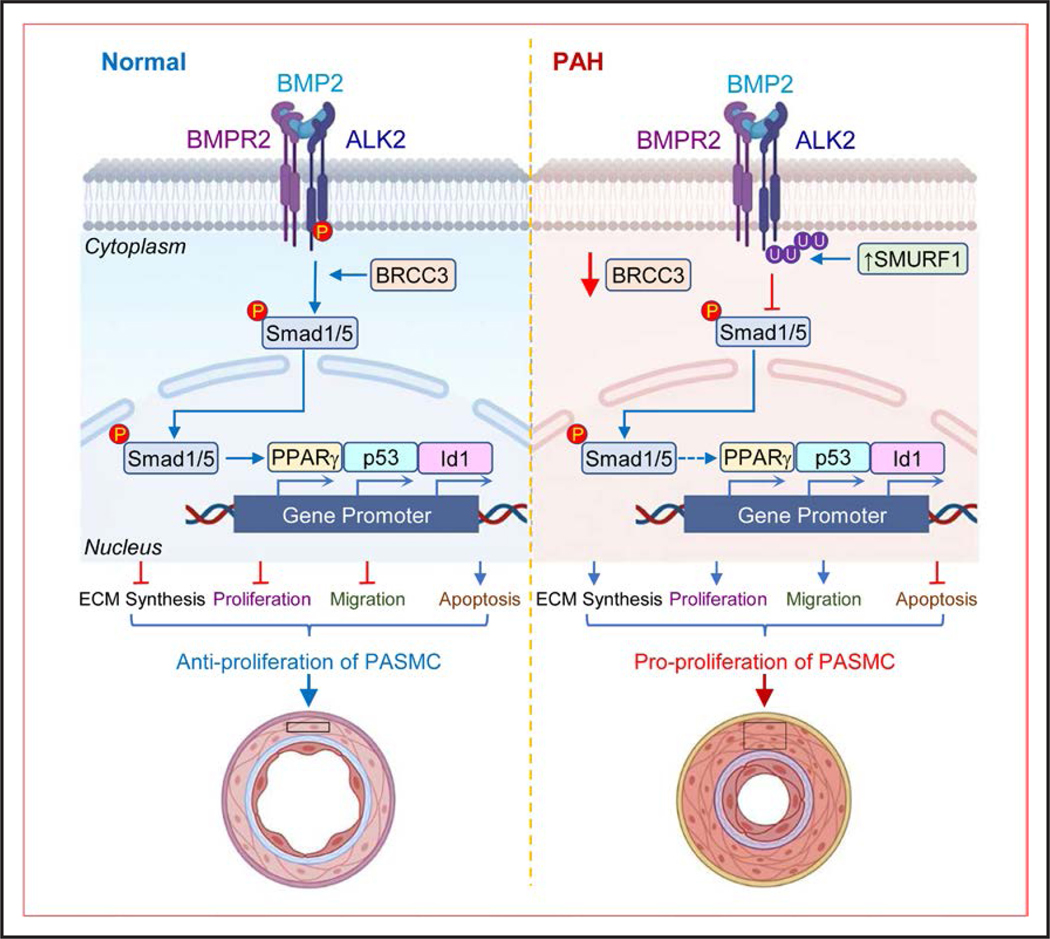
Results: BRCC3 was significantly downregulated in PASMCs from patients with PAH and animals with experimental pulmonary hypertension. BRCC3, by de-ubiquitinating ALK2 at Lys-472 and Lys-475, activated receptor-regulated Smad1/5/9, which resulted in transcriptional activation of BMP-regulated PPARγ, p53, and Id1. Overexpression of BRCC3 also attenuated TGF-β signaling by downregulating TGF-β expression and inhibiting phosphorylation of Smad3. Experiments in vitro indicated that overexpression of BRCC3 or the de-ubiquitin-mimetic ALK2-K472/475R attenuated PASMC proliferation and migration and enhanced PASMC apoptosis. In SM22α-BRCC3-Tg mice, pulmonary hypertension was ameliorated because of activation of the ALK2-Smad1/5-PPARγ axis in PASMCs. In contrast, Brcc3-/- mice showed increased susceptibility of experimental pulmonary hypertension because of inhibition of the ALK2-Smad1/5 signaling.

Conclusions: These results suggest a pivotal role of BRCC3 in sustaining pulmonary vascular homeostasis by maintaining the integrity of the BMP signaling (ie, the ALK2-Smad1/5-PPARγ axis) while suppressing TGF-β signaling in PASMCs. Such rebalance of BMP/TGF-β pathways is translationally important for PAH alleviation.

Keywords: BRCC3 protein; activin receptor-like kinase-2; bone morphogenetic protein; pulmonary arterial hypertension.


Conflict of interest statement

None.

Figures

Figure 1.
Figure 1.. BRCC3 is decreased in human and rodent PH.
A, Bioinformatics analysis of GEO RNA-seq data (GES48149) for BRCC3 levels in human lung tissues from patients with idiopathic pulmonary artery hypertension (IPAH; n=8) and controls without IPAH (n=9). Western blot analysis of BRCC3 levels in lung tissues from patients with IPAH and nondiseased tissues (B); mouse models with experimental PH induced by 10% O2 with subcutaneous injection of SU5416 (SuHx) and control mice under normoxia (C); and rat models with SuHx-induced PH vs controls (D). E, Analysis of GEO RNA-seq data (GES168905) for BRCC3 expression level in human pulmonary arterial smooth muscle cells (PASMCs) from patients with or without IPAH. Western blot analysis of BRCC3 levels in lung PASMCs isolated from IPAH and control individuals (F); SuHx-induced PH mice and control mice (G); and SuHx-induced PH rat models and control rats (H). I, Gene Ontology (GO) enrichment analysis of GSE72181 using DAVID for the top upregulated and downregulated pathways (fold change in expression >1.5 or < −1.5; P<0.05) in PASMCs under normoxia vs hypoxia and plotted as –log(P value) [–Log10(P)]. J, Heatmap generated from GSE72181 revealing differentially expressed genes involved in the BMP pathway (18 differentially expressed genes), TGF-β pathway (16 differentially expressed genes), proliferation (25 differentially expressed genes), and apoptosis (16 differentially expressed genes) in PASMCs under normoxia or hypoxia. K, PASMCs cultured under hypoxia for 6, 12, 24, 48, or 72 hours. Western blot analysis of protein levels of BRCC3, BMPR2, ALK2, PPARγ, p53, and Id1 with those of β-actin as loading controls. Data in A through H and K are mean±SEM from 3 to 9 independent experiments. For data with normal distribution (A, D, and H), statistical significance was determined by 2-tailed Student t test with Welch correction between 2 indicated groups. Nonnormally distributed data in B, C, and E through G were analyzed by Mann-Whitney U test between 2 indicated groups. Nonnormally distributed data in K were analyzed by the Kruskal-Wallis test between multiple groups. *P<0.05 vs control patients (Ctrl) or normoxia (Nor) or vehicle (Veh) or 0 hour. ALK2 indicates activin receptor-like kinase-2; BMP, bone morphogenetic protein; BMPR2, bone morphogenetic protein type 2 receptor; BRCC3, BRCA1/BRCA2-containing complex subunit 3; GEO, Gene Expression Omnibus; PH, pulmonary hypertension; RNA-seq, RNA sequencing; and TGF-β, transforming growth factor-β.
Figure 2.
Figure 2.. BRCC3 overexpression ameliorates the BMP pathway in PASMCs.
A and B, RNAs extracted from PASMCs transfected with Ad-Null or Ad-BRCC3 (n=3, each condition) were subjected to RNA-seq analyses. A, GO enrichment analysis using DAVID for the top upregulated and downregulated genes (fold change in expression >1.5 or < –1.5; P<0.05) in PASMCs transfected with Ad-Null or Ad-BRCC3 and plotted as –log (P value) [–Log10(P)]. B, Heatmaps showing differentially expressed genes involved in BMP (9 differentially expressed genes) and TGF-β signaling pathways (9 differentially expressed genes), positive regulation of cell migration (34 differentially expressed genes), and SMC proliferation and apoptosis (57 differentially expressed genes) in PASMCs transfected with Ad-Null vs Ad-BRCC3. C, PASMCs were transfected with Ad-Null or Ad-BRCC3 for 24 hours, then exposed to hypoxia (1% O2) or normoxia for an additional 48 hours. Western blot analysis of protein levels of BMP2, BMPR2, ALK2, pSmad1/5, Smad1, PPARγ, p53, Id1, BRCC3, and β-actin. D, PASMCs were transfected with Ad-Null, Ad-BRCC3, or Ad-BRCC3 shRNA for 24 hours, then cultured under hypoxia for 48 hours and treated with vehicle or BMP2 (25 ng/mL) for 2 hours before harvesting. Western blot analysis of protein levels of pSmad1/5, Smad1, PPARγ, Id1, BRCC3, and β-actin. Data in C and D are mean±SEM from 4 to 6 independent experiments. Normally or nonnormally distributed data were analyzed by 1-way ANOVA (C) and 2-way ANOVA (D) or the Kruskal-Wallis test between multiple groups. Data in C, *P<0.05 vs Nor+Ad-Null, #P<0.05 vs Hyp+Ad-Null. Data in D, *P<0.05 vs Ad-Null in vehicle (Veh) group; #P<0.05 vs Ad-Null in BMP2 group. ALK2 indicates activin receptor-like kinase-2; BMP, bone morphogenetic protein; BMPR2, bone morphogenetic protein type 2 receptor; BRCC3, BRCA1/BRCA2-containing complex subunit 3; GO, Gene Ontology; PASMC, pulmonary arterial smooth muscle cell; RNA-seq, RNA sequencing; SMC, smooth muscle cell; and TGF-β, transforming growth factor-β.
Figure 3.
Figure 3.. BRCC3 overexpression in PASMCs attenuates experimental PH.
A through E, SM22α-BRCC3-Tg mice and wild-type (WT) littermates were subjected to normoxia, or 10% O2 with subcutaneous injection of SU5416 at 20 mg/kg/week (SuHx) to induce PH. Mice in the WT+Nor, WT+SuHx, BRCC3-Tg+Nor, and BRCC3-Tg+SuHx groups were euthanized. A, Representative records of right ventricular pressure (RVP) and summarized RV systolic pressure (RVSP), summarized values of RV±dp/dtmax (B), RV index (C), Fulton index (ratio of weight of right ventricle [RV] to that of left ventricle [LV] and septum [S] [RV/LV+S]; D), and angiography of pulmonary vasculature (E). Summarized data (mean±SEM; n=6 lungs) showing the total length of branches, number of branches, and number of junctions of the left lungs. Scale bar=50 mm. F, Hematoxylin and eosin (H&E) staining of pulmonary arteries. Scale bar=20 μm. G, Weigert elastic staining revealing the elastic fibers (dark blue) and collagen fibers (red). The area between the 2 layers of elastic fibers is the media layer, whereas the adventitial layer is indicated by the stained collagen fibers in red. Scale bar=20 μm. H, Immunohistochemical staining of SMAα. Summarized data (mean±SEM) showing the pulmonary arterial wall thickness and PASMC hypertrophy. Scale bar=20 μm. I, Western blot analysis of anti-Ub K63 to detect protein ubiquitination (n=3). J, Western blot analysis of Bcl-XL, Bax, cle-Casp3, Bid, and β-actin. Data in A through H and J are mean±SEM (6–8 mice per group). Normally distributed data in A through H and J were analyzed by 2-way ANOVA between multiple groups. *P<0.05 vs WT+Nor; #P<0.05 vs WT+SuHx. BRCC3 indicates BRCA1/BRCA2-containing complex subunit 3; cle-Casp3, cleaved caspase 3; PASMC, pulmonary arterial smooth muscle cell; and PH, pulmonary hypertension.
Figure 4.
Figure 4.. BRCC3 enhances ALK2-Smad1/5 signaling in PASMCs.
A, SM22α-BRCC3-Tg mice and WT littermates were subjected to SuHx to induce PH. The lung tissues were isolated from euthanized mice, and Western blot analysis was performed to detect BMPR2, pALK2, ALK2, pSmad1/5, Smad1, SMURF1, PPARγ, p53, Id1, and β-actin. B through E, PASMCs were transfected with Ad-Null or Ad-BRCC3 for 48 hours. In B, cells were lysed, followed by Western blot analysis to detect pALK2, ALK2, pSmad1/5, Smad1, pBMPR2, BMPR2, BRCC3, and β-actin. In C, transfected PASMCs were exposed to hypoxia (1% O2) or normoxia for an additional 48 hours. The pSmad1/5 nuclear translocation was assessed by immunofluorescence microscopy with an antibody against pSmad1/5 (red); nuclei were counterstained with DAPI. Scale bar=50 μm. In D, cells were treated with or without LDN (10 mmol) for an additional 8 hours. In E, cells were transfected with control siRNA or ALK2 siRNA for 6 hours before Ad-Null or Ad-BRCC3 infection. Cells were lysed, followed by Western blot analysis to detect pSmad1/5, Smad1, ALK2, BRCC3, and β-actin. In F and G, PASMCs were treated with LDN or vehicle or transfected with ALK2 siRNA or control siRNA. Cells were infected with Ad-BRCC3 or Ad-Null, and then pSmad1/5 nuclear translocation was observed by immunofluorescence staining. Scale bar=50 μm. Data in A through G are mean±SEM from 5 or 6 independent experiments. Normally distributed data in A and C through G were analyzed by 2-way ANOVA between multiple groups. Normally and Nonnormally distributed data in B were analyzed by 2-tailed Student t test with Welch correction or the Mann-Whitney U test between 2 indicated groups. *P<0.05 vs WT+Nor (A), Ad-Null (B), Nor+Ad-Null (C), Veh+Ad-Null (D and F), and Ctrl SiR+Ad-Null (E and G). #P<0.05 vs WT+SuHx (A), Hyp+Ad-Null (C), Veh+Ad-BRCC3 (D and F), and Ctrl SiR+Ad-BRCC3 (E and G). ALK2 indicates activin receptor-like kinase-2; BMPR2, bone morphogenetic protein type 2 receptor; BRCC3, BRCA1/BRCA2-containing complex subunit 3; PASMC, pulmonary arterial smooth muscle cell; PH, pulmonary hypertension; SMURF1, Smad ubiquitination regulatory factor 1; SuHx, Sugen5416/hypoxia; and WT, wild-type.
Figure 5.
Figure 5.. BRCC3-ALK2 axis regulates BMP signaling by BRCC3 deubiquitination of ALK2 Lys-472 and Lys-475.
PASMCs transfected with or without Ad-BRCC3 were cultured under normoxia or hypoxia for 48 hours. Cell extracts were immunoprecipitated (IP) with anti-ALK2 and immunoblotted (IB) with anti-Ub K63 in A, anti-BRCC3 in E, and anti-SMURF1 in F. The input controls were immunoblotted with various antibodies as indicated. Cell lysates from cultured PASMCs were immunoprecipitated with anti-BRCC3 in C or anti-ALK2 in D and immunoblotted with anti-ALK2, anti-BRCC3, or anti-SMURF1. The input controls were lysates immunoblotted with anti-BRCC3, anti-ALK2, anti-SMURF1, or anti–β-actin. Lung tissues from WT/Nor, WT/SuHx, and BRCC3-Tg/SuHx groups of mice were immunoprecipitated with anti-ALK2 and immunoblotted with anti-Ub K63 in B and anti-SMURF1 in G. H, Schematic diagram of the competitive binding of BRCC3 and SMURF1 with ALK2. I, Schematic diagram of BRCC3 interaction with ALK2. ALK2 is depicted in blue and BRCC3 in green. The moiety highlighted in red in ALK2 are experimentally verified ubiquitination sites. ALK2 K472 and K475 were predicted to be in the interaction interface, which includes all residue pairs within 5.0 Å between the interacting molecules. J through L, HEK293 cells were transfected with expression plasmid encoding ALK2-WT, ALK2-K472R, ALK2-K475R, or ALK2-K472R/K475R (KR) together with Ub plasmids. Cell extracts were immunoprecipitated with anti-ALK2 and immunoblotted with anti-Ub K63 in J. The input protein was immunoblotted with various as indicated in K. L, PASMCs were transfected with ALK2-WT or ALK2-K472R/K475R plasmids. Nuclear translocation was quantified by immune fluorescence staining with pSmad1/5 (red), and nuclei were counterstained with DAPI (blue). Scale bar=50 μm. Data in A through L are mean±SEM from 3 to 7 independent experiments. Normally distributed data were analyzed by 1-way ANOVA in K and 2-way ANOVA in L between multiple groups. Data in K and L, *P<0.05 vs ALK2-WT or ALK2-WT in normoxia group. #P<0.05 vs ALK2-WT in hypoxia group. ALK2 indicates activin receptor-like kinase-2; BMP, bone morphogenetic protein; BRCC3, BRCA1/BRCA2-containing complex subunit 3; PASMC, pulmonary arterial smooth muscle cell; SMURF1, Smad ubiquitination regulatory factor 1; SuHx, Sugen5416/hypoxia; and WT, wild-type.
Figure 6.
Figure 6.. BRCC3 regulates PASMC phenotype.
A through C, Rat PASMCs were transfected with Ad-Null or Ad-BRCC3 for 48 hours and transfected with plasmid encoding ALK2-WT or ALK2-KR (1 μg/mL), then exposed to normoxia or hypoxia for an additional 48 hours. The harvested cells were subjected to cell counting Kit-8 (CCK-8) assay (A), Trans-well assay (B), and flow cytometry assays. Scale bar=100 μm. (C). D and E, PASMCs were transfected with Ad-Null, Ad-BRCC3, or Ad-BRCC3 shRNA for 24 hours, then cultured under normoxia or hypoxia for 48 hours. Western blot analysis of protein levels of Bcl-XL, Bax, cle-Casp3, Bid, and β-actin (D) and TGF-β (E). F, Lung tissues from WT or BRCC3-Tg mice subjected to normoxia or SuHx were analyzed by Western blot using anti–TGF-β. G through J, PASMCs were transfected with Ad-Null or Ad-BRCC3 for 24 hours, then cultured under normoxia or hypoxia for 48 hours and treated with vehicle or TGF-β (5 ng/mL) for 24 hours before harvesting. G, The CTGF, OPN, PAI-1, and Periostin mRNAs were quantified by quantitative polymerase chain reaction. H, Western blot analysis of pSmad3. I, Immunofluorescence staining analysis of Smad3 nuclear entry. Scale bar=50 μm. J, Immunofluorescence staining of PPARγ nuclear entry. Scale bar=50 μm. Data in A through J are mean±SEM from 6 to 8 independent experiments. Normally distributed data in were analyzed by 1-way ANOVA (A and B) and 2-way ANOVA (D through I) between multiple groups. Normally distributed data in C and J were analyzed by 2-tailed Student t test with Welch correction between 2 indicated groups. Data in A through C, *P<0.05 vs Nor+Ad-Null or Nor+ALK2-WT, #P<0.05 vs Hyp+Ad-Null or Hyp+ALK2-WT. Data in D and E, *P<0.05 vs Nor+Ad-Null, #P<0.05 vs Hyp+Ad-Null. Data in F, *P<0.05 vs WT+Nor, #P<0.05 vs WT+SuHx. Data in G through I, *P<0.05 vs Nor+Ad-Null, #P<0.05 vs Nor+Ad-Null+TGF-β1, ϕP<0.05 vs Hyp+Ad-Null, δP<0.05 vs Hyp+Ad-Null+TGF-β1. BRCC3 indicates BRCA1/BRCA2-containing complex subunit 3; cle-Casp3, cleaved caspase 3; CTGF, connective tissue growth factor; OPN, osteopontin; PAI-1, plasminogen activator inhibitor-1; PASMC, pulmonary arterial smooth muscle cell; SuHx, Sugen5416/hypoxia; TGF-β, transforming growth factor-β; and WT, wild-type.
Figure 7.
Figure 7.. Pioglitazone and ALK2-K472R/K475R mitigate PH.
A, Western blot analysis of pALK2, ALK2, pSmad1/5, Smad1, PPARγ, p53, Id1, and BRCC3 in lung tissue of WT mice and SMC-Brcc3−/− (KO) mice. B, Lung tissues of WT and KO mice were immunoprecipitated with anti-ALK2 or IgG, then immunoblotted with anti-Ub K63. The input protein was immunoblotting with antibodies against BRCC3, ALK2, or β-actin (n=3). C through E, KO mice and WT littermates were subjected to normoxia as controls or SuHx to induce PH. KO mice were treated with pioglitazone (PIO) for 4 weeks (10 mg/kg, daily). Mice in the WT+Nor, BRCC3 KO+Nor, BRCC3 KO+Nor+PIO, WT+SuHx, BRCC3 KO+SuHx, and BRCC3 KO+SuHx+PIO groups were euthanized. C, Representative records of RVP and summarized RVSP, summarized values of RV±dp/dtmax, Fulton index. D, Angiography of the pulmonary vasculature. Summarized data (mean±SEM, n=6 lungs) on the right showing the total length of branches, number of branches, and number of junctions of the left lungs. Scale bar=50 mm. E, Hematoxylin and eosin (H&E) staining of pulmonary arteries. Scale bar=20 μm. F, Representative immunofluorescent staining of of BRCC3 (red), SMAα (green), DAPI (blue), and merge images in distal pulmonary arteries from IPAH and nondiseased individuals. Scale bar=50 μm (n=6). G, Western blot analysis of pALK2, ALK2, pSmad1/5/9, Smad1/5/9, PPARγ, p53, Id1, BRCC3, and β-actin in PASMCs from patients with IPAH vs nondiseased individuals (n=4). Normally distributed data in A and C through F are mean±SEM from 6 independent experiments and analyzed by 2-tailed Student t test with Welch correction (A and F) and 2-way ANOVA between multiple groups (C through E). Nonnormally distributed data in G were analyzed by the Kruskal-Wallis test between multiple groups (n=4). Data in A, *P<0.05 vs WT. Data in C through E, *P<0.05 vs WT in normoxia (Nor) group; #P<0.05 vs BRCC3-KO in normoxia group; ϕP<0.05 vs WT in SuHx group; δP<0.05 vs BRCC3-KO in SuHx group. Data in F and G, *P<0.05 vs Nor; #P<0.05 vs IPAH control. ALK2 indicates activin receptor-like kinase-2; BRCC3, BRCA1/BRCA2-containing complex subunit 3; IPAH, idiopathic pulmonary arterial hypertension; PASMC, pulmonary arterial smooth muscle cell; PH, pulmonary hypertension; SMC, smooth muscle cell; SuHx, Sugen5416/hypoxia; and WT, wild-type.
Figure 8.
Figure 8.. Schematic illustration of the protective role of BRCC3 in PH alleviation.
Under normal conditions, BRCC3 preserves the deubiquitination of ALK2, thus sustaining the phosphorylation of Smad1/5 and its nuclear entry to maintain the integrity of BMP pathway, which contributes to the contractile phenotype of PASMCs. Upon the onset of PAH, reduction of BRCC3 and increase in SMURF1 mediates the K63-linked ubiqutination of ALK2, leading to decreased ALK2 activity and phosphorylation and nuclear entry of Smad1/5, which promotes the proliferative phenotype of PASMCs. Pharmacological or genetic rectification of the BRCC3-ALK2 axis to rebalance BMP/TGF-β pathways may ameliorate PH in rodents and humans. ALK2 indicates activin receptor-like kinase-2; BMP, bone morphogenetic protein; BRCC3, BRCA1/BRCA2-containing complex subunit 3; PAH, pulmonary arterial hypertension; PASMC, pulmonary arterial smooth muscle cell; PH, pulmonary hypertension; SMURF1, Smad ubiquitination regulatory factor 1; and TGF-β, transforming growth factor-β.

Similar articles

Cited by

References

    1. Humbert M, Kovacs G, Hoeper MM, Badagliacca R, Berger R, Brida M, Carlsen J, Coats A, Escribano-Subias P, Ferrari P, et al. 2022 ESC/ERS guidelines for the diagnosis and treatment of pulmonary hypertension. Eur Respir J. 2023;61:2200879. doi: 10.1183/13993003.00879-2022 - DOI - PubMed
    1. Morrell NW, Aldred MA, Chung WK, Elliott CG, Nichols WC, Soubrier F, Trembath RC, Loyd JE. Genetics and genomics of pulmonary arterial hypertension. Eur Respir J. 2019;53:1801899. doi: 10.1183/13993003.01899-2018 - DOI - PMC - PubMed
    1. Rabinovitch M. Molecular pathogenesis of pulmonary arterial hypertension. J Clin Invest. 2012;122:4306–4313. doi: 10.1172/JCI60658 - DOI - PMC - PubMed
    1. Lane KB, Machado RD, Pauciulo MW, Thomson JR, Phillips JA III, Loyd JE, Nichols WC, Trembath RC; International PPH Consortium. Heterozygous germline mutations in BMPR2, encoding a TGF-beta receptor, cause familial primary pulmonary hypertension. Nat Genet. 2000;26:81–84. doi: 10.1038/79226 - DOI - PubMed
    1. Atkinson C, Stewart S, Upton PD, Machado R, Thomson JR, Trembath RC, Morrell NW. Primary pulmonary hypertension is associated with reduced pulmonary vascular expression of type II bone morphogenetic protein receptor. Circulation. 2002;105:1672–1678. doi: 10.1161/01.cir.0000012754.72951.3d - DOI - PubMed

MeSH terms