. 2024 Jul 2;150(1):30-46.
doi: 10.1161/CIRCULATIONAHA.123.065202. Epub 2024 Apr 1.

LXRα Promotes Abdominal Aortic Aneurysm Formation Through UHRF1 Epigenetic Modification of miR-26b-3p

Affiliations

LXRα Promotes Abdominal Aortic Aneurysm Formation Through UHRF1 Epigenetic Modification of miR-26b-3p

Xiao Guo et al. Circulation. .

Abstract

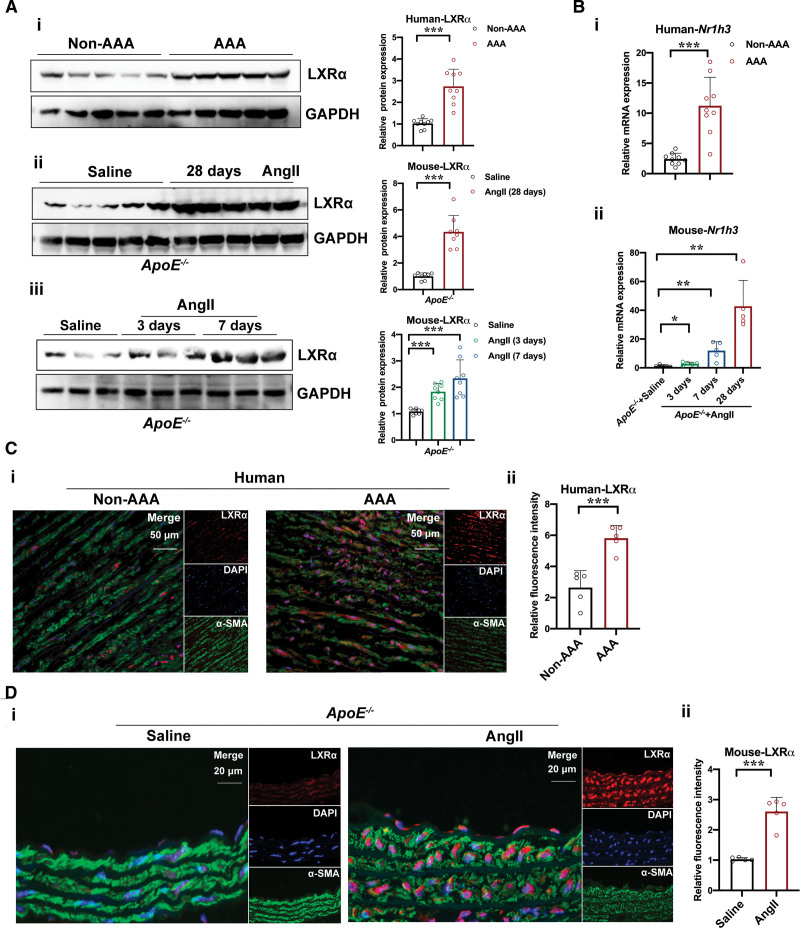
Background: Abdominal aortic aneurysm (AAA) is a severe aortic disease without effective pharmacological approaches. The nuclear hormone receptor LXRα (liver X receptor α), encoded by the NR1H3 gene, serves as a critical transcriptional mediator linked to several vascular pathologies, but its role in AAA remains elusive.

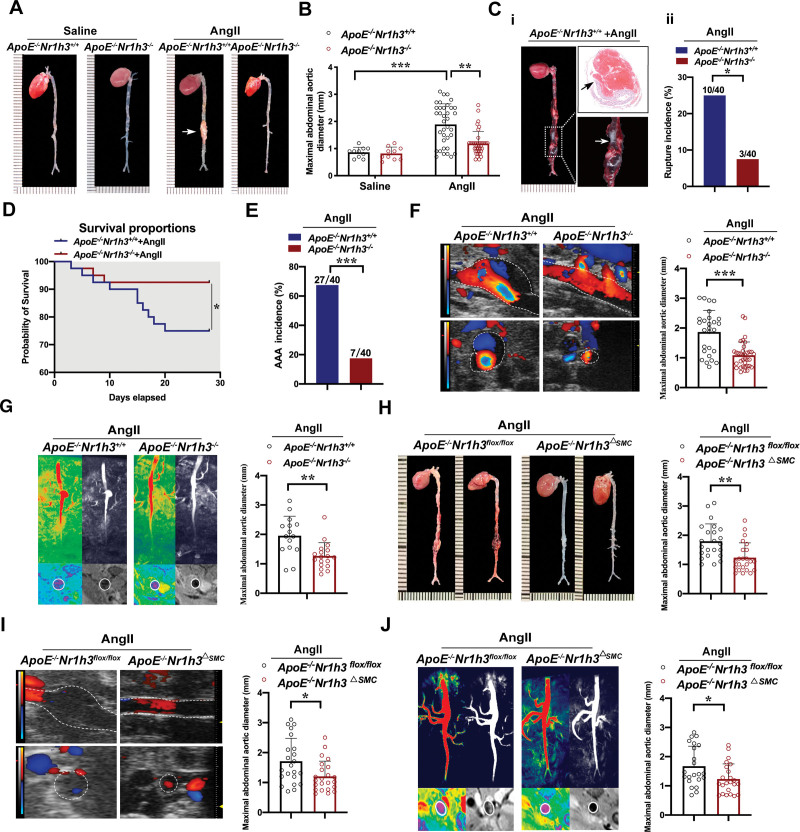
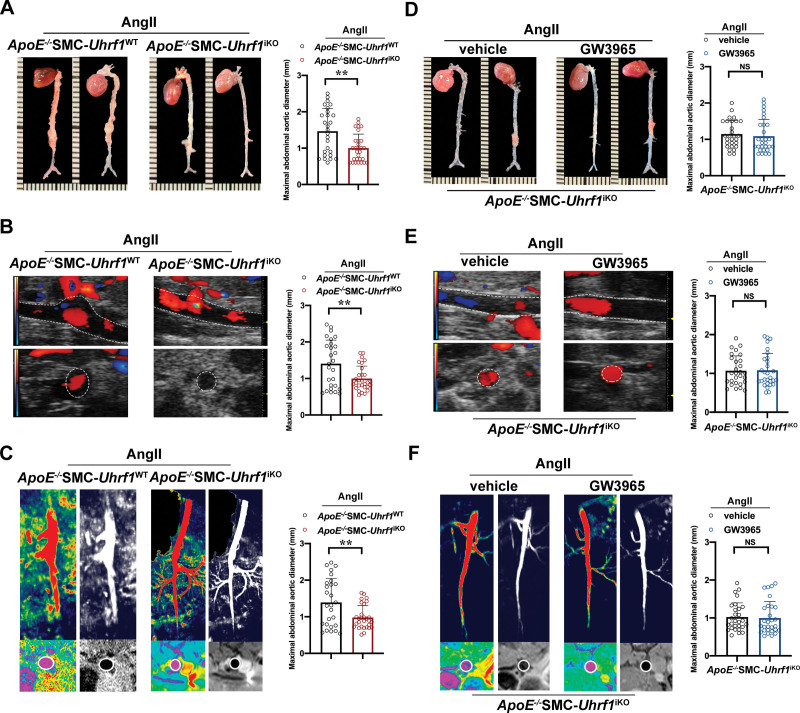
Methods: Through integrated analyses of human and murine AAA gene expression microarray data sets, we identified NR1H3 as a candidate gene regulating AAA formation. To investigate the role of LXRα in AAA formation, we used global Nr1h3-knockout and vascular smooth muscle cell-specific Nr1h3-knockout mice in 2 AAA mouse models induced with angiotensin II (1000 ng·kg·min; 28 days) or calcium chloride (CaCl2; 0.5 mol/L; 42 days).

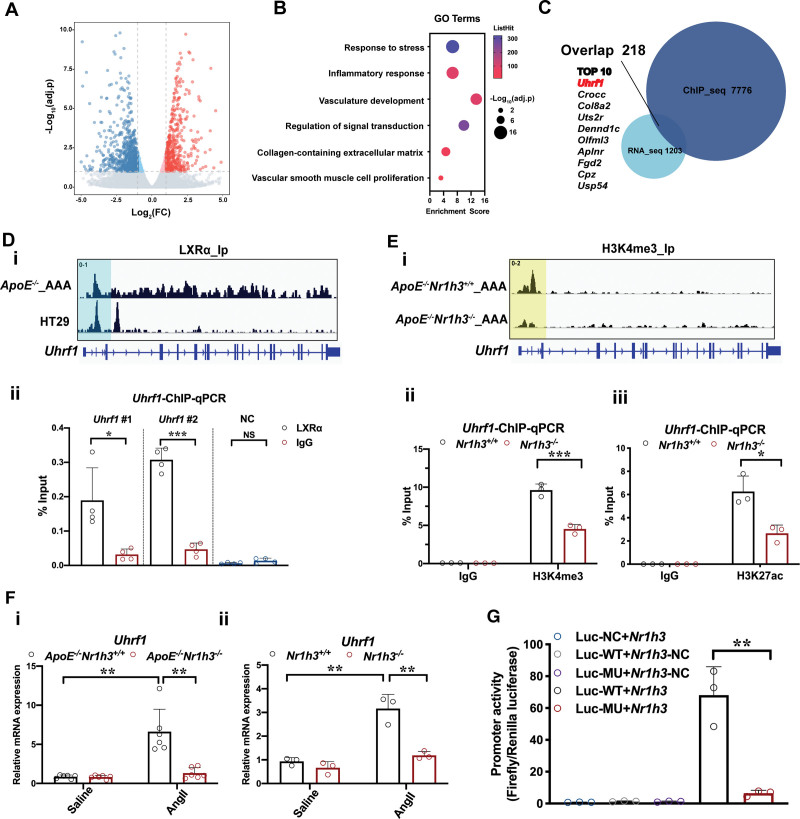
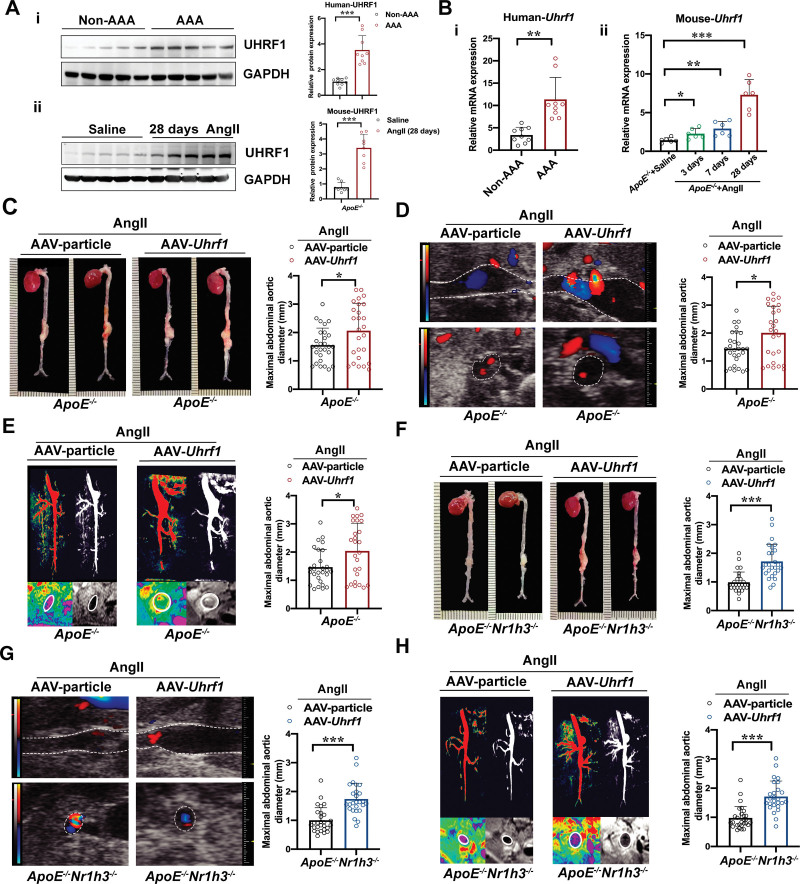
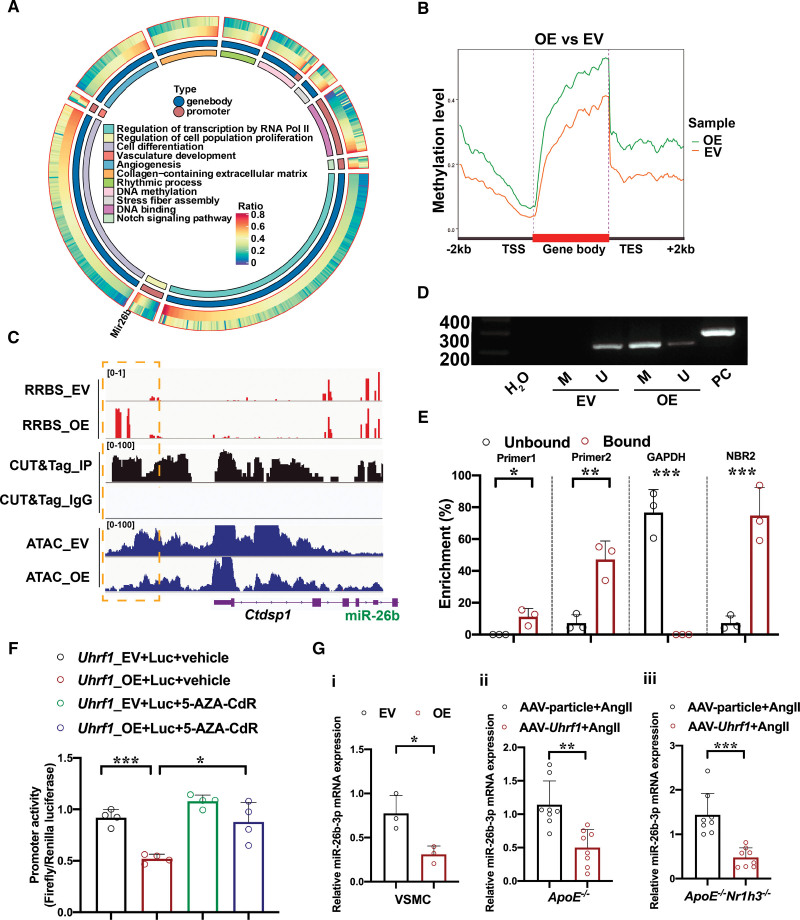
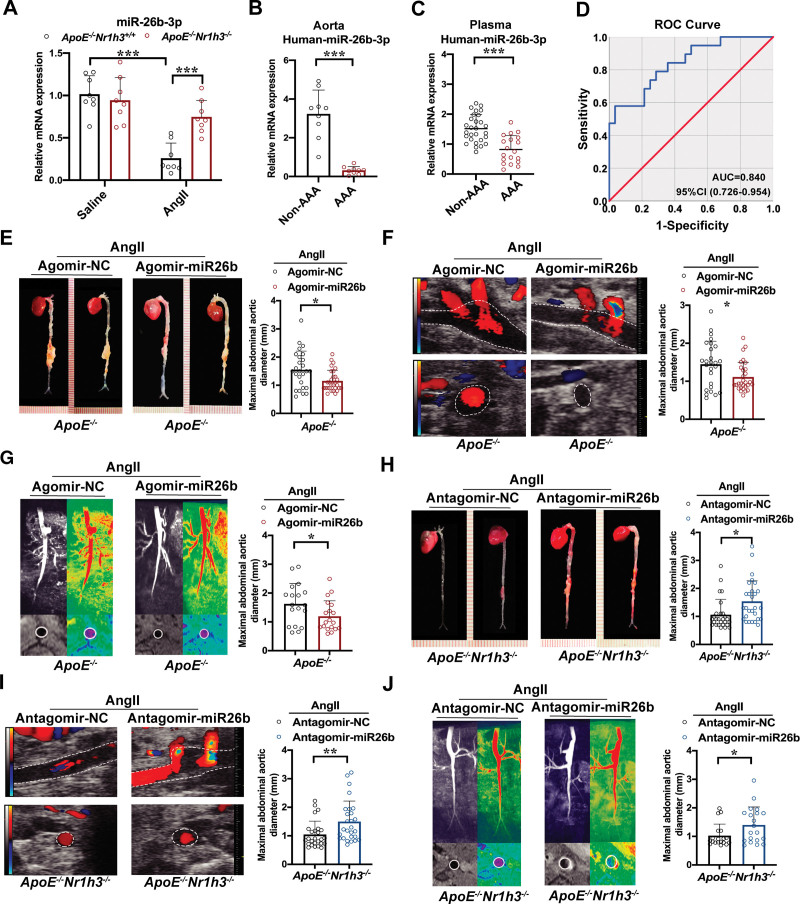
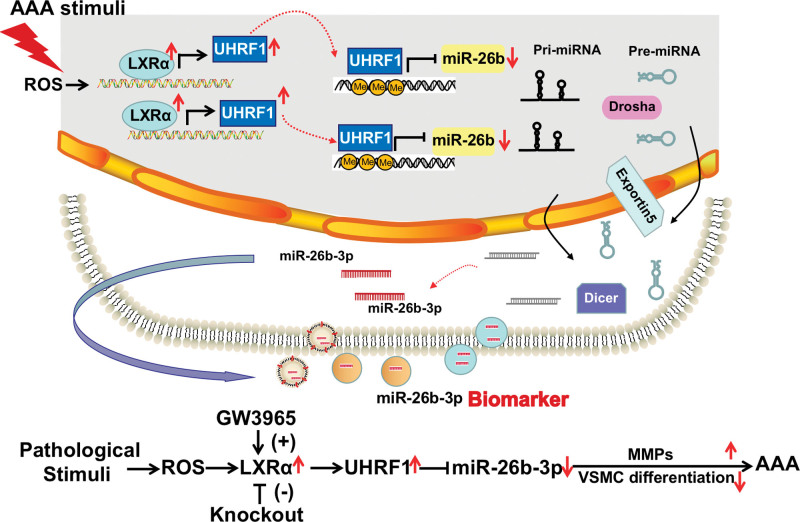
Results: Upregulated LXRα was observed in the aortas of patients with AAA and in angiotensin II- or CaCl2-treated mice. Global or vascular smooth muscle cell-specific Nr1h3 knockout inhibited AAA formation in 2 mouse models. Loss of LXRα function prevented extracellular matrix degeneration, inflammation, and vascular smooth muscle cell phenotypic switching. Uhrf1, an epigenetic master regulator, was identified as a direct target gene of LXRα by integrated analysis of transcriptome sequencing and chromatin immunoprecipitation sequencing. Susceptibility to AAA development was consistently enhanced by UHRF1 (ubiquitin-like containing PHD and RING finger domains 1) in both angiotensin II- and CaCl2-induced mouse models. We then determined the CpG methylation status and promoter accessibility of UHRF1-mediated genes using CUT&Tag (cleavage under targets and tagmentation), RRBS (reduced representation bisulfite sequencing), and ATAC-seq (assay for transposase-accessible chromatin with sequencing) in vascular smooth muscle cells, which revealed that the recruitment of UHRF1 to the promoter of miR-26b led to DNA hypermethylation accompanied by relatively closed chromatin states, and caused downregulation of miR-26b expression in AAA. Regarding clinical significance, we found that underexpression of miR-26b-3p correlated with high risk in patients with AAA. Maintaining miR-26b-3p expression prevented AAA progression and alleviated the overall pathological process.

Conclusions: Our study reveals a pivotal role of the LXRα/UHRF1/miR-26b-3p axis in AAA and provides potential biomarkers and therapeutic targets for AAA.

Keywords: aortic aneurysm, abdominal; biomarkers; myocytes, smooth muscle.


Conflict of interest statement

Disclosures None.

Figures

Figure 1.
Figure 1.
LXRα expression is increased in human and murine abdominal aortic aneurysm tissues. A, Protein levels of LXRα (liver X receptor α) in: (i) human abdominal aortic aneurysm (AAA) samples, (ii) mouse abdominal aortic samples from angiotensin II (AngII)–induced AAA for 28 days, and (iii) samples from mice at the early phases of 3 days and 7 days after AngII infusion. Healthy human abdominal aortas and abdominal aortas from saline-treated mice, respectively, were used as controls. Representative protein quantification of LXRα (i, n=9 per group; ii, n=8 per group; iii, n=8 per group). B, Quantitative reverse transcription polymerase chain reaction validation of upregulated Nr1h3 mRNA in human AAA samples (i; n=9 per group) and murine aortas at day 3, day 7, and day 28 after AngII induction (ii; n=5 per group). C, Representative images of LXRα expression by immunofluorescence staining of human AAA and non-AAA segments, costained with the key smooth muscle cell–associated marker α–smooth muscle actin (α-SMA) and DAPI (i). Scale bar=50 µm. Quantification of fluorescence intensity of LXRα (ii; n=5 per group). D, Representative images of LXRα expression by immunofluorescence staining in mouse suprarenal abdominal aortas from saline-infused or AngII-infused mice, costained with α-SMA and DAPI (i). Scale bar=20 μm. Quantification of fluorescence intensity of LXRα (ii; n=5 per group). Unpaired t test with Welch correction for A-i, A-ii, B-i, and D-ii. Welch ANOVA for A-iii and B-ii. Unpaired t test for C. Data expressed as mean±SD. *P<0.05; **P<0.01; ***P<0.001.
Figure 2.
Figure 2.
Effects of global and vascular smooth muscle cell–specific Nr1h3 depletion on angiotensin II–induced abdominal aortic aneurysm. A, Representative images of the abdominal aorta visualized by macroscopic examination in ApoE−/−Nr1h3+/+, and ApoE−/−Nr1h3−/− mice after 28 days of saline or angiotensin II (AngII) infusion. Arrow indicates typical abdominal aortic aneurysm (AAA). B, Quantification of the maximal diameter of suprarenal abdominal aortas from A (n=10 for saline treatment; n=36–38 for AngII treatment). C, Representative images of macroscopic features and hematoxylin & eosin staining of aneurysm ruptures (i; arrow) and the incidence of AngII-induced aneurysm rupture in the indicated groups (ii; n=40 per group). D, Survival curves in the indicated groups (n=40 per group). E, The incidence of AngII-induced AAA in the indicated groups (n=40 per group). F and G, Representative images of the abdominal aorta visualized by Doppler ultrasound (F; n=27–35 per group) and magnetic resonance imaging (G; n=15–18 per group) in the indicated groups. H through J, Representative images of the abdominal aorta visualized by macroscopic examination (H), Doppler ultrasound (I), and magnetic resonance imaging (J) in ApoE−/−Nr1h3flox/flox, and ApoE−/−Nr1h3△SMC mice after 28 days of AngII infusion (n=22 or 23 per group). Two-way ANOVA after Bonferroni multiple comparisons for B. χ2 test for C-ii and E. Survival data in D were analyzed by the Kaplan-Meier method and compared using log-rank tests. Unpaired Student t test for F through J. Data are expressed as mean±SD. *P<0.05; **P<0.01; ***P<0.001.
Figure 3.
Figure 3.
LXRα directly regulates Uhrf1 expression. A, RNA sequencing samples divided into 2 groups: ApoE−/−Nr1h3+/+, and ApoE−/−Nr1h3−/− at day 28 after angiotensin II (AngII) administration (n=3 per group). Volcano plot comparing the gene expression of ApoE−/−Nr1h3−/− vs ApoE−/−Nr1h3+/+, with blue dots representing significantly downregulated genes (n=719) and red dots representing significantly upregulated genes (n=484). B, Selected categories identified from Gene Ontology (GO) analysis of differentially expressed genes (DEGs) from the volcano plot. C, Venn diagrams depicting 218 overlapped genes between 1203 DEGs from RNA sequencing and 7776 genes identified as directly bound by LXRα (liver X receptor α) in chromatin immunoprecipitation followed by sequencing (ChIP-seq) analyses. Overlapped genes are cumulated by the rank on the basis of the regulatory potential score from high to low. The top 10 genes are listed. D, A genomic snapshot of LXRα ChIP-seq signals at the Uhrf1 locus in murine abdominal aortic aneurysm (AAA) samples (3 pooled aortas) and loading public ChIP-seq data sets of colorectal adenocarcinoma HT29 cells (GSE77039) from Cistrome DB. Green highlights the LXRα-dependent ChIP-seq peaks (i). Enrichment of LXRα at Uhrf1 promoters by ChIP–polymerase chain reaction (PCR) assay using LXRα ChIP grade antibodies (immunoglobulin G as a negative control). Two primers directed against binding sites were used to assess LXRα occupancy. A negative control primer was designed in the intergenic regions (ii; n=4 per group). E, A genomic snapshot of associated H3K4me3 histone marks at the Uhrf1 locus in AAA samples from AngII-infused ApoE−/−Nr1h3+/+ and ApoE−/−Nr1h3−/− mice, indicating a significant decrease of ChIP-seq signals around the transcriptional start site in the absence of Nr1h3 (i). Quantitative PCR analyses of ChIP assays of H3K4me3 (ii) and H3K27ac (iii) binding to the Uhrf1 promoter in AngII-treated Nr1h3+/+ and Nr1h3−/− vascular smooth muscle cells (n=3 per group). F, Quantitative PCR analyses of Uhrf1 in aortas from saline- or AngII-infused ApoE−/−Nr1h3+/+ and ApoE−/−Nr1h3−/− mice (i; n=6 per group), and in Nr1h3+/+ and Nr1h3−/− vascular smooth muscle cells with saline or AngII treatment (1 µM, 24 h; ii; n=3 per group). G, Luciferase activity of the intact (wild-type [WT]) or mutated (MU) promoter–reporter constructs cotransfected with the plasmid encoding Nr1h3 in HEK293T cells (n=3 per group). Paired 2-sided Student t test for D-ii. Two-way ANOVA after Bonferroni multiple comparisons for F-ii. Unpaired Student t test for E-ii and E-iii. Welch ANOVA test followed by a post hoc analysis using the Tamhane T2 method for F-i and G. Data are expressed as mean±SD. *P<0.05; **P<0.01; ***P<0.001.
Figure 4.
Figure 4.
Effect of UHRF1 modulation in angiotensin II–induced abdominal aortic aneurysm. A, Western blot showing expression of UHRF1 (ubiquitin-like containing PHD and RING finger domains 1) in human abdominal aortic aneurysm (AAA) and healthy control samples, and quantification for Western blotting analysis (i; n=9 per group). Western blot showing expression of UHRF1 in murine samples from mice that developed AAA after 28 days of saline or angiotensin II (AngII) infusion, and quantification for Western blotting analysis (ii; n=8 per group). B, Quantitative reverse transcription polymerase chain reaction showing Uhrf1 mRNA levels in human AAA and healthy control samples (i; n=9 per group) and murine samples from saline- or AngII-infused mice at days 3, 7, and 28 (ii; n=6 per group). ApoE−/− and ApoE−/−Nr1h3−/− mice were injected with adeno-associated virus (AAV)–particle (empty vector) or AAV-Uhrf1 by the tail vein for 3 weeks, and then infused with AngII and fed a high-fat diet for 28 days. C through E, Representative images of the abdominal aorta visualized by macroscopic examination (C), Doppler ultrasound (D), and magnetic resonance imaging (E) in ApoE−/− mice with AAV-particle or AAV-Uhrf1 injection in the AngII-induced AAA model. F through H, Representative images of the abdominal aorta visualized by macroscopic examination (F), Doppler ultrasound (G), and magnetic resonance imaging (H) in ApoE−/−Nr1h3−/− mice with AAV-particle or AAV-Uhrf1 injection in the AngII-induced AAA model. Quantification of the maximal diameter of suprarenal abdominal aortas in the indicated groups (n=26–28 per group). Unpaired Student t test for A-ii and C through H. Unpaired 2-tailed t test with Welch correction for A-i and B-i. One-way ANOVA for B-ii. Data are expressed as mean±SD. *P<0.05; **P<0.01; ***P<0.001.
Figure 5.
Figure 5.
Vascular smooth muscle cell–specific Uhrf1 knockout attenuates angiotensin II–induced abdominal aortic aneurysm and resists GW3965. A through C, Tamoxifen-induced ApoE−/−SMC-Uhrf1iKO and ApoE−/−SMC-Uhrf1WT mice were infused with angiotensin II (AngII) for 28 days. Representative images of the abdominal aorta visualized by macroscopic examination (A), Doppler ultrasound (B), and magnetic resonance imaging (C) in the indicated groups. Quantification of the maximal diameter of suprarenal abdominal aortas (n=27–29 per group). D through F, AngII-infused ApoE−/−SMC-Uhrf1iKO mice were intraperitoneally injected with vehicle or GW3965 (10 mg/kg) every other day for 28 days. Representative images of the abdominal aorta visualized by macroscopic examination (D), Doppler ultrasound (E), and magnetic resonance imaging (F) in the indicated groups. Quantification of the maximal diameter of suprarenal abdominal aortas (n=28–29 per group). Unpaired 2-tailed t test with Welch correction for A through C. Unpaired Student t test for D through F. Data are expressed as mean±SD. *P<0.05; **P<0.01; ***P<0.001. iKO indicates inducible gene knockout; SMC, smooth muscle cell; and WT, wild-type.
Figure 6.
Figure 6.
UHRF1 downregulates miR-26b-3p expression by promoter methylation. Vascular smooth muscle cells (VSMCs) were infected with lentivirus harboring the exogenous Uhrf1 for 72 hours followed by puromycin (7 µg/mL) treatment for 24 hours. RRBS (reduced representation bisulfite sequencing), ATAC-seq (assay for transposase-accessible chromatin with sequencing), and CUT&Tag (cleavage under targets and tagmentation) were then performed on VSMCs with stable overexpression of either empty vector (EV) or Uhrf1-containing constructs (OE). A, Heatmaps summarizing methylation values of differentially methylated genes (DMGs) between EV and OE groups (the outer 2 circles). The colors range from blue (low methylation) to red (high methylation). The middle layer represents gene with a differentially methylated region (DMR) located either in gene body or in promoter. The inner layer represents Gene Ontology (GO) analyses of DMGs. B, Averaged CpG methylation level profiles of all genes from 2 kb upstream (−) of transcription start sites (TSSs) through scaled gene bodies to 2 kb downstream (+) of transcription end sites (TESs) for each group. C, Genome browser views of DNA methylation (red), UHRF1 (ubiquitin-like, containing PHD and RING finger domains, 1) binding (black), and chromatin accessibility (blue) in the miR-26b promoter regions. The dotted yellow box shows gain of CG methylation with matched decreased chromatin accessibility profiles at UHRF1–bound promoters. D, Typical methylation-specific polymerase chain reaction (MSP) outcomes of miR-26b methylation in EV and Uhrf1-OE VSMCs. Commercial methylated DNA is used as a positive control (D5012; Zymo Research). E, Methylated DNA precipitation after quantitative reverse transcription polymerase chain reaction showing the enrichment of CpG-methylated DNA from Uhrf1-OE VSMCs at particular loci using the MethylCollector Ultra kit (Active Motif; 55005) according to manufacturer instructions. The unbound fraction was performed as a comparison. The bound fraction is methylated DNA enriched by immunoprecipitation of the MBD2b/MBD3L1 protein complex. The control genomic DNA is included in the kit along with PCR primers specific for both unmethylated (GAPDH) and methylated (NBR2) promoters, to be used respectively as negative and positive controls (n=3 per group). F, Effects of UHRF1 on the luciferase activities of the miR-26b promoter with vehicle or 5-aza-CdR treatment. The luciferase reporter construct carrying promoter fragments including methylated CpG sites was cotransfected with a Uhrf1-coding vector into VSMCs. Then the cells were added with 5 µM 5-aza-CdR for 24 hours. Luciferase activities were measured by a dual luciferase assay (n=4 per group). G, Quantitative reverse transcription polymerase chain reaction showing miR-26b-3p expression in EV and Uhrf1-OE VSMCs (i; n=3 per group). Quantitative reverse transcription polymerase chain reaction showing miR-26b-3p expression in abdominal aortas from adeno-associated virus (AAV)–particle or AAV-Uhrf1-injected ApoE−/− mice (ii; n=8 per group) and ApoE−/−Nr1h3−/− mice (iii; n=8 per group) after AngII modeling. Paired 2-sided Student t test for E. One-way ANOVA after Bonferroni multiple comparisons for F. Unpaired Student t test for G. Data are expressed as mean±SD. *P<0.05; **P<0.01; ***P<0.001. M indicates methylated primers; and U, unmethylated primers.
Figure 7.
Figure 7.
The role of miR-26b-3p in abdominal aortic aneurysm. A, Quantitative reverse transcription polymerase chain reaction showing miR-26b-3p expression in abdominal aortas from saline- or angiotensin II (AngII)–infused ApoE−/−Nr1h3+/+, and ApoE−/−Nr1h3−/− mice (n=8 per group). B, Quantitative reverse transcription polymerase chain reaction showing miR-26b-3p expression in human abdominal aortic aneurysm (AAA) and healthy control samples (n=9 per group). C, The expression levels of miR-26b-3p in the plasma were assessed by quantitative reverse transcription polymerase chain reaction in a group of patients with AAA and matched healthy donors. D, Receiver operating characteristic (ROC) curve of miR-26b-3p levels in the plasma for identifying patients with AAA. E through G, Agomir miR-26b-3p and agomir negative control (NC) at a dose of 10 nmol/mouse were injected in ApoE−/− mice by the tail vein once a week when AngII infusion started, followed by a high-fat diet for 28 days. Representative images of the abdominal aorta visualized by macroscopic examination (E), Doppler ultrasound (F), and magnetic resonance imaging (G) in ApoE−/− mice with agomir miR-26b-3p and agomir NC injection in the AngII-induced AAA model. Quantification of the maximal diameter of suprarenal abdominal aortas in the indicated groups (n=26–29 per group in E and F; n=18–19 per group in G). H through J, Antagomir miR-26b-3p and antagomir NC at a dose of 100 nmol/mouse were injected in ApoE−/−Nr1h3−/− mice by the tail vein once a week when AngII infusion started, followed by high-fat diets for 28 days. Representative images of the abdominal aorta visualized by macroscopic examination (H), Doppler ultrasound (I), and magnetic resonance imaging (J) in ApoE−/−Nr1h3−/− mice with antagomir miR-26b-3p and antagomir NC injection in the AngII-induced AAA model. Quantification of the maximal diameter of suprarenal abdominal aortas in the indicated groups (n=26–28 per group in H and I; n=19 or 20 per group in J). Two-way ANOVA after Bonferroni multiple comparisons for A. Unpaired Student t test for C and E through J. Unpaired 2-tailed t test with Welch correction for B. Data are expressed as mean±SD. *P<0.05; **P<0.01; ***P<0.001. AUC indicates area under the curve.
Figure 8.
Figure 8.
Proposed model for LXRα in the pathogenesis of abdominal aortic aneurysm. Under a pathological state during abdominal aortic aneurysm (AAA) development, upregulation of LXRα (liver X receptor α) by excessive reactive oxygen species (ROS) accumulation transactivates Uhrf1, which downregulates miR-26b-3p expression by methylating the promoter in vascular smooth muscle cells (VSMCs), therefore leading to pathological extracellular matrix degradation and VSMC conversion, and eventually resulting in the formation of AAA. MMP indicates matrix metalloproteinase.

Comment in

Similar articles

Cited by

References

    1. Golledge J. Abdominal aortic aneurysm: update on pathogenesis and medical treatments. Nat Rev Cardiol. 2019;16:225–242. doi: 10.1038/s41569-018-0114-9 - PubMed
    1. Schanzer A, Oderich GS. Management of abdominal aortic aneurysms. N Engl J Med. 2021;385:1690–1698. doi: 10.1056/NEJMcp2108504 - PubMed
    1. Evans RM, Mangelsdorf DJ. Nuclear receptors, RXR, and the big bang. Cell. 2014;157:255–266. doi: 10.1016/j.cell.2014.03.012 - PMC - PubMed
    1. Hsieh J, Koseki M, Molusky MM, Yakushiji E, Ichi I, Westerterp M, Iqbal J, Chan RB, Abramowicz S, Tascau L, et al. . TTC39B deficiency stabilizes LXR reducing both atherosclerosis and steatohepatitis. Nature. 2016;535:303–307. doi: 10.1038/nature18628 - PMC - PubMed
    1. Wang B, Tontonoz P. Liver X receptors in lipid signalling and membrane homeostasis. Nat Rev Endocrinol. 2018;14:452–463. doi: 10.1038/s41574-018-0037-x - PMC - PubMed

MeSH terms