. 2024 May 10;134(10):1330-1347.
doi: 10.1161/CIRCRESAHA.123.323190. Epub 2024 Apr 1.

CD151 Maintains Endolysosomal Protein Quality to Inhibit Vascular Inflammation

Affiliations

CD151 Maintains Endolysosomal Protein Quality to Inhibit Vascular Inflammation

Junxiong Chen et al. Circ Res. .

Abstract

Background: Tetraspanin CD151 is highly expressed in endothelia and reinforces cell adhesion, but its role in vascular inflammation remains largely unknown.

Methods: In vitro molecular and cellular biological analyses on genetically modified endothelial cells, in vivo vascular biological analyses on genetically engineered mouse models, and in silico systems biology and bioinformatics analyses on CD151-related events.

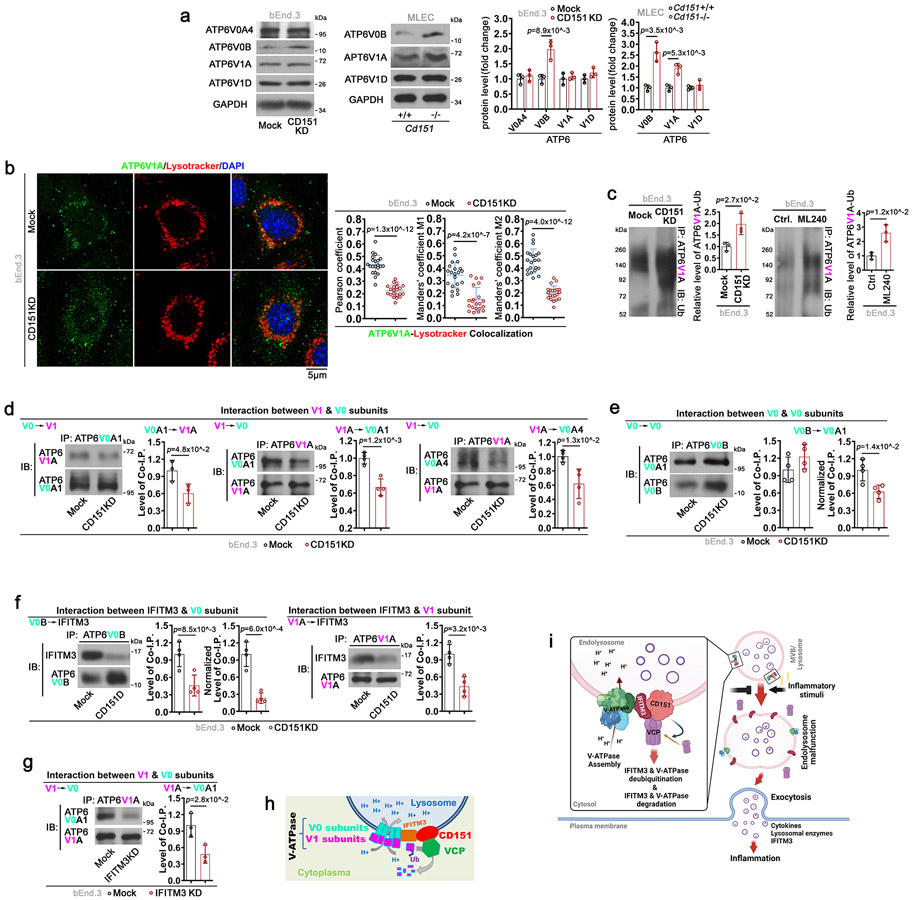
Results: Endothelial ablation of Cd151 leads to pulmonary and cardiac inflammation, severe sepsis, and perilous COVID-19, and endothelial CD151 becomes downregulated in inflammation. Mechanistically, CD151 restrains endothelial release of proinflammatory molecules for less leukocyte infiltration. At the subcellular level, CD151 determines the integrity of multivesicular bodies/lysosomes and confines the production of exosomes that carry cytokines such as ANGPT2 (angiopoietin-2) and proteases such as cathepsin-D. At the molecular level, CD151 docks VCP (valosin-containing protein)/p97, which controls protein quality via mediating deubiquitination for proteolytic degradation, onto endolysosomes to facilitate VCP/p97 function. At the endolysosome membrane, CD151 links VCP/p97 to (1) IFITM3 (interferon-induced transmembrane protein 3), which regulates multivesicular body functions, to restrain IFITM3-mediated exosomal sorting, and (2) V-ATPase, which dictates endolysosome pH, to support functional assembly of V-ATPase.

Conclusions: Distinct from its canonical function in strengthening cell adhesion at cell surface, CD151 maintains endolysosome function by sustaining VCP/p97-mediated protein unfolding and turnover. By supporting protein quality control and protein degradation, CD151 prevents proteins from (1) buildup in endolysosomes and (2) discharge through exosomes, to limit vascular inflammation. Also, our study conceptualizes that balance between degradation and discharge of proteins in endothelial cells determines vascular information. Thus, the IFITM3/V-ATPase-tetraspanin-VCP/p97 complexes on endolysosome, as a protein quality control and inflammation-inhibitory machinery, could be beneficial for therapeutic intervention against vascular inflammation.

Keywords: cell adhesion; endothelial cells; multivesicular bodies; proteolysis; ubiquitin.


Conflict of interest statement

Disclosures None.

Figures

Figure 1
Figure 1. Endothelium-specific ablation of Cd151 leads to pulmonary inflammation and escalates vascular inflammatory responses.
a: H&E staining of lung sections from control (Ctrl.) and Cd151iΔEC mice with age of 22 weeks. All mice were treated with tamoxifen. b: Left: Miles assay of Ctrl. and Cd151iΔEC mouse lungs was performed at 2 and 16 weeks after tamoxifen injection. Extravasated Evans blue was quantified and is presented as mean±SD (n=6 mice for Ctrl. group and n=9 mice for Cd151iΔEC group). Right: Lung sections from Ctrl. and Cd151iΔEC mice were stained for IgG, IgA, and IgE and C3 and C1q with immunofluorescence. Levels of these proteins are projected by their fluorescence intensities (mean±SD, n=6 mice for each group). Representative images are shown in Figure S3b-c. c: Fluorescence microscopic images of the lung sections from Ctrl.;mTmG+ and Cd151iΔEC;mTmG+ mice. Percentages of blood vessels with intra- and peri-vessel wall infiltration were presented as mean±SD (n=6 mice per group). d: Immunofluorescence of lung sections from Ctrl. and Cd151iΔEC mice. Percentages of blood vessels with the CD45+ cell infiltration are presented as mean±SD (n=6 mice per group). Numbers of F4/80+ cell are presented as mean±SD (n=10 mice for each group). e: MPO activities of the lung tissues from Ctrl. and Cd151iΔEC mice (mean±SD, n=7 mice for Ctrl. group and n=5 mice for Cd151iΔEC group). f: Ctrl. and Cd151iΔEC mice were infused with angiotensin II (Ang II, diluted in saline, 1mg/kg/day) or vehicle (saline) for 28 days. Mouse heart sections were stained with CD45 antibody (Red) and DAPI (Blue). Leukocyte infiltration is presented as the percentage of the fields containing CD45+ cell per mouse (mean±SD, n=6 mice for Ctrl.+Vehicle or Cd151iΔEC+Vehicle group, n=7 mice for Ctrl.+Ang II or Cd151iΔEC+Ang II group). g: Kaplan-Meier curves of Ctrl. and Cd151iΔEC mice in LPS-caused sepsis. The mice were challenged with LPS (18 mg/kg, i.p.) or PBS (groups PBS+Ctrl.: n=10 mice, PBS+Cd151iΔEC: n=10 mice, LPS+Ctrl.: n=9 mice, and LPS+Cd151iΔEC: n=8 mice), and their survival rates were evaluated by Kaplan-Meier curves and compared by Log-rank (Mantel-Cox) test. h: Ctrl. and Cd151iΔEC mice were treated with LPS (12 mg/kg, i.p.) or PBS for 12 hours, H&E staining of the lung sections was performed, and pathological changes were graded as lung injury score (mean±SD, groups PBS+Ctrl.: n=6 mice, PBS+Cd151iΔEC: n=6 mice, LPS+Ctrl.: n=9 mice, and LPS+Cd151iΔEC: n=9 mice). i: Cd151 removal exacerbates Covid19 progression. Left: the mice were challenged with SARS-CoV-2. Mouse survival rates were determined as described above. Right: changes in body weight were monitored and are presented as percentage of initial weight (Cd151+/+;hACE2-tg group: n=11 mice; Cd151−/−;hACE2-tg group: n=13 mice). j: Cd151 removal worsens lung inflammation of Covid19. H&E staining of lung sections from the mice that were infected with SARS-CoV-2 and ended at the 5th day after the infection was graded for lung injury score (mean±SD, Cd151+/+;hACE2-tg group: n=7 mice; Cd151−/−;hACE2-tg group: n=7 mice). Arrows: infiltrated inflammatory cells (Yellow: peri-bronchi area; Black: peri-vessel area). Methods of statistical analysis are listed in Supplemental Table S1.
Figure 2
Figure 2. Endothelial removal of CD151 promotes exosomal release of Angiopoietin-2 (ANGPT2).
a: Top 20 signaling pathways associated with endothelial Cd151 ablation, based on RNA-seq of Cd151−/− versus Cd151+/+ MLECs, are listed according to their p-values. The bubble chart of gene set enrichment ratio was performed with Rstudio software and the Genomatix Pathways System. b: Levels of IL-1β, TNF-α, and ANGPT2 in the culture supernatants of primary MLECs isolated from 8~12-week-old mice (upper) and blood plasma of Ctrl. and Cd151iΔEC mice (lower). Results are presented as mean±SD (n=7 individual experiments for Cd151+/+ or Cd151−/− group; n=6 mice for Ctrl. or Cd151iΔEC group). Panels of cytokine secretomes are shown in Figure S5a-b. c: Tissue distribution of ANGPT2. Mouse lung sections were stained for CD31 (green), ANGPT2 (red), and nucleus (blue) and imaged. ANGPT2 expression in lungs were quantified as fluorescence area per field (%) and fluorescence intensity per CD31+ cell (mean±SD, n=5 mice for each group). d: Exosomal ANGPT2 and cytoplasmic GAPDH proteins from MLECs were examined with Western blot and quantified as band densities. CD151 band densities were normalized by the band densities of loading control GAPDH and presented as the levels relative to its normalized density in Cd151+/+ group (Mean±SD, n=4 individual experiments). e: EVs from Cd151−/− and Cd151+/+ MLECs were detected by Nanosight. Concentrations of EVs (20-1,000nm), exosome (20-200nm), and microparticles (200-1,000nm) and their sizes are presented as mean±SD (n=8 individual experiments). TEM images of the isolated exosomes from bEnd.3-Mock and -CD151KD cells. f: TEER of the MLEC monolayers treated with or without the condition media (C.M.) of Cd151−/− MLECs was measured (mean±SD, n=6 individual experiments). TEER of bEnd.3-Mock and -CD151KD monolayers treated with or without angiopoietin-2 (ANGPT2, 100 ng/ml) was measured (mean±SD, n=8 individual experiments). g: The HMECs were stained for ANGPT2 and LBPA, and their colocalization was then examined in immunofluorescence with confocal microscopy and quantified as Pearson’s coefficients (mean±SD, n=6 individual experiments). h: Effects of Nex20 on EV and exosomal ANGPT2. Left: EVs from the Cd151−/− and Cd151+/+ MLECs treated with Nex20 (dissolved in DMSO, 5 μM) or DMSO for 4h were detected by Nanosight. Total EVs concentration are presented as mean±SD (n=4 individual experiments). Right: ANGPT2 proteins in the exosomes were examined by Western blot and quantified as band densities as described above (mean±SD, n=3 individual experiments). i: Primary MLECs were treated with Nex20 (5 μM) or DMSO for 4h. Levels of ANGPT2 in the culture supernatants of the MLECs were measured, and the results are presented as mean±SD (n=5 individual experiments). j: Ctrl. and Cd151iΔEC mice were treated with LPS (12 mg/kg) and Nex20 (15 mg/kg) or vehicle (DMSO). Nex20 was injected into mice intraperitoneally 3 hours prior to LPS administration. Lung injury scores based on H&E staining were measured and are presented as mean±SD (groups LPS+Vehicle+Ctrl.: n=12 mice, LPS+Vehicle+Cd151iΔEC: n=12 mice, LPS+Nex20+Ctrl.: n=9 mice, and LPS+Nex20+Cd151iΔEC: n=9 mice). k: Ctrl. and Cd151iΔEC mice were treated with LPS (12 mg/kg) and Nex20 (15 mg/kg) or vehicle. Nex20 was injected into mice intraperitoneally 3 hours prior to LPS administration. MPO activities of lung tissues were measured and is presented as mean±SD (n=6 mice/group). l: Ctrl. and Cd151iΔEC mice were treated with LPS (18 mg/kg) and Nex20 (15 mg/kg) or vehicle (DMSO). Nex20 or vehicle was injected into mice intraperitoneally 3 hours prior to LPS administration. The animal survivals were monitored (Vehicle+Ctrl. group: n=15 mice; Vehicle+Cd151iΔEC: n=15 mice; Vehicle+LPS+Ctrl.: n=21 mice; Vehicle+LPS+Cd151iΔEC: n=20 mice; Nex20+LPS+Ctrl.: n=21 mice; and Nex20+LPS+Cd151iΔEC: n=20 mice), and their survival rates were determined as described above. m: Ctrl. and Cd151iΔEC mice were treated with the neutralizing antibody against murine ANGPT2 (dissolved in PBS, 4 mg/kg, i.p.) or control IgG. After 24 h, LPS (12 mg/kg, i.p.) was administered. Lungs were harvested at 12 h after the administration, sectioned, and processed for H&E staining. Lung injury scores were assessed and are presented as mean±SD (n=9 mice/group). Representative images are shown in Figure S5e. Methods of statistical analysis are listed in Supplemental Table S1.
Figure 3
Figure 3. Physical association of CD151 with IFITM3 and its functional effects.
a: Immunoprecipitate of integrin α3-CD151 complex was acquired by human integrin α3 mAb IVA5 and analyzed with NanoLC ion trap MS/MS proteomics technology. Proteins precipitated with the complexes and with score>400 were listed. b: Co-immunoprecipitation (co-IP) with human CD151 mAb 11G5α and mouse IgG and immunoblot with IFITM3 Ab were performed in HT1080 under 1% Brij-98 and 1% Triton X-100 lysis conditions. Neg: 11G5α was incubated with lysis buffer and precipitated by the beads. c: Interactions between indicated proteins were examined with PLA in HMECs. PLA signals, in red fluorescence, were quantified and are presented as mean±SD (n=6 individual experiments). d: Importance of CD151 palmitoylation for the IFITM3-CD151-VCP complex formation. Left: Schematic presentation of CD151 reconstitution in CD151-silenced A431 cells, including CD151 wildtype (WT) and CD151 palmitoylation-deficient mutant (Palm). Right: A431 cells were lyzed with 1% Brij-98 lysis buffer, and the lysates were immunoprecipitated with Flag antibody and immunoblotted for IFITM3, VCP, CD151, and Flag tag. e: Distributions of the indicated proteins in bEnd.3 ECs were examined in immunofluorescence with confocal microscopy, and their colocalizations were quantified as Manders’ coefficients (n=20 cells). Insets present magnified portions of the images. f: Levels of IFITM1 and IFITM3 proteins in Cd151+/+ and Cd151−/− MLECs were detected by Western blot and are presented as band densities, which were normalized by the band densities of loading control GAPDH and presented as the levels relative to the normalized density of the same protein in Cd151+/+ group (mean±SD, n=3 individual experiments). g: IFITM3 and LBPA in Cd151+/+ and Cd151−/− MLECs, Mock and CD151KD of bEnd.3 cells were examined in immunofluorescence with confocal microscopy. LBPA and IFITM3-LBPA colocalization were quantified and are presented as fluorescence intensity per cells and Pearson’s coefficient (mean±SD, n=20 cells/group), respectively. Images of separated channels are shown in Figure S6f. h: IFITM3 and LBPA in bEnd.3-Mock and -CD151KD cells were examined by immunofluorescence with Structured Illumination Microscopy (SIM). Left: shown are the transversal and peripheral views of MVBs from 3D reconstruction of the staining (The side view is shown in Figure S6g); Right: shown are single focal plane. i: Indicated proteins in the exosomes purified from culture supernatants of bEnd.3 cells (left) and MLECs (right) were examined with Western blot and are quantified by band densities as described above (mean±SD, n=3 individual experiments for bEnd.3 cells and n=4 for MLECs). j: Lung sections from Ctrl. and Cd151iΔEC mice treated with LPS (12 mg/kg, i.p., 12 hours) were stained in immunohistochemistry with Cathepsin D Ab. Cathepsin D protein levels in endothelium and medium of blood vessels were quantified and are presented as OD value (mean±SD, n=22 images/group, 3~5 images per optical plane and 4~5 optical planes per mouse lung were analyzed for each group which contains 5 mice, and each data dot indicates the average signal density of each optical plane). k: MLECs were transfected with control or IFITM3 siRNA. IFITM3 and ANGPT2 protein were examined with Western blot and quantified as band densities as described above (mean±SD, n=3 individual experiments). l: MLECs were transfected with control or IFITM3 siRNA. At 48 hours after the transfection, EVs in the culture supernatants were analyzed by Nanosight and quantified as number and size (mean±SD, n=3 individual experiments). m: Ctrl. and Cd151iΔEC mice were treated with LPS (18mg/kg) and CsH (2 mg/kg) or vehicle, which was injected i.p. at 3 hours prior to LPS administration. The mice (groups Vehicle+Ctrl.: n=14 mice; Vehicle+Cd151iΔEC: n=15; Vehicle+LPS+Ctrl.: n=18; Vehicle+LPS+Cd151iΔEC: n=19; CsH+LPS+Ctrl.: n=21; and CsH+LPS+Cd151iΔEC: n=21) were monitored for survival, and their survival rates were assessed as described in Methods. n: Ctrl. and Cd151iΔEC mice received AAV2QuadYF-scramble shRNA or AAV2QuadYF-Ifitm3 shRNA (diluted in 200 μl PBS) via tail vein injection. After two weeks, acute lung injury was induced by LPS (12 mg/kg) as described above. Mouse lungs were harvested at 12 h after LPS administration, sectioned, and processed for H&E staining. Lung injury scores were assessed and are presented as mean±SD (n=6 mice/group). Representative images are shown in Figure S7f. o: Lung sections from the experiments described in panel n were stained for F4/80 in immunofluorescence. Number of F4/80+ cell is presented as mean±SD (n=6 mice/group). Representative images are shown in Figure S7g. Methods of statistical analysis are listed in Supplemental Table S1.
Figure 4
Figure 4. Importance of IFITM3 for CD151 activities and of CD151 for VCP-IFITM3 association
a: Distributions of CD151 and VCP in bEnd.3 ECs were examined in immunofluorescence with confocal microscopy, and their colocalizations were quantified as Manders’ coefficients (mean±SD, n=20 cells). b: top: VCP proteins in bEnd.3 transfectants were examined in Western blot and quantified as band densities, which were normalized by the band densities of loading control GAPDH and presented as the levels relative to its normalized density in Mock group (mean±SD, n=5 individual experiments). bottom: The 1%Brij98 lysates of HMEC-Mock and -IFITM3KD cells were immunoprecipitated with human CD151 mAb (11G5α), followed by immunoblot for VCP. CL: cell lysates. c: Molecular dynamics and modeling of CD151-p97 N-terminal domain (p97N) interaction. Left: CD151 (green, generated using AlphaFold) embedded in a POPC membrane interacting with the N-terminal p97N binding module (blue, PDB 5B6C) following 500 ns of atomistic molecular dynamics. The SHP-binding domain of Ufd1 is shown as spheres (magenta). Resulting model shows that CD151 cytoplasmic termini and loop form a stable binding with the Nn-Nc binding cleft of p97N. Right: This binding is stabilized by both electrostatic and hydrophobic interactions: electrostatic (blue and red) and hydrophobicity (magenta and cyan) surface models shown for p97N and CD151. CD151 is rotated 180° while p97N is oriented to match MD docking results. d: CD151-VCP association independent of p47 and Npl4. Upper: HT1080 cells were lyzed with 1% Brij-98 lysis buffer, and the lysates were immunoprecipitated with mouse IgG, CD151 mAb (11G5α), CD63 mAb, CD81 mAb, and VCP mAb, followed by immunoblots for VCP, P47, Npl4, and Ufd1. Lower: Schematic representation of the CD151-VCP-Ufd1 interaction. This model shows a direct binding between CD151 (red) and p97 N-terminal domain (green), which anchors p97 near the membrane. Ufd1 (purple) binds directly to p97 through the SHC motif forming a ternary complex. e: The 1%Brij-98 lysates of bEnd.3 ECs were immunoprecipitated with IgG, IFITM3 Ab, and VCP Ab, followed by immunoblot for indicated proteins. CL: cell lysates. f: Interactions between indicated proteins were examined with PLA in bEnd.3 ECs. PLA signals, in red fluorescence, were quantified (mean±SD, n=20 cells). Scale bar: 5 μm. g: Colocalization of IFITM3 with VCP in bEnd.3 ECs was examined in immunofluorescence with confocal microscopy and quantified as Manders’ coefficient (mean±SD, n=20 cells per group). Insets present magnified portions of the images. h: Association of IFITM3 and VCP in bEnd.3 ECs was examined by their co-immunoprecipitation under 1%Brij-98 lysis condition and quantified as band densities as described above (mean±SD, n=5 individual experiments). i: Interaction between IFITM3 and VCP in bEnd.3 ECs and MLECs was examined with PLA. PLA signals, in red fluorescence, were quantified (mean±SD, n=20 cells). Representative images are shown in Figure S8f. j: bEnd.3 ECs were treated with MG132 (10 μM) for 2 h prior to lysis with 1% Triton X-100 buffer. The lysates were immunoprecipitated with IFITM3 Ab, and the precipitates were immunoblotted with ubiquitin Ab and quantified as band densities as described above (mean±SD, n=4 individual experiments). k: Schematic diagram for IFITM3-CD151-VCP complex. l: Colocalizations of LBPA with VCP, in bEnd.3-Mock and -CD151KD transfectants (Left) and in bEnd.3 ECs treated with control (DMSO) and VCP inhibitor ML240 (1 mM, diluted in DMSO) for 12 h (Right), were examined in immunofluorescence with confocal microscopy and quantified as Manders’ coefficients (mean±SD, n=40 cells per group). m: The cells were treated with ML240 (1 μM) at 37°C for 6 h, followed by cell lysis; and the indicated proteins were examined with Western blot and quantified by band densities as described above (mean±SD, n=3 individual experiments). n: EVs from the bEnd.3 ECs treated with LPS (1 μg/ml) and ML240 (1 μM) or control (DMSO) for 4 h were analyzed by Nanosight and quantified as number/ml (mean±SD, n=6 individual experiments). o: Immunofluorescence of IFITM3 in the bEnd.3 ECs treated with ML240 (1 μM) or control (DMSO) for 12 h was analyzed with confocal microscopy, and size of IFITM3-positive vesicles and IFITM3 fluorescence intensity were quantified (mean±SD, n=20 cells per group). Methods of statistical analysis are listed in Supplemental Table S1.
Figure 5
Figure 5. IFITM3-CD151-VCP complexes are required for the structural and functional integrity of MVBs/lysosomes.
a: Gene set enrichment analysis for proteins in the lysosome pathway, ranked by log2-transformed fold change. b: Numbers of intraluminal vesicle (ILV) in MVBs of HT1080 transfectants were quantified based on TEM analysis (mean±SD, n=60 cells per group). c: TEM analysis on MVBs in MLECs and HT1080 cells. MVB diameter was measured manually and is presented as mean±SD (n=20 cells per group). d: bEnd.3 ECs were treated with either IFITM3 siRNA (for 48 h), CsH (2.5 μM for 12 h), or ML240 (1 μM for 12 h), stained for LBPA in immunofluorescence, and examined with confocal microscopy. Size of vesicle is presented as average diameter of puncta within a cell (mean±SD, n=20 cells per group). e: HT1080-Mock and -CD151KD cells were transfected with control or IFITM3 siRNA and then stained with LBPA Ab or lysotracker and photographed with fluorescence confocal microscopy. Size of vesicle is presented as average diameter of puncta within a cell (mean±SD, n=20 cells per group). f: Mock and CD151KD transfectants of bEnd.3 ECs were incubated with lysotracker (1 μM) at 37 °C for 30 min and imaged with confocal microscopy. Lysosomes were quantified as the average diameter of puncta within a cell (mean±SD, n=20 cells per group). g: Lysosomes, revealed by lysotracker staining, in bEnd.3 and MLECs were quantified as numbers and fluorescence intensity per cell (mean±SD, n=20 cells per group). h: Lysosome pH was measured by incubation of bEnd.3 and HT1080 cells with LysoSensor Yellow/Blue DND-160 (3 μM) at 37°C for 10 min. By standard curve with a pH range of 3.5-6.0, the fluorescence intensity was converted to pH (mean±SD, n=3 individual experiments for bEnd.3 cells and n=5 for HT080 cells, **: p<0.01). i: Lysosome pH of the bEnd.3 cells treated with bafilomycin-A1 (BafA1) (200 nM) or ML240 (1 μM) for 1h was measured as described above and is presented as mean±SD (n=4 individual experiments). j: Mock and CD151KD transfects of bEnd.3 ECs were treated with ML240 (1 μM) for 12 h, then stained with CD63 mAb, and photographed with fluorescence confocal microscopy. Size of CD63-positive vesicle is presented as average diameter of puncta within a cell (mean±SD, n=20 cells per group). k: Indicated proteins in the lysates of bEnd.3-Mock and -CD151KD cells were examined with Western blot and quantified as band densities, which were normalized by the band densities of loading control GAPDH and presented as the levels relative to the normalized density of the same protein in Mock group (mean±SD, n=3 individual experiments). l: Indicated proteins of the purified lysosomes from MLECs and HMECs were examined with Western blot and quantified by band densities as described above (mean±SD, n=3 individual experiments). Methods of statistical analysis are listed in Supplemental Table S1.
Figure 6
Figure 6. IFITM3-CD151-VCP complexes are required for proper assemble of V-ATPase of lysosomes
a: Protein levels of V-ATPase subunits in bEnd.3 ECs and MLECs were examined with Western blot and quantified by band densities, which were normalized by the band densities of loading control GAPDH and presented as the levels relative to the normalized density of the same protein in Mock or Cd151+/+ group (mean±SD, n=3 individual experiments). b: Colocalization of ATP6V1A with lysotracker in bEnd.3-Mock and -CD151KD cells was examined in immunofluorescence with confocal microscopy and quantified as Pearson’s and Manders’ coefficients (mean±SD, n=20 cells per group). c: After being treated with or without MG132 (10 μM) at 37°C for 2 h, bEnd.3 ECs were lyzed with 1% Triton X-100 buffer. The lysates were immunoprecipitated with ATP6V1A Ab, and the precipitates were immunoblotted with ubiquitin Ab and quantified by band densities as described above (mean±SD, n=3 individual experiments). d: Physical interactions between cytoplasmic and transmembrane subunits of V-ATPase in bEnd.3 transfectants were examined by co-immunoprecipitation after cell lysis with 1% Triton X-100 buffer and quantified by band densities as described above (mean±SD, n=4 individual experiments). e: Physical interaction between transmembrane subunits of V-ATPase in bEnd.3 transfectants was examined by co-immunoprecipitation after cell lysis with 1% Triton X-100 buffer and quantified by band densities as described above (mean±SD, n=4 individual experiments). f: Physical interactions between IFITM3 and V-ATPase subunits in bEnd.3 transfectants were examined by co-immunoprecipitation after cell lysis with 1% Triton X-100 buffer and quantified by band densities as described above (mean±SD, n=4 individual experiments). g: Physical interactions between V-ATPase subunits in bEnd.3-Mock and -IFITM3KD transfectants were examined by co-immunoprecipitation after cell lysis with 1% Triton X-100 buffer and quantified by band densities as described above (mean±SD, n=3 individual experiments). h: Schematic presentation of functional crosstalk between CD151 and V-ATPase on endolysosome. i: Graphic abstract (created with BioRender.com). Methods of statistical analysis are listed in Supplemental Table S1.

References

    1. Hemler ME. Tetraspanin proteins promote multiple cancer stages. Nature Reviews Cancer. 2014;14:49–60 - PubMed
    1. Kazarov AR, Yang X, Stipp CS, Sehgal B, Hemler ME. An extracellular site on tetraspanin cd151 determines alpha 3 and alpha 6 integrin-dependent cellular morphology. The Journal of cell biology. 2002;158:1299–1309 - PMC - PubMed
    1. Sterk LM, Geuijen CA, van den Berg JG, Claessen N, Weening JJ, Sonnenberg A. Association of the tetraspanin cd151 with the laminin-binding integrins alpha3beta1, alpha6beta1, alpha6beta4 and alpha7beta1 in cells in culture and in vivo. Journal of cell science. 2002;115:1161–1173 - PubMed
    1. Takeda Y, Kazarov AR, Butterfield CE, Hopkins BD, Benjamin LE, Kaipainen A, Hemler ME. Deletion of tetraspanin cd151 results in decreased pathologic angiogenesis in vivo and in vitro. Blood. 2007;109:1524–1532 - PMC - PubMed
    1. Orlowski E, Chand R, Yip J, Wong C, Goschnick MW, Wright MD, Ashman LK, Jackson DE. A platelet tetraspanin superfamily member, cd151, is required for regulation of thrombus growth and stability in vivo. Journal of thrombosis and haemostasis : JTH. 2009;7:2074–2084 - PubMed

Publication types