. 2024 Apr 1;134(7):e169309.
doi: 10.1172/JCI169309.

Anti-PD-1 chimeric antigen receptor T cells efficiently target SIV-infected CD4+ T cells in germinal centers

Affiliations

Anti-PD-1 chimeric antigen receptor T cells efficiently target SIV-infected CD4+ T cells in germinal centers

Karsten Eichholz et al. J Clin Invest. .

Abstract

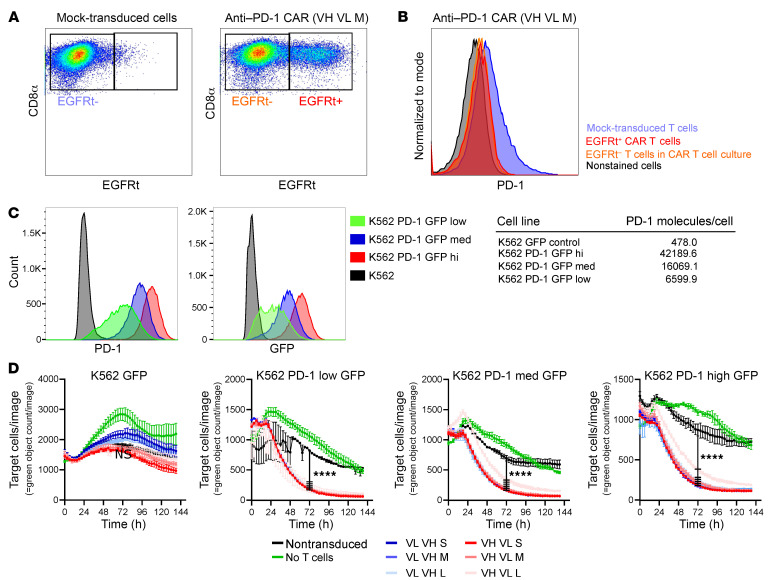
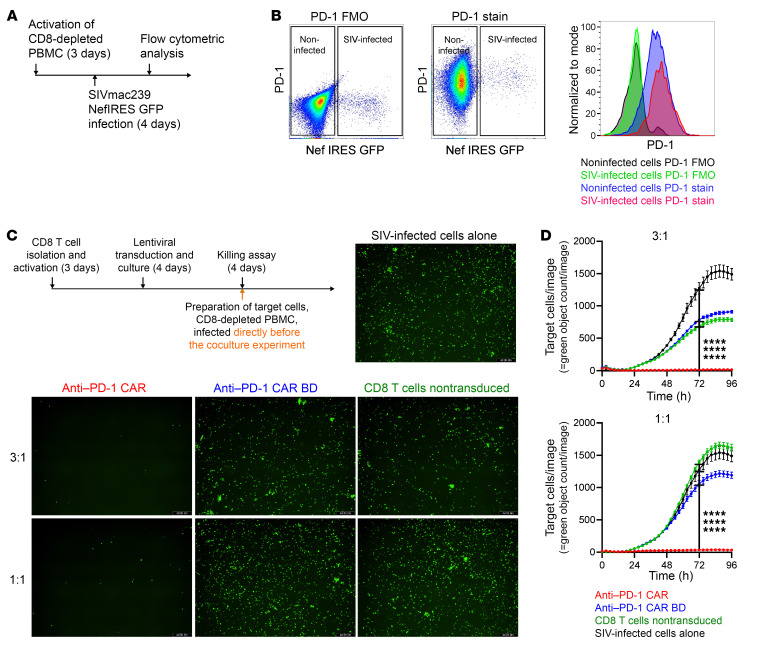
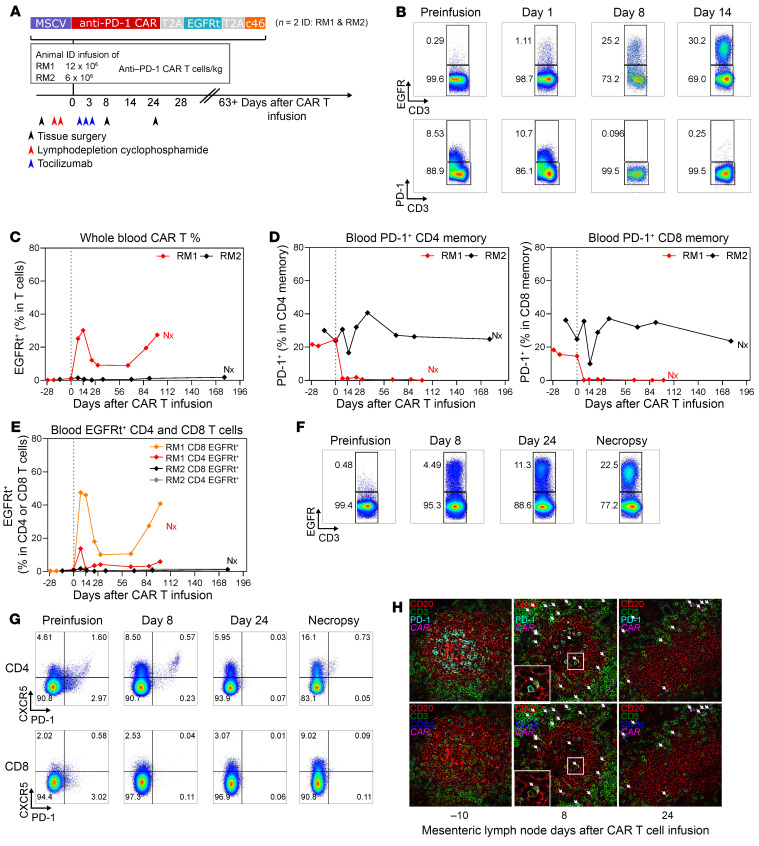
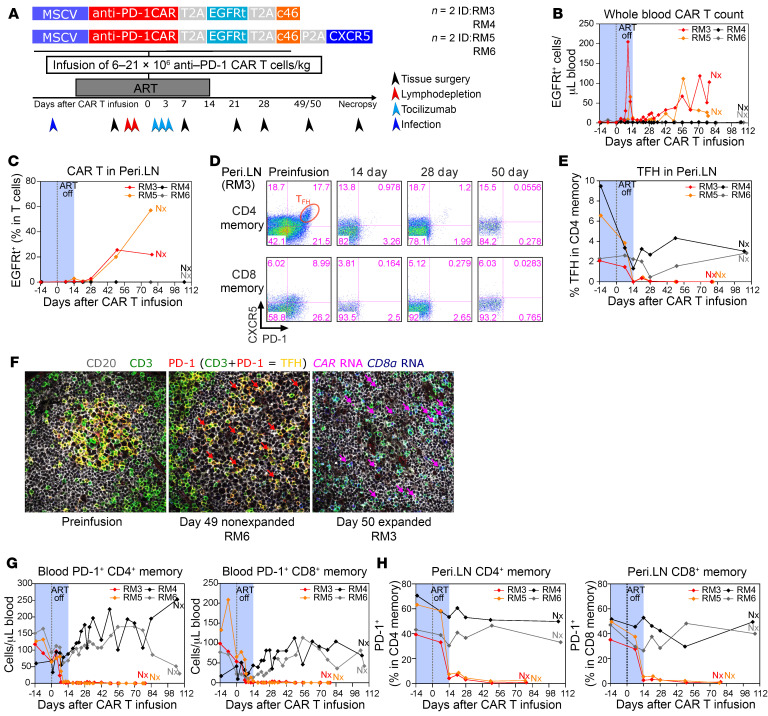
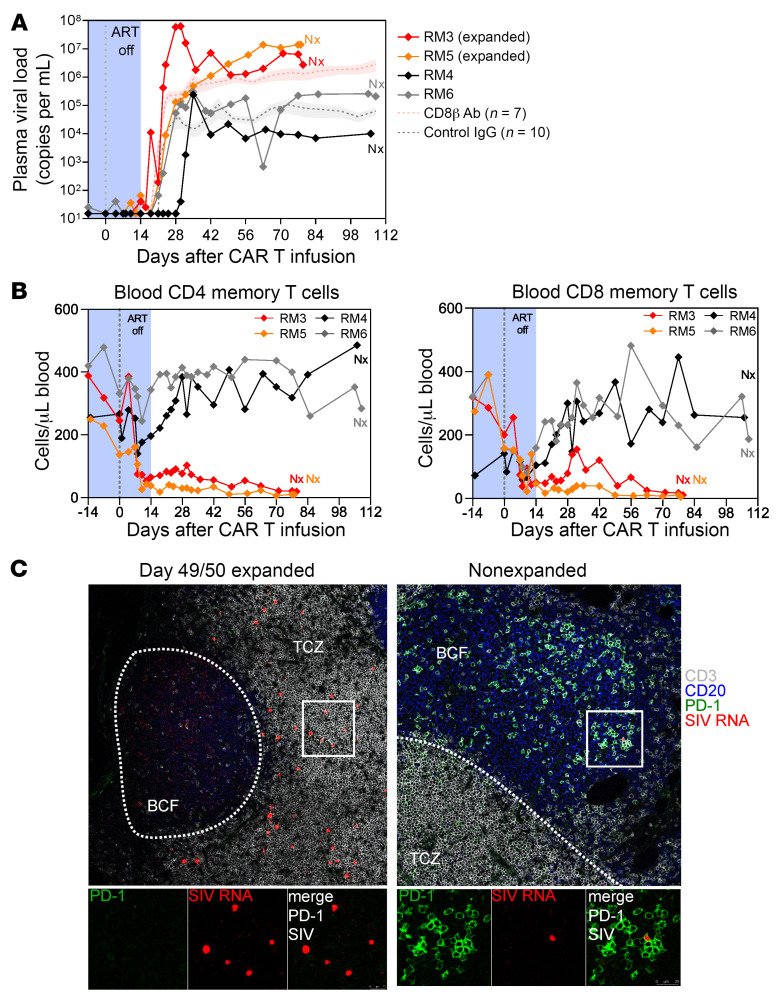
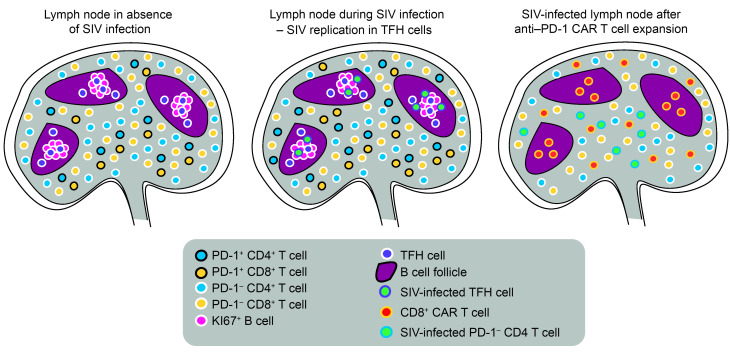
Programmed cell death protein 1 (PD-1) is an immune checkpoint marker commonly expressed on memory T cells and enriched in latently HIV-infected CD4+ T cells. We engineered an anti-PD-1 chimeric antigen receptor (CAR) to assess the impact of PD-1 depletion on viral reservoirs and rebound dynamics in SIVmac239-infected rhesus macaques (RMs). Adoptive transfer of anti-PD-1 CAR T cells was done in 2 SIV-naive and 4 SIV-infected RMs on antiretroviral therapy (ART). In 3 of 6 RMs, anti-PD-1 CAR T cells expanded and persisted for up to 100 days concomitant with the depletion of PD-1+ memory T cells in blood and tissues, including lymph node CD4+ follicular helper T (TFH) cells. Loss of TFH cells was associated with depletion of detectable SIV RNA from the germinal center (GC). However, following CAR T infusion and ART interruption, there was a marked increase in SIV replication in extrafollicular portions of lymph nodes, a 2-log higher plasma viremia relative to controls, and accelerated disease progression associated with the depletion of CD8+ memory T cells. These data indicate anti-PD-1 CAR T cells depleted PD-1+ T cells, including GC TFH cells, and eradicated SIV from this immunological sanctuary.

Keywords: AIDS/HIV; Gene therapy; Immunotherapy; T cells; Therapeutics.


Conflict of interest statement

Conflict of interest: Karsten Eichholz and Lawrence Corey are inventors on a provisional patent application (application 63/488,113) that describes anti–PD-1 CAR and its uses.

Figures

Figure 1
Figure 1. Primary anti–PD-1 CAR T cells do not express PD-1 and kill PD-1–expressing cells.
RM CD8+ T cells transduced with the 6 anti–PD-1 CAR and analyzed by flow cytometry express EGFRt as a surrogate marker for the CAR (A). Gating on EGFRt+ and EGFRt cells in the culture revealed a loss of PD-1 expression on CAR T and bystander cells in CAR T cells in comparison with nontransduced T cells (B). PD-1+ target cells were generated by transduction of K562 cells with a PD-1 GFP fusion protein–expressing lentivirus followed by sorting for different levels of PD-1 cell-surface expression. PD-1 cell–surface expression was quantified with Quantibrite beads and anti–PD-1 antibody EH12 2H7 (C). Anti–PD-1 CAR T cells kill PD-1+ target cells. Primary anti–PD-1 CAR CD8+ T cells or nontransduced CD8+ T cells were cocultured with K562 PD1 GFP with low, medium, and high PD-1 expression or K562-GFP control target cells at a 1:1 ratio. Cytotoxicity was measured by reduction of GFP+ cells using the IncuCyte Live-Cell Imaging System. Average cytotoxicity ± SEM of 1 representative experiment is shown (n = 3). Statistics were analyzed using 2-way ANOVA with Tukey’s multiple-comparisons test at each time point. Results for 72 hours are reported. ****P < 0.0001 (D).
Figure 2
Figure 2. Anti–PD-1 CAR T cells attenuate SIV infection in vitro.
Schematic of the production of the infection of CD8-depleted PBMCs with SIVmac239 NefIRESGFP (A). PD-1 expression on infected and noninfected cells after 4 days of infection (n = 3). Shown are fluorescence minus one (FMO) controls for PD-1 and full staining samples (B). Anti–PD-1 CAR T cells prevent viral outgrowth. Schematic showing the time line of preparation of effector cells and autologous CD4+ T cells as target cells infected with SIVmac239 NefIRESGFP directly before the experiment. Cytotoxicity was measured by reduction of GFP+ cells using the IncuCyte Live Cell Imaging System. Representative images at the end of the 96 hours of coculture with effector cells at the indicated E:T ratio (n = 3) (C). Original magnification, ×10. Quantification of GFP+ cells in the images acquired over 96 hours in the killing assay described in C (D). Average cytotoxicity ± SEM of 1 representative experiment is shown. Statistics were analyzed using 2-way ANOVA with Tukey’s multiple-comparisons test at each time point. Results for 72 hours are reported. ****P < 0.0001.
Figure 3
Figure 3. Anti–PD-1 CAR T cells expand in vivo and deplete PD-1+ CD4+ and CD8+ T cells in an SIV-naive RM.
Schematic of the in vivo animal study in SIV-naive RMs (n = 2). Dates for tissue surgery, lymphodepletion, and tocilizumab treatment are noted (A). EGFRt and PD-1 cell marking in total CD3+ T cells in vivo at days 8 and 14 indicates robust expansion of anti-PD1 CAR T cells in RM1 (B). Longitudinal PBMC sampling in RM1 and RM2 for percentages of total CAR T cells in CD3+ T cells (C) and PD-1+ in CD4+ and CD8+ T cells (D). Nx, necropsy. Flow cytometric analysis of EGFR+ CD4+ or CD8+ CAR T cells in peripheral blood in RM1 (E). Expansion of CAR T cells in Peri.LN of RM1 (F). Depletion of PD-1–expressing TFH cells in LNs was assessed by flow cytometry (G). Combined multicolor IHC and RNA FISH for CD3 (green), CD20 (red), PD-1, CD8α RNA (blue), and CAR RNA (cyan) on B cell follicles of mes.LNs on days –10, 8, and 24 relative to infusion. White arrows indicate the location of anti–PD-1 CAR CD8+ T cells (H). Original magnification, ×40.
Figure 4
Figure 4. Anti–PD-1 CAR T cells deplete PD-1+ T cells in SIV-infected RMs on ART.
Schematic of the in vivo animal study (n = 4). Dates for tissue surgery, lymphodepletion, duration of ART, and tocilizumab treatment are noted (A). Absolute count of EGFRt-expressing CD3+ T cells in peripheral blood for the duration of the study (B). Longitudinal EGFRt-expressing CD3+ T cells in peri.LN. (C). Flow cytometric analysis of PD-1 and CXCR5 expression on CD4+ and CD8+ total memory T cells in Peri.LN from RM3 (D). Frequency of TFH cells in CD4+ total memory T cells (E). Combined immunofluorescence and RNA FISH staining on LN tissue section for CD20 (gray), CD3 (green), PD-1 (red), CD8α RNA (blue), and CAR RNA (magenta) (F). Magenta arrows point to intrafollicular CD8+ CAR T cells, and red arrows point to residual TFH cells after infusion. TFH cells are characterized by CD3 and PD-1 dual staining within the B cell follicle and appear yellow (F). Original magnification, ×40. Absolute count of PD-1+ CD4+ and CD8+ memory T cells in peripheral blood (G). PD-1 expression on Peri.LN CD4+ memory T cells and CD8+ memory T cells (H).
Figure 5
Figure 5. Anti–PD-1 CAR T cell–mediated depletion of TFH cells and PD-1+ T cells does not prevent viral recrudescence after removal of ART.
Plasma viral load in the 4 animals during anti–PD-1 CAR T cell treatment and after removal of ART. Historical controls are shown for the indicated number of RMs as mean (+SEM) (A). Absolute count of CD4+ memory and CD8+ memory T cells in blood (B). Combined immunofluorescence and RNA FISH staining on LN tissue section for CD3 (gray), CD20 (blue), PD-1 (green), and SIV RNA (red). The white line demarcates the border between the T cell zone (TCZ) and the B cell follicle (BCF) (C). Original magnification, ×40.
Figure 6
Figure 6. Effects of anti–PD-1 CAR T cells in SIV-infected RMs.
At steady state, TFH cells are localized in B cell follicles, where they support B cell responses. Extrafollicular PD-1–expressing T cells are part of the memory compartment or have been recently exposed to antigen. During lentiviral infection, there is an increase of TFH cells, extrafollicular PD-1+ CD4+ and CD8+ T cells, and viral replication occurring predominantly in TFH cells. During successful expansion, anti–PD-1 CAR T cells enter lymphoid tissues and kill extrafollicular PD-1+ T cells as well as TFH cells in the follicles. This results in relatively lower viral replication in the follicles due to depletion of TFH cells and increases viral replication in the extrafollicular T cell zone where it occurs in PD-1 CD4+ T cells. SIV-specific T cells are likely part of the extrafollicular PD-1+ T cell population and are lost due to depletion of anti–PD-1 CAR T cells. Over time, this leads to anti–PD-1 CAR T cell–mediated immunodeficiency.

References

    1. Ndung’u T, et al. Why and where an HIV cure is needed and how it might be achieved. Nature. 2019;576(7787):397–405. doi: 10.1038/s41586-019-1841-8. - DOI - PMC - PubMed
    1. Beacroft L, Hallett TB. The potential impact of a “curative intervention” for HIV: a modelling study. Glob Heal Res Policy. 2019;4:18. doi: 10.1186/s41256-019-0107-1. - DOI - PMC - PubMed
    1. Pantaleo G, et al. HIV infection is active and progressive in lymphoid tissue during the clinically latent stage of disease. Nature. 1993;362(6418):355–358. doi: 10.1038/362355a0. - DOI - PubMed
    1. Pantaleo G, et al. Lymphoid organs function as major reservoirs for human immunodeficiency virus. Proc Natl Acad Sci U S A. 1991;88(21):9838–9842. doi: 10.1073/pnas.88.21.9838. - DOI - PMC - PubMed
    1. Fukazawa Y, et al. B cell follicle sanctuary permits persistent productive simian immunodeficiency virus infection in elite controllers. Nat Med. 2015;21(2):132–139. doi: 10.1038/nm.3781. - DOI - PMC - PubMed

MeSH terms

Substances