Observational Study
. 2024 Apr 1;134(7):e168318.
doi: 10.1172/JCI168318.

Soluble immune checkpoint factors reflect exhaustion of antitumor immunity and response to PD-1 blockade

Affiliations
Observational Study

Soluble immune checkpoint factors reflect exhaustion of antitumor immunity and response to PD-1 blockade

Hidetoshi Hayashi et al. J Clin Invest. .

Abstract

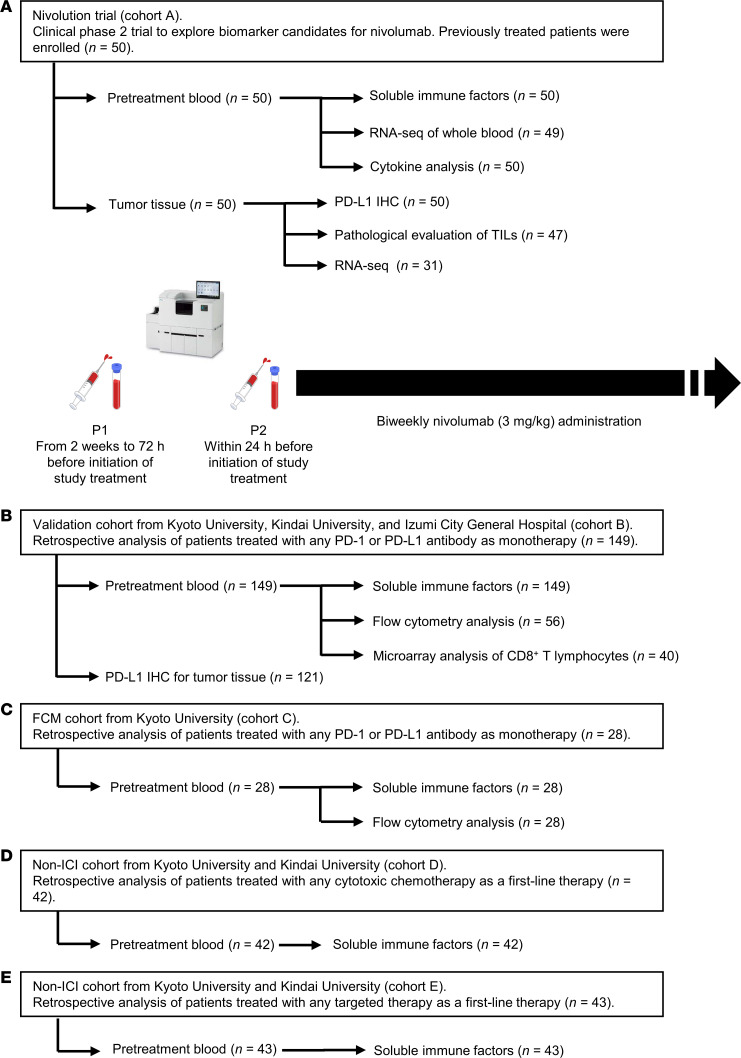
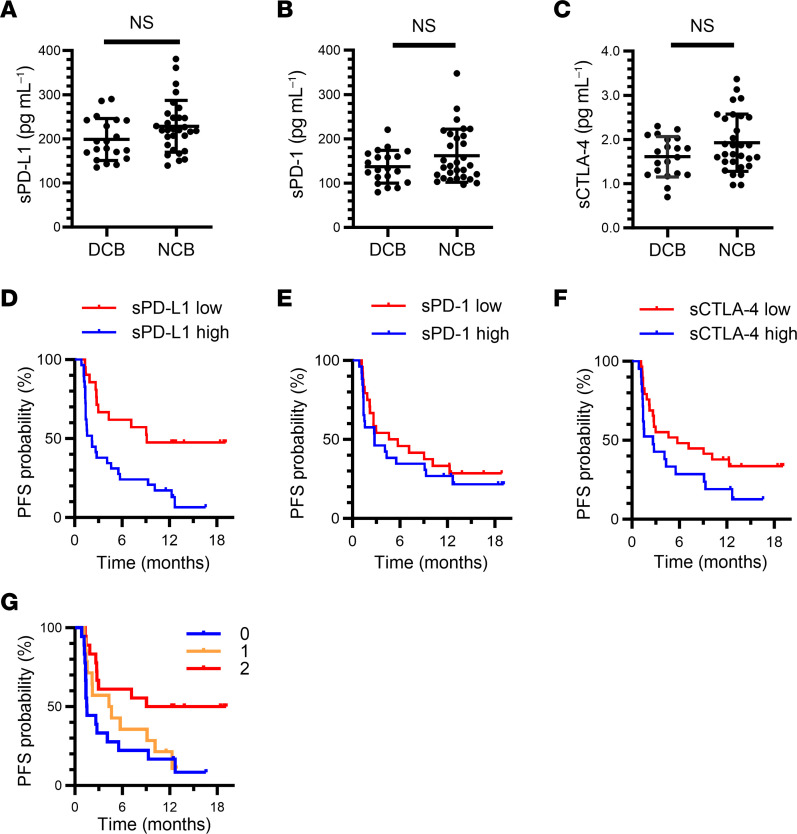
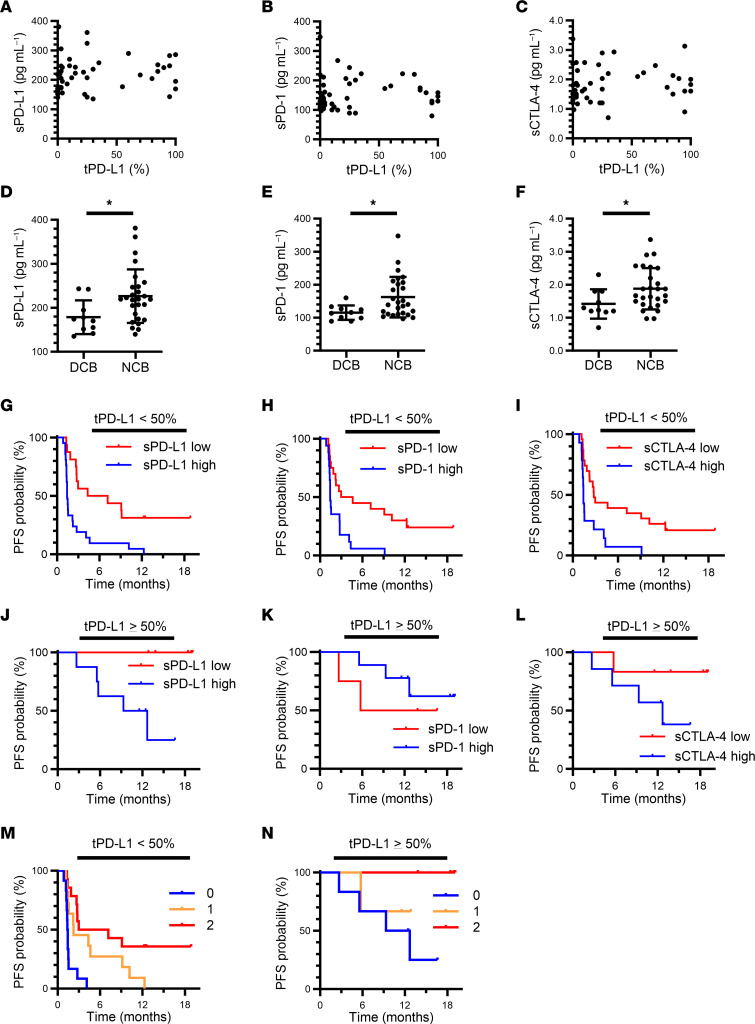
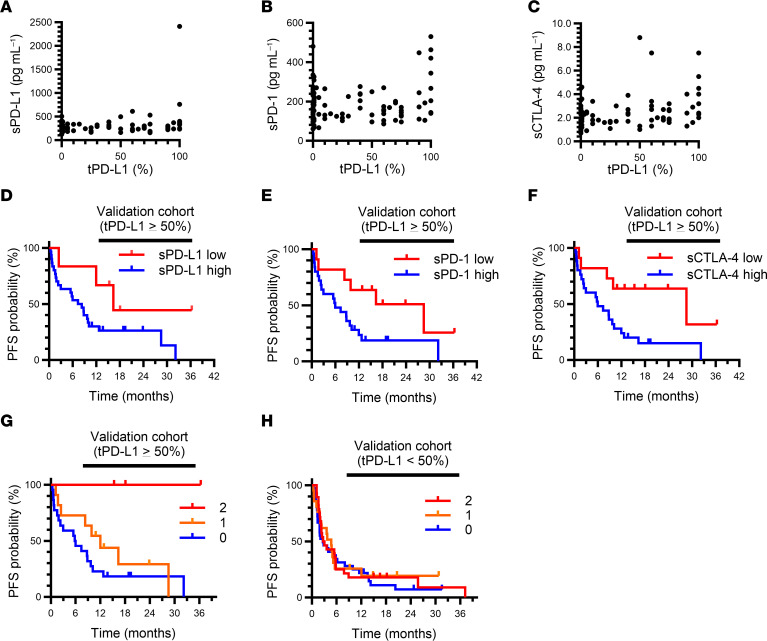
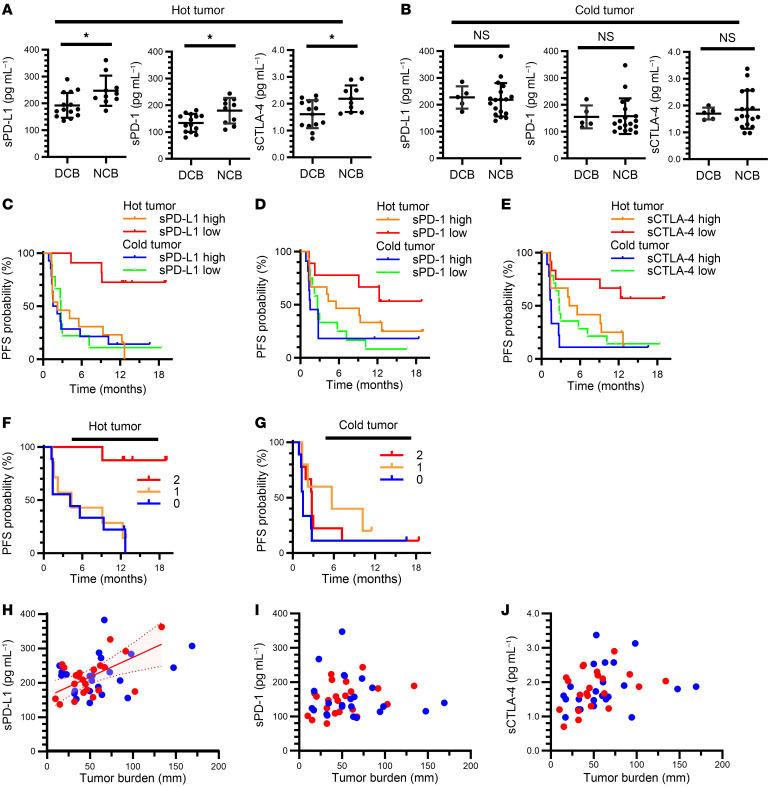
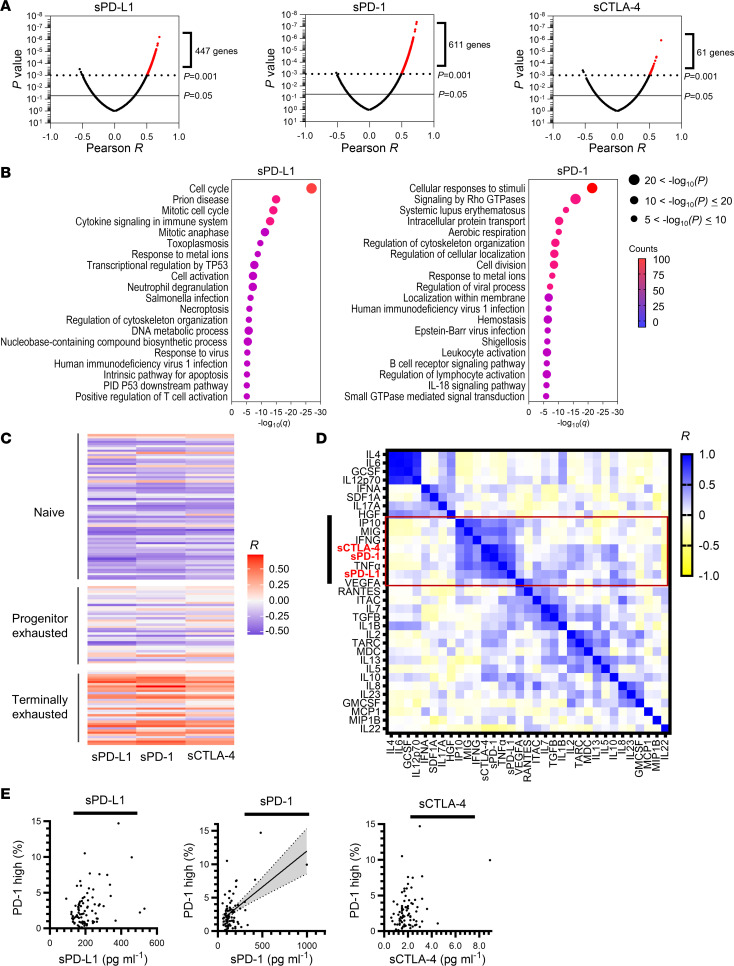
BACKGROUNDPrecise stratification of patients with non-small cell lung cancer (NSCLC) is needed for appropriate application of PD-1/PD-L1 blockade therapy.METHODSWe measured soluble forms of the immune-checkpoint molecules PD-L1, PD-1, and CTLA-4 in plasma of patients with advanced NSCLC before PD-1/PD-L1 blockade. A prospective biomarker-finding trial (cohort A) included 50 previously treated patients who received nivolumab. A retrospective observational study was performed for patients treated with any PD-1/PD-L1 blockade therapy (cohorts B and C), cytotoxic chemotherapy (cohort D), or targeted therapy (cohort E). Plasma samples from all patients were assayed for soluble immune-checkpoint molecules with a highly sensitive chemiluminescence-based assay.RESULTSNonresponsiveness to PD-1/PD-L1 blockade therapy was associated with higher concentrations of these soluble immune factors among patients with immune-reactive (hot) tumors. Such an association was not apparent for patients treated with cytotoxic chemotherapy or targeted therapy. Integrative analysis of tumor size, PD-L1 expression in tumor tissue (tPD-L1), and gene expression in tumor tissue and peripheral CD8+ T cells revealed that high concentrations of the 3 soluble immune factors were associated with hyper or terminal exhaustion of antitumor immunity. The combination of soluble PD-L1 (sPD-L1) and sCTLA-4 efficiently discriminated responsiveness to PD-1/PD-L1 blockade among patients with immune-reactive tumors.CONCLUSIONCombinations of soluble immune factors might be able to identify patients unlikely to respond to PD-1/PD-L1 blockade as a result of terminal exhaustion of antitumor immunity. Our data suggest that such a combination better predicts, along with tPD-L1, for the response of patients with NSCLC.TRIAL REGISTRATIONUMIN000019674.FUNDINGThis study was funded by Ono Pharmaceutical Co. Ltd. and Sysmex Corporation.

Keywords: Immunotherapy; Lung cancer; Oncology; T cells.


Figures

Figure 1
Figure 1. Overview of patient cohorts and analyses included in the study.
(A) In a prospective trial to identify biomarker candidates for nivolumab treatment (Nivolution trial), a total 50 patients with advanced or recurrent NSCLC previously treated with any systemic therapy (cohort A) was analyzed. (B) Retrospective analysis of 149 patients with advanced or recurrent NSCLC who received monotherapy with any PD-1 or PD-L1 inhibitor in the first- or later-line setting (cohort B). Flow cytometry (FCM) and microarray analysis of gene expression were performed for peripheral CD8+ T cells from 56 and 40 patients, respectively, enrolled at Kyoto University Hospital, which was previously reported (27) (C) Retrospective analysis of patients who underwent more than 1 line of systemic therapy before ICI treatment at Kyoto University Hospital (cohort C) (27) (D and E) Retrospective analysis of 42 and 43 patients with advanced or recurrent NSCLC who received cytotoxic chemotherapy (cohort D) or targeted therapy (cohort E) in the first-line setting, respectively.
Figure 2
Figure 2. Combination of circulating soluble immune factors allows stratification of patients with advanced NSCLC in the Nivolution trial according to responsiveness to nivolumab.
(AC) Comparison of pretreatment plasma concentrations of sPD-L1 (A), sPD-1 (B), and sCTLA-4 (C) between patients with a DCB (n = 20) or NCB (n = 30). Mean ± SD values are indicated; Mann-Whitney U test. (DF) Kaplan-Meier curves for PFS of patients with high or low concentrations of each soluble immune factor based on the determined cutoff values. For D, the sPD-L1 cutoff was 205 pg/mL (high, n = 29; low, n = 21), and the median PFS was 9.1 versus 2.2 months for low and high sPD-L1, respectively (log-rank P = 0.002), with an HR of 0.35 (95% CI, 0.18–0.68). For E, the sPD-1 cutoff was 135 pg/mL (high, n = 26; low, n = 24), and the median PFS was 5.2 versus 2.8 months for low and high sPD-1, respectively (log-rank P = 0.459), with an HR of 0.78 (95% CI, 0.41–1.50). For F, the sCTLA-4 cutoff was 1.85 pg/mL (high, n = 21; low, n = 29), and the median PFS was 5.7 versus 2.7 months for low and high sCTLA-4, respectively (log-rank P = 0.074), with an HR of 0.54 (95% CI, 0.27–1.06). (G) Kaplan-Meier curves for PFS among patients according to the number of favorable immune factors defined as sCTLA-4 or sPD-L1 levels below the cutoff values (log-rank P = 0.015). Median PFS was 14.1, 4.5, and 1.5 months for 2, 1, and 0 favorable factors, respectively. The HR for 1 (n = 14) versus 0 (n = 18) was 0.72 (95% CI, 0.34–1.53), and that for 2 (n = 18) versus 0 was 0.31 (95% CI, 0.14–0.72).
Figure 3
Figure 3. Soluble immune factors complement the predictive ability of tPD-L1 expression for advanced NSCLC patients treated with nivolumab in the Nivolution trial.
(AC) Pearson correlation analysis for pretreatment plasma concentrations of sPD-L1 (A), sPD-1 (B), sCTLA-4 (C), and tPD-L1 expression level (PD-L1 TPS) (n = 50). (DF) Comparison of sPD-L1 (D), sPD-1 (E), and sCTLA-4 (F) concentrations between patients with a DCB (n = 10) or NCB (n = 27) among individuals with a tPD-L1 expression level of < 50%. *P < 0.05 (Mann-Whitney U test). (GI) Kaplan-Meier curves for PFS of patients with a tPD-L1 expression level of < 50% according to high or low levels of each soluble immune factor based on the determined cutoff values. For sPD-L1 (high, n = 21; low, n = 16), median PFS was 8.7 versus 2.7 months for low and high sPD-L1, respectively (log-rank P = 0.001), with an HR of 0.30 (95% CI, 0.14–0.64) (G). For sPD-1 (high, n = 20; low, n = 17), median PFS was 7.8 versus 2.4 months for low and high sPD-1, respectively (log-rank P = 0.003), with an HR of 0.34 (95% CI, 0.16–0.71) (H). For sCTLA-4 (high, n = 14; low, n = 23), median PFS was 7.1 versus 2.4 months for low and high sCTLA-4, respectively (log-rank P = 0.004), with an HR of 0.36 (95% CI, 0.17–0.75) (I). (JL) Kaplan-Meier curves for PFS of patients with a tPD-L1 expression level of ≥ 50% according to high or low levels of each soluble immune factor based on the determined cutoff values. For sPD-L1 (high, n = 8; low, n = 5), median PFS was not reached versus 11.0 months for low and high sPD-L1, respectively (log-rank P = 0.023), with an HR of 0.01 (95% CI, 0.00–19.61) (J). For sPD-1 (high, n = 8; low, n = 5), median PFS was 5.7 months versus not reached for low and high sPD-1, respectively (log-rank P = 0.49), with an HR of 1.88 (95% CI, 0.31–11.32) (K). For sCTLA-4 (high, n = 7; low, n = 6), median PFS was not reached versus 12.7 months for low and high sCTLA-4, respectively (log-rank P = 0.16), with an HR of 0.23 (95% CI, 0.03–2.14) (L). (M and N) Kaplan-Meier curves for PFS among patients with tPD-L1 expression levels of < 50% (M) or ≥ 50% (N) according to the number of favorable immune factors defined as sCTLA-4 or sPD-L1 concentrations below the cutoff values (log-rank P = 0.0002 and 0.18, respectively). Median PFS was 5.1, 2.2, and 1.4 months for 2, 1, and 0 favorable factors, respectively, in (M), and not reached, not reached, and 11.0 months, respectively, in (N). The HR for 1 (n = 11 and 3) versus 0 (n = 12 and 6) was 0.28 (95% CI, 0.10–0.76) and 0.44 (95% CI, 0.05–3.97), and that for 2 (n = 14 and 4) versus 0 was 0.20 (95% CI, 0.10–0.76) and 0.01 (95% CI, 0.00–45.45), in (M) and (N), respectively.
Figure 4
Figure 4. Soluble immune factors stratify advanced NSCLC patients with a tPD-L1 expression level of ≥ 50% according to responsiveness to PD-1/PD-L1 blockade therapy in the validation cohort (cohort B).
(AC) Pearson correlation analysis of pretreatment plasma concentrations of sPD-L1 (A), sPD-1 (B), or sCTLA-4 (C) and tPD-L1 expression level (n = 121 patients). (DF) Kaplan-Meier curves for PFS of patients with a tPD-L1 expression level of ≥ 50% according to high or low levels of soluble immune factors based on the determined cutoff values. For sPD-L1 (high, n = 30; low, n = 6), median PFS was 16.4 versus 7.4 months for low and high sPD-L1, respectively (log-rank P = 0.080), with an HR of 0.35 (95% CI, 0.11–1.19) (D). For sPD-1 (high, n = 25; low, n = 11), median PFS was 28.6 versus 6.0 months for low and high sPD-1, respectively (log-rank P = 0.035), with an HR of 0.38 (95% CI, 0.15–0.97) (E). For sCTLA-4 (high, n = 25; low, n = 11), median PFS was 28.6 versus 6.0 months for low and high sCTLA-4, respectively (log-rank P = 0.017), with an HR of 0.32 (95% CI, 0.12–0.86) (F). (G and H) Kaplan-Meier curves for PFS among patients with a tPD-L1 expression level of ≥ 50% (G) or < 50% (H) according to the number of favorable immune factors defined as concentrations of sCTLA-4 or sPD-L1 below the cutoff values (log-rank P = 0.028 and 0.57, respectively). Median PFS was not reached, 11.0 months, and 5.9 months for 2, 1, and 0 favorable factors, respectively, in G, and 2.9, 4.7, and 2.7 months, respectively, in H. The HR for 1 (n = 11 and 21) versus 0 (n = 22 and 36) was 0.61 (95% CI, 0.26–1.41) and 0.84 (95% CI, 0.46–1.54), and that for 2 (n = 3 and 28) versus 0 was 0.03 (95% CI, 0.00–3.43) and 0.88 (95% CI, 0.52–1.50), in (G) and (H), respectively.
Figure 5
Figure 5. Soluble immune factors efficiently stratify patients with hot tumors in the Nivolution trial.
(A and B) Comparison of pretreatment plasma concentrations of sPD-L1, sPD-1, or sCTLA-4 between patients with a DCB or NCB among individuals with hot (A) or cold (B) tumors defined by the number of CD8+ T cells infiltrated into tumor tissue (≥ 12.0 and < 12.0/field, respectively). DCB, n = 14 and 5; NCB, n = 10 and 18 for hot and cold tumors, respectively. *P < 0.05; Mann-Whitney U test. (CE) Kaplan-Meier curves for PFS according to hot or cold tumor status and high or low soluble factor levels based on the determined cutoff values. For sPD-L1, 2-sided log-rank P = 0.0023 for comparison among the 4 groups, where n = 11 (sPD-L1 low) and 13 (sPD-L1 high) among hot tumors as well as n = 9 (low) and 14 (high) among cold tumors; and median PFS was not reached, 2.2 months, 2.8 months, and 1.9 months, respectively (C). For sPD-1, 2-sided log-rank P = 0.055; n = 9 (sPD-1 low) and 15 (sPD-1 high) among hot tumors as well as n = 12 (low) and 11 (high) among cold tumors; and median PFS was not reached, 5.6 months, 2.7 months, and 1.5 months, respectively (D). For sCTLA-4, 2-sided log-rank P = 0.0093; n = 12 (sCTLA-4 low) and 12 (sCTLA-4 high) among hot tumors as well as n = 14 (low) and 9 (high) among cold tumors; and median PFS was not reached, 4.9 months, 2.8 months, and 1.5 months, respectively (E). (F and G) Kaplan-Meier curves for PFS of patients with hot (F) or cold (G) tumors according to the number of favorable immune factors defined as concentrations of sCTLA-4 or sPD-L1 below the cutoff values (2-sided log-rank P = 0.0034 and 0.30, respectively). Median PFS was not reached, 4.3 months, and 4.1 months for 2, 1, and 0 favorable factors, respectively, for hot tumors (F), and was 2.8, 5.7, and 1.5 months, respectively, for cold tumors (G). The HR for 1 (n = 7 and 5) versus 0 (n = 9 and 9) was 0.85 (95% CI, 0.29–2.44) and 0.46 (95% CI, 0.13–1.57), and that for 2 (n = 8 and 9) versus 0 was 0.07 (95% CI, 0.01–0.55) and 0.58 (95% CI, 0.21–1.56), for hot and cold tumors, respectively. (HJ) Pearson correlation analysis of tumor burden and plasma concentrations of sPD-L1 (H), sPD-1 (I), or sCTLA-4 (J) for hot (red) and cold (blue) tumors. Hot tumors in H show moderate linearity, with an R of 0.59 and P = 0.004. The red shaded area above and below the solid line and bounded by the dotted lines indicates the 95% CI.
Figure 6
Figure 6. Analysis of gene expression in peripheral CD8+ T cells and circulating cytokine levels.
(A) Volcano plots of Pearson correlation (x-axis) and significance (y-axis) for the expression of individual genes in peripheral CD8+ T cells as determined by microarray analysis and pretreatment plasma concentrations of sPD-L1, sPD-1, or sCTLA-4 in cohort B (validation cohort, n = 40 patients). (B) Enrichment analysis for genes whose expression was positively correlated with sPD-L1 (447 genes) or sPD-1 (611 genes) levels as shown in A at P values of < 0.001. The plots show the FDR (q) value (x-axis), adjusted P value (dot size), and gene counts (color). The number of correlated genes for sCTLA-4 was not sufficient for enrichment analysis. (C) Heat map of Pearson correlation between soluble immune factor concentrations and the expression of gene sets characteristic of naive, progenitor exhausted, or terminally exhausted CD8+ T cells as determined by microarray analysis as in A. (D) Correlation between the plasma concentrations of 30 cytokines as well as those of sPD-L1, sPD-1, and sCTLA-4 in 50 patients of cohort A (Nivolution trial). Hierarchical clustering was performed according to the concentrations of the cytokines and soluble immune factors. (E) Scatter plots of soluble immune factor levels and the frequency of PD-1hi CD8+ T cells in peripheral blood (n = 84 from cohorts B and C). A moderate correlation between sPD-1 levels and the frequency of PD-1hi CD8+ T cells was apparent, with an R value of 0.51 and P < 0.0001; the gray shaded area above and below the solid line and bounded by the dotted lines indicates the 95% CI.

Comment in

  • Soluble immune-checkpoint factors: a potential immunotherapy biomarker doi: 10.1172/JCI179352

References

    1. Topalian SL, et al. Safety, activity, and immune correlates of anti-PD-1 antibody in cancer. N Engl J Med. 2012;366(26):2443–2454. doi: 10.1056/NEJMoa1200690. - DOI - PMC - PubMed
    1. Brahmer J, et al. Nivolumab versus docetaxel in advanced squamous-cell non-small-cell lung cancer. N Engl J Med. 2015;373(2):123–135. doi: 10.1056/NEJMoa1504627. - DOI - PMC - PubMed
    1. Borghaei H, et al. Nivolumab versus docetaxel in advanced nonsquamous non-small-cell lung cancer. N Engl J Med. 2015;373(17):1627–1639. doi: 10.1056/NEJMoa1507643. - DOI - PMC - PubMed
    1. Robert C, et al. Nivolumab in previously untreated melanoma without BRAF mutation. N Engl J Med. 2015;372(4):320–330. doi: 10.1056/NEJMoa1412082. - DOI - PubMed
    1. Motzer RJ, et al. Nivolumab versus everolimus in advanced renal-cell carcinoma. N Engl J Med. 2015;373(19):1803–1813. doi: 10.1056/NEJMoa1510665. - DOI - PMC - PubMed

Publication types

MeSH terms