. 2024 Apr 1;19(4):e0300965.
doi: 10.1371/journal.pone.0300965. eCollection 2024.

Whole transcriptome sequencing analyses of islets reveal ncRNA regulatory networks underlying impaired insulin secretion and increased β-cell mass in high fat diet-induced diabetes mellitus

Affiliations

Whole transcriptome sequencing analyses of islets reveal ncRNA regulatory networks underlying impaired insulin secretion and increased β-cell mass in high fat diet-induced diabetes mellitus

Jinfang Ma et al. PLoS One. .

Abstract

Aim: Our study aims to identify novel non-coding RNA-mRNA regulatory networks associated with β-cell dysfunction and compensatory responses in obesity-related diabetes.

Methods: Glucose metabolism, islet architecture and secretion, and insulin sensitivity were characterized in C57BL/6J mice fed on a 60% high-fat diet (HFD) or control for 24 weeks. Islets were isolated for whole transcriptome sequencing to identify differentially expressed (DE) mRNAs, miRNAs, IncRNAs, and circRNAs. Regulatory networks involving miRNA-mRNA, lncRNA-mRNA, and lncRNA-miRNA-mRNA were constructed and functions were assessed through Gene Ontology (GO) and Kyoto Encyclopedia of Genes and Genomes (KEGG) enrichment analyses.

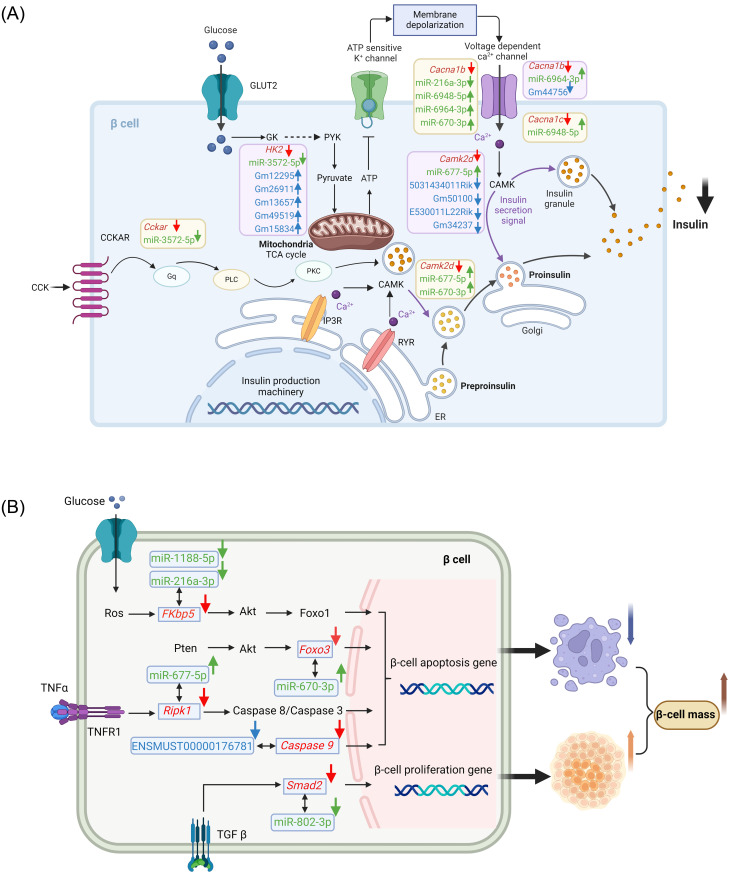
Results: Despite compensatory hyperinsulinemia and a significant increase in β-cell mass with a slow rate of proliferation, HFD mice exhibited impaired glucose tolerance. In isolated islets, insulin secretion in response to glucose and palmitic acid deteriorated after 24 weeks of HFD. Whole transcriptomic sequencing identified a total of 1324 DE mRNAs, 14 DE miRNAs, 179 DE lncRNAs, and 680 DE circRNAs. Our transcriptomic dataset unveiled several core regulatory axes involved in the impaired insulin secretion in HFD mice, such as miR-6948-5p/Cacna1c, miR-6964-3p/Cacna1b, miR-3572-5p/Hk2, miR-3572-5p/Cckar and miR-677-5p/Camk2d. Additionally, proliferative and apoptotic targets, including miR-216a-3p/FKBP5, miR-670-3p/Foxo3, miR-677-5p/RIPK1, miR-802-3p/Smad2 and ENSMUST00000176781/Caspase9 possibly contribute to the increased β-cell mass in HFD islets. Furthermore, competing endogenous RNAs (ceRNA) regulatory network involving 7 DE miRNAs, 15 DE lncRNAs and 38 DE mRNAs might also participate in the development of HFD-induced diabetes.

Conclusions: The comprehensive whole transcriptomic sequencing revealed novel non-coding RNA-mRNA regulatory networks associated with impaired insulin secretion and increased β-cell mass in obesity-related diabetes.


Conflict of interest statement

The authors have declared that no competing interests exist.

Figures

Fig 1
Fig 1. Glucose metabolism disorders and islet dysfunction of HFD mice.
(A) The average body weights of high-fat diet (HFD) and chow diet (CD) mice. (n≥ 23 mice /group). (B) The average serum insulin levels of HFD and CD mice. (n≥14 mice /group). (C-D) Blood glucose (C) and the corresponding plasma insulin concentration (D) during IPGTT. (n≥10 mice/group). (E) Blood glucose during IPITT. (N≥20 mice/group). (F) Insulin secretion in islets isolated from HFD and CD mice. (n = 7 samples/group, n = 3–4 mice/group). (G) Representative immunofluorescence staining of pancreatic islets from HFD and CD mice. Red indicates glucagon-positive cells, and green indicates insulin-positive cells. (H) Islet size distributions analyzed by morphometry (N = 4 mice/group). (I) Representative immunofluorescence staining showing Ki67+ Ins+ cells in pancreatic sections. Red indicates insulin-positive cells, and green indicates Ki67-positive cells. (J) Quantification of the percentage of Ki67+ Ins+ cells in total Ins+ cells. (n = 9 islets/group, n = 3 mice/group). (K) Apoptotic signals at the pancreatic islets of HFD and CD mice. Green indicates insulin-positive cells, and red indicates apoptosis signals detected by the TUNEL method. (L) Quantification of the percentage TUNEL+ apoptotic cell in total Ins+ cells. (n = 5 islets/group, n = 3 mice/group). Data presented as mean ± SEM. *p<0.05, **p<0.01, ***p<0.005, **** p<0.001.
Fig 2
Fig 2. The expressional pattern and function analysis of differentially expressed mRNAs from HFD and CD islets.
(A) Schematic of the experimental design for whole transcriptome sequencing. Created with BioRender.com. (B) A volcano plot of the DEMs between the HFD and CD groups. The numbers of upregulated (red dots) and downregulated (blue dots) genes are marked in the graph. (C) Heatmap and hierarchical clustering analyses of the 1324 differentially expressed mRNAs. (D) Random selection of 6 DEMs for the validation of islet transcriptomic data. Data presented as mean ± SEM. *p<0.05, **p<0.01. (E) COG function classification of the DEMs. (F) GO enrichment analysis of DEMs. (G) KEGG enrichment analysis of DEMs. Abbreviations: DEMs, differentially expressed mRNAs; COG, Cluster of Orthologous Groups; GO, gene ontology; KEGG, Kyoto Encyclopedia of Genes and Genomes.
Fig 3
Fig 3. Novel miRNA target identification and function analysis from HFD and CD islets.
(A-B) Differentially expressed miRNAs were exhibited by volcanoplot and clustering analysis. (C) miRNAs-mRNAs regulatory network analysis of DE miRNAs and DE mRNAs. The diamond represents DE miRNAs, and ellipses represent DE mRNAs. Target mRNAs associated with key pathways have been color-coded for clarity: red for pancreatic secretion pathway; blue for type 2 diabetes mellitus pathway; yellow for calcium signaling pathway. To denote involvement in multiple pathways, mRNAs are marked green if they participate in both calcium signaling and type 2 diabetes mellitus pathways, orange for those involved in calcium signaling and insulin secretion pathways, pink for mRNAs implicated in all three pathways (calcium signaling, type 2 diabetes mellitus, and insulin secretion), and brown for targets participating in pancreatic secretion, calcium signaling, and insulin secretion pathways. (D) GO enrichment analysis of DE miRNAs-targeted DE mRNAs. (E) KEGG enrichment analysis of DE miRNAs-targeted DE mRNAs.
Fig 4
Fig 4. Identification and function analysis of cis target genes of DE lncRNAs in islets.
(A-B) Differentially expressed lncRNAs were exhibited by volcanoplot and clustering analysis. (C) LncRNA-cis target genes regulatory network analysis of DE lncRNAs and DE mRNAs. The diamond represents DE lncRNAs, and ellipses represent their corresponding differentially expressed potential cis target genes. (D) GO enrichment analysis of the corresponding differentially expressed potential cis target genes of DE lncRNAs. (E) KEGG enrichment analysis of the corresponding differentially expressed potential cis target genes of DE lncRNAs.
Fig 5
Fig 5. The ceRNA network of lncRNAs–miRNAs–mRNAs and its functional analysis.
(A) Sankey diagram for the ceRNA network in islets. Each rectangle represents a gene, and the connection degree of each gene is displayed based on the size of the rectangle. (B) A ceRNA visual network including 38 DE mRNAs, 15 DE lncRNAs, and 7 DE miRNAs. The diamond represents DE miRNAs, ellipses represent DE mRNAs, and triangles represent DE lncRNAs. (C) GO enrichment analysis of the DE mRNAs in ceRNA network. (D) KEGG enrichment analysis of the DE mRNAs in ceRNA network.
Fig 6
Fig 6. Pathway dynamics of islets during diabetes progression.
(A) The schematic representation illustrating the physiology and key ceRNAs involved in impaired insulin secretion of HFD β-cell. mRNAs are colored in red, miRNAs are colored in green, and lncRNAs are colored in blue. The expression change in HFD mice were indicated with arrows. Created with BioRender.com. (B) The diagrammatic representation depicted an overview of LncRNA/miRNA-mRNA change toward increased β-cell mass of HFD mice. mRNAs are colored in red, miRNAs are colored in green, and lncRNA is colored in blue. The expression change in HFD mice were indicated with arrows. Created with BioRender.com.

Similar articles

References

    1. Galicia-Garcia U, Benito-Vicente A, Jebari S, Larrea-Sebal A, Siddiqi H, Uribe KB, et al.. Pathophysiology of Type 2 Diabetes Mellitus. International journal of molecular sciences. 2020;21(17). Epub 2020/09/03. doi: 10.3390/ijms21176275 - DOI - PMC - PubMed
    1. Khan MAB, Hashim MJ, King JK, Govender RD, Mustafa H, Al Kaabi J. Epidemiology of Type 2 Diabetes—Global Burden of Disease and Forecasted Trends. J Epidemiol Glob Health. 2020;10(1):107–11. Epub 2020/03/17. doi: 10.2991/jegh.k.191028.001 - DOI - PMC - PubMed
    1. Matsumura Y, Wei FY, Sakai J. Epitranscriptomics in metabolic disease. Nat Metab. 2023;5(3):370–84. doi: 10.1038/s42255-023-00764-4 - DOI - PubMed
    1. Coppedè F, Franzago M, Giardina E, Nigro CL, Matullo G, Moltrasio C, et al.. A perspective on diet, epigenetics and complex diseases: where is the field headed next? Epigenomics. 2022;14(20):1281–304. doi: 10.2217/epi-2022-0239 - DOI - PubMed
    1. Abdul-Ghani M, DeFronzo RA. Insulin Resistance and Hyperinsulinemia: the Egg and the Chicken. J Clin Endocrinol Metab. 2021;106(4):e1897–e9. Epub 2021/02/02. doi: 10.1210/clinem/dgaa364 - DOI - PMC - PubMed