. 2024 Apr 1;147(1):65.
doi: 10.1007/s00401-024-02704-2.

Landscape of brain myeloid cell transcriptome along the spatiotemporal progression of Alzheimer's disease reveals distinct sequential responses to Aβ and tau

Affiliations

Landscape of brain myeloid cell transcriptome along the spatiotemporal progression of Alzheimer's disease reveals distinct sequential responses to Aβ and tau

Astrid Wachter et al. Acta Neuropathol. .

Abstract

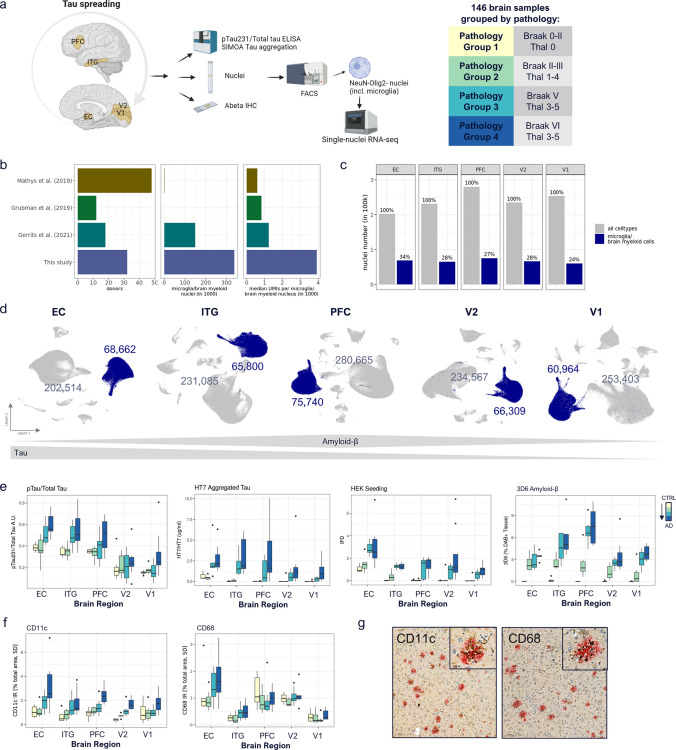
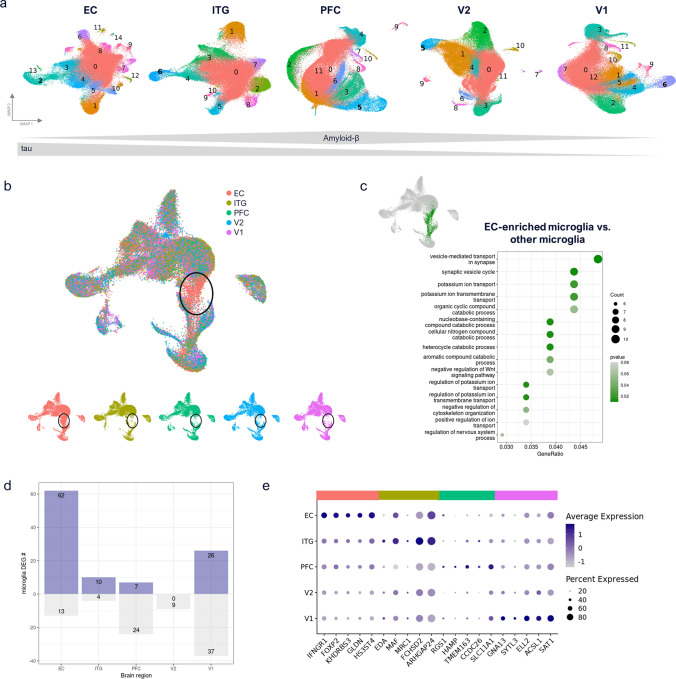
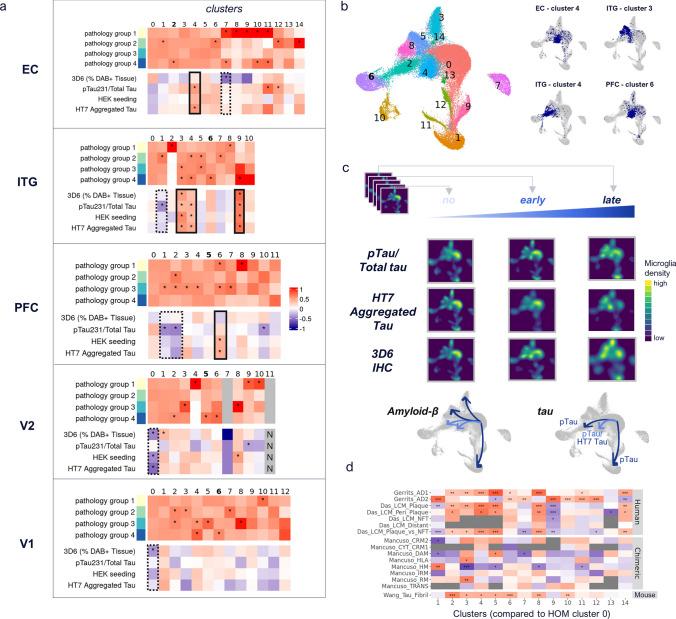
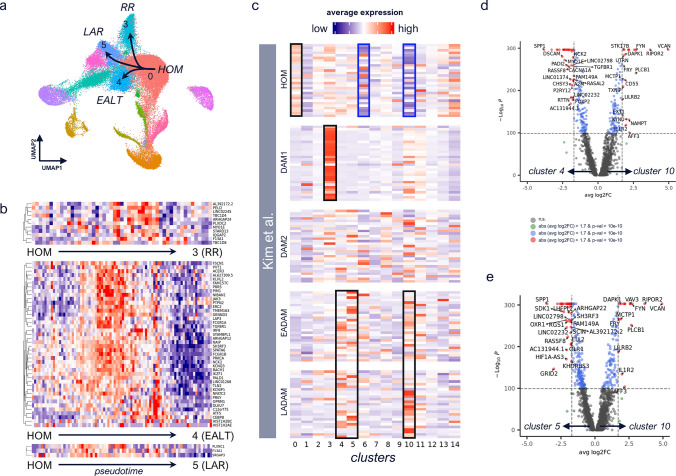
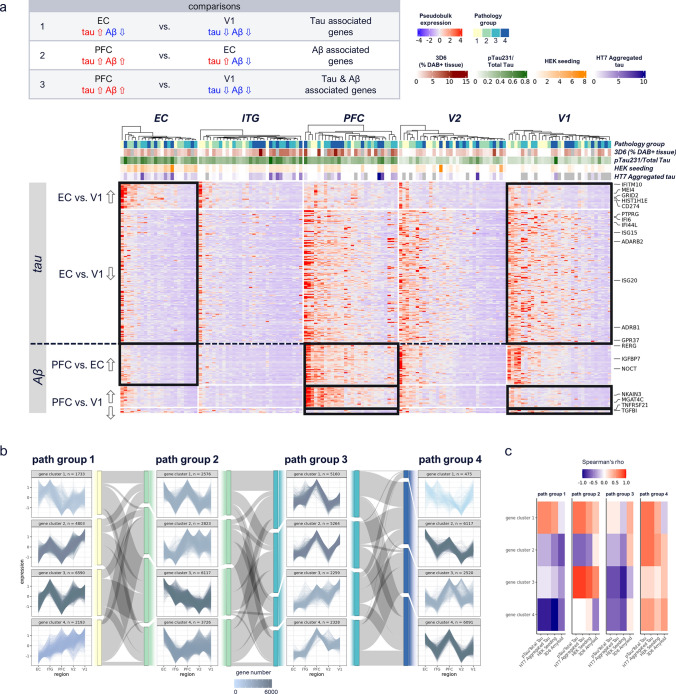
Human microglia are critically involved in Alzheimer's disease (AD) progression, as shown by genetic and molecular studies. However, their role in tau pathology progression in human brain has not been well described. Here, we characterized 32 human donors along progression of AD pathology, both in time-from early to late pathology-and in space-from entorhinal cortex (EC), inferior temporal gyrus (ITG), prefrontal cortex (PFC) to visual cortex (V2 and V1)-with biochemistry, immunohistochemistry, and single nuclei-RNA-sequencing, profiling a total of 337,512 brain myeloid cells, including microglia. While the majority of microglia are similar across brain regions, we identified a specific subset unique to EC which may contribute to the early tau pathology present in this region. We calculated conversion of microglia subtypes to diseased states and compared conversion patterns to those from AD animal models. Targeting genes implicated in this conversion, or their upstream/downstream pathways, could halt gene programs initiated by early tau progression. We used expression patterns of early tau progression to identify genes whose expression is reversed along spreading of spatial tau pathology (EC > ITG > PFC > V2 > V1) and identified their potential involvement in microglia subtype conversion to a diseased state. This study provides a data resource that builds on our knowledge of myeloid cell contribution to AD by defining the heterogeneity of microglia and brain macrophages during both temporal and regional pathology aspects of AD progression at an unprecedented resolution.

Keywords: Alzheimer’s disease; Microglia; Myeloid cells; Single-nucleus RNA-sequencing.


Conflict of interest statement

AW, MEW, SL, CW, EM, NR, KY, GL, FL, CK, YG, MPK, TD, EHK, XL, JSR, RVT, and KB are employees of AbbVie. AA, TP, JT, and TK were AbbVie employees at the time of the study. The design, study conduct, and financial support for this research were provided by AbbVie. AbbVie participated in the interpretation of data, review, and approval of the publication. BTH has received research funding from AbbVie as part of a collaboration agreement with The General Hospital Corporation, d/b/a Massachusetts General Hospital. BTH has a family member who works at Novartis and owns stock in Novartis; he serves on the SAB of Dewpoint and owns stock. He serves on a scientific advisory board or is a consultant for AbbVie, Aprinoia, Avrobio, Biogen, BMS Cell Signaling, Genentech, Novartis, Seer, Takeda, the US Dept of Justice, Vigil, and Voyager. His laboratory is supported by sponsored research agreements with AbbVie, and research grants from the National Institutes of Health, Cure Alzheimer’s Fund, Tau Consortium, and the JPB Foundation. MPF has Sponsored Research Agreements with Biogen and Voyager Therapeutics and works on the AbbVie-Hyman Collaboration. ASP, MJ, HL, SD, and RB work on the AbbVie-Hyman Collaboration and have no other funding to disclose.

Figures

Fig. 1
Fig. 1
Study design and identification of brain myeloid cells across brain regions. a Study design. Samples from 5 brain regions of in total 32 donors along four stages of AD pathology progression were snRNA-seq profiled and characterized by quantitative readouts of tau as well as Aβ 3D6 IHC. Samples were divided into 4 pathology groups, according to their Braak and Thal stage. b Comparison of dataset size and median UMIs per microglia/brain myeloid nucleus vs. public microglial studies. c Per region microglia/brain myeloid cell numbers as proportion of all NeuN-/Olig2- cells per region. d UMAP representation of NeuN-/Olig2- cells, brain myeloid cells are colored in blue. Grey and blue numbers correspond to the absolute NeuN-/Olig2- sorted non-myeloid cells (e.g., astrocytes, endothelial cells, and pericytes) and myeloid cells, respectively. e pTau/Total Tau, HT7 Aggregated Tau, HEK seeding, and 3D6 Amyloid-β measurements for each pathology group (CTRL → AD), across brain regions. f Quantification of CD11c and CD68 immunohistochemistry across brain regions and pathology groups. g Representative CD11c and CD68 IHC (EC, grey matter) of pathology group 4 samples, with CD11c in brown and plaques (3D6) in red, and CD68 in brown and plaques (D54D2) in red, respectively (scale bar 100 µm). IHC across pathology groups in Fig S1d/e
Fig. 2
Fig. 2
Brain myeloid cell similarity across brain regions. a Brain myeloid cell subclustering per brain region. Macrophage cluster numbers are indicated in bold (based on LYVE1, MRC1, CD163, and F13A1 marker genes). b Cross-region integration of subsampled brain myeloid cells across brain regions shows alignment between regions for most cells, except for one EC-enriched population of cells (highlighted in black circles). Shown are combined and per region UMAP plots. c EC enriched population (indicated as green cells in UMAP plot) was compared to all other brain myeloid cells across regions. Biological process GO term enrichment indicates upregulated synapse vesicle cycle changes and ion transport differences. d Up- and downregulated differentially expressed gene (DEG) numbers per region, filtered for microglial genes (average log2FC > 0.25). e Top 5 upregulated microglia genes per region (no significantly upregulated V2 markers identified)
Fig. 3
Fig. 3
Identification of tau- and Aβ -associated microglia and brain macrophage subpopulations. a Per cluster pathology group enrichment shown as observed over expected ratios (scaled to 1) (upper panels of heatmaps) and Spearman correlation of 3D6 and tau readouts with proportion of brain myeloid cells per cluster (lower panels of heatmaps). ‘*’corresponds to significant enrichment >  = 10% (binomial test, adj. p value < 0.001), and significant Spearman correlation (p value < 0.05), respectively. Solid black boxes denote clusters positively correlated with pathology; dashed black boxes denote clusters negatively correlated with pathology. Bold cluster numbers indicate macrophage clusters, characterized by increased expression of LYVE1, MRC1, F13A1, and CD163. b Mapping of disease-associated clusters per region (right) to cross-region integrated data (left) confirms similarity of disease-associated clusters across brain regions, albeit indicating expression differences between primarily tau- (clusters 2/4 in integrated data) and tau + Aβ -associated clusters (clusters 5/8 in integrated data). c 3D6 IHC, pTau/Total tau, and HT7 aggregated tau readouts were binned into 5 equally spaced categories, representing no-to-late pathology. For simplicity, integrated microglia are shown for no, early, and late pathology only (first, middle, last bin), based on their cellular density in individual clusters (UMAP representation). Grey plots beneath visually summarize shifts of brain myeloid cells into clusters stratified for early (lightblue) and late (darkblue) pathology. For HT7 aggregated tau, bin #4 (not #5) is shown at late stage, as last bin (#5) only contained data from one donor. d Spearman correlation of cross-region brain myeloid cell clusters (using DEGs per cluster vs. cluster 0) with public genelists. Significant correlation indicated by ***p value < 0.001, **p value < 0.01, *p value < 0.05, grey boxes indicate insufficient data (number of overlapping genes between data sets < 10). AD1 and AD2 human microglia signatures from [16]; laser capture microdissected samples from [9] with signatures “Das_LCM_Plaque” (ThioflavinS + plaques), “Das_LCM_Peri_Plaque” (50 µm area around plaques), “Das_LCM_NFT” (neurofibrillary tangles with the 50µm area around them), “Das_LCM_Distant” (area > 50µm away from plaques), “Das_LCM_Plaque_vs_NFT” (ThioflavinS + plaques vs. neurofibrillary tangles); human iPSC-derived microglia-like cells transplanted into mice, with signatures CRM2 cytokine response 2, CYT/CRM1 cytokine response 1, DAM (disease associated), HLA antigen-presenting response, HM homeostatic, IRM (Interferon response), RM (ribosomal response), TRANS transitioning CRM from [32]; and primary mouse microglia tau fibril response genes from [51]
Fig. 4
Fig. 4
Microglia subtype conversion in human. a Trajectories to disease-associated clusters were identified with monocle3 [50]. b For individual trajectories 0 (HOM)–3 (RR), 0–4 (EALT), and 0–5 (LAR), transitionally upregulated genes were identified by splitting pseudotime into quartiles and filtering for genes expressed at a higher level in middle quartiles (transitionally higher expressed) compared to 1st and 4th one, the latter representing cluster-enriched expression in HOM, or disease-associated cluster, respectively. c Expression of top 30 genes per microglial phenotype (HOM, DAM1, DAM2, EADAM, LADAM) identified in [28], averaged per cluster in cross-region integrated brain myeloid cells. Red indicates high average expression levels; blue indicates low average expression levels. Clear upregulation of HOM (cluster 0) and DAM1 (cluster 3) phenotypes are observed, as well as enriched expression of LADAM and EADAM genes across clusters 4, 5, and 10, indicated by black boxes. Clusters 6 and 10 show strong relative downregulation of homeostatic microglia markers, as indicated by blue boxes. d,e Volcano plots showing genes differentially expressed between cluster 4 and 10 (d), and cluster 5 and 10 (e)
Fig. 5
Fig. 5
Tau- and Aβ-associated brain myeloid cell signatures. a Heatmap of differentially expressed genes (DEGs) up- (⇧) or down- (⇩) regulated in EC vs. V1, PFC vs. EC and PFC vs. V1 regions, within pathology group 4. Tau-driven changes (EC vs. V1) include interferon-related genes, while Aβ driven and tau & Aβ-driven changes (PFC vs. EC, PFC vs. V1) include growth factor, and cytokine signaling related genes, respectively. Results were adjusted for gender and respective pathology group 1 DEGs were filtered out. Color-coding of aggregated expression per sample (column) and gene (row), annotation shows pathology group, 3D6 Aβ IHC, pTau/Total Tau, HEK seeding, and HT7 Aggregated Tau. Filtering for DEGs based on nominal p value < 0.01 and logFC > 1.2. Expression patterns included in respective comparisons are indicated by black boxes; expression patterns of other regions are shown for completeness. b K-means gene clustering across regions, per pathology group. Gene numbers are color-coded. Sankey diagrams, color-coded according to pathology group, show percentage change of genes from given gene clusters in one pathology group to gene clusters in next pathology group. Pathology group 3 and 4 gene clusters spike in PFC region, suggesting Aβ influenced expression, while pathology group 1 and 2 contain also gene clusters showing linear correlation along regions. c Spearman correlation per pathology group of each gene cluster with biochemical readouts; overall highest correlation is observed in pathology group 4, across gene clusters. High correlation is indicated by red and low correlation by blue color

References

    1. Ahuja M, Kaidery NA, Attucks OC, McDade E, Hushpulian DM, Gaisin A, Gaisina I, Ahn YH, Nikulin S, Poloznikov A, Gazaryan I, Yamamoto M, Matsumoto M, Igarashi K, Sharma SM, Thomas B. Bach1 derepression is neuroprotective in a mouse model of Parkinson’s disease. Proc Natl Acad Sci. 2021;118:e2111643118. doi: 10.1073/pnas.2111643118. - DOI - PMC - PubMed
    1. del Alonso AC, Zaidi T, Novak M, Grundke-Iqbal I, Iqbal K. Hyperphosphorylation induces self-assembly of τ into tangles of paired helical filaments/straight filaments. Proc National Acad Sci. 2001;98:6923–6928. doi: 10.1073/pnas.121119298. - DOI - PMC - PubMed
    1. Asai H, Ikezu S, Tsunoda S, Medalla M, Luebke J, Haydar T, Wolozin B, Butovsky O, Kügler S, Ikezu T. Depletion of microglia and inhibition of exosome synthesis halt tau propagation. Nat Neurosci. 2015;18:1584–1593. doi: 10.1038/nn.4132. - DOI - PMC - PubMed
    1. Braak H, Braak E. Frequency of stages of Alzheimer-related lesions in different age categories. Neurobiol Aging. 1997;18:351–357. doi: 10.1016/s0197-4580(97)00056-0. - DOI - PubMed
    1. Braak H, Braak E. Neuropathological stageing of Alzheimer-related changes. Acta Neuropathol. 1991;82:239–259. doi: 10.1007/bf00308809. - DOI - PubMed

Publication types