. 2024 Mar 11;32(2):101234.
doi: 10.1016/j.omtm.2024.101234. eCollection 2024 Jun 13.

Novel AAV variants with improved tropism for human Schwann cells

Affiliations

Novel AAV variants with improved tropism for human Schwann cells

Matthieu Drouyer et al. Mol Ther Methods Clin Dev. .

Abstract

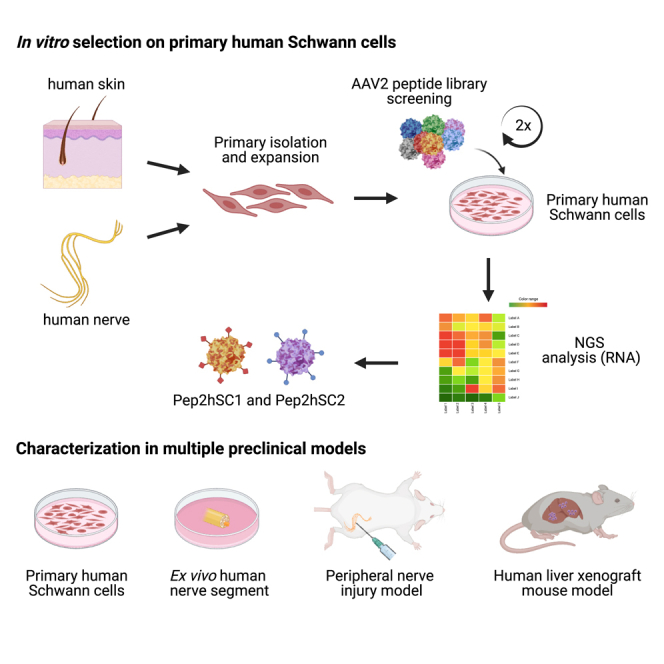
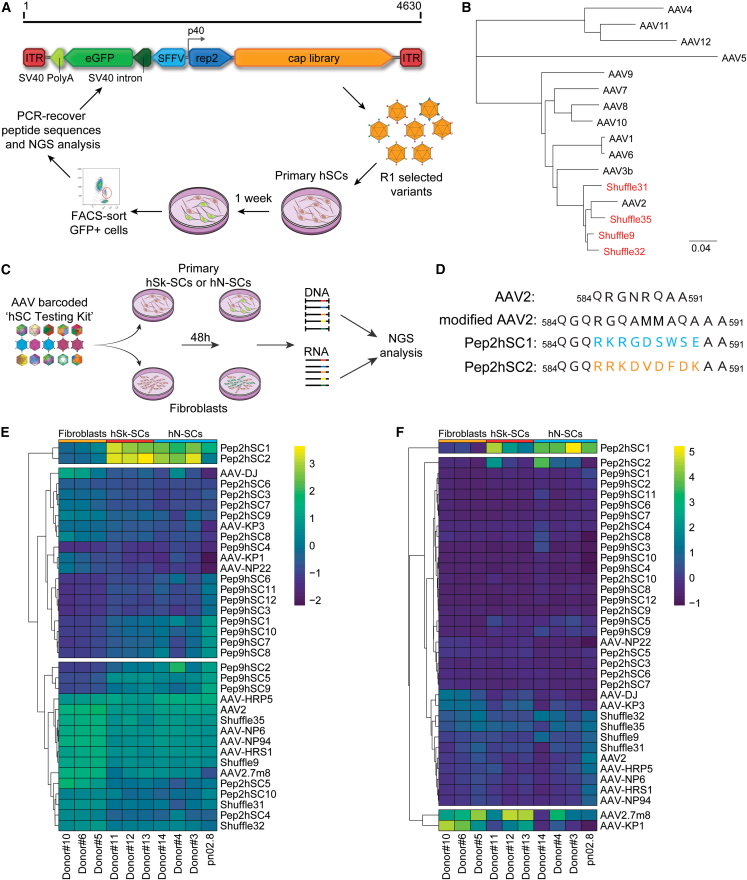
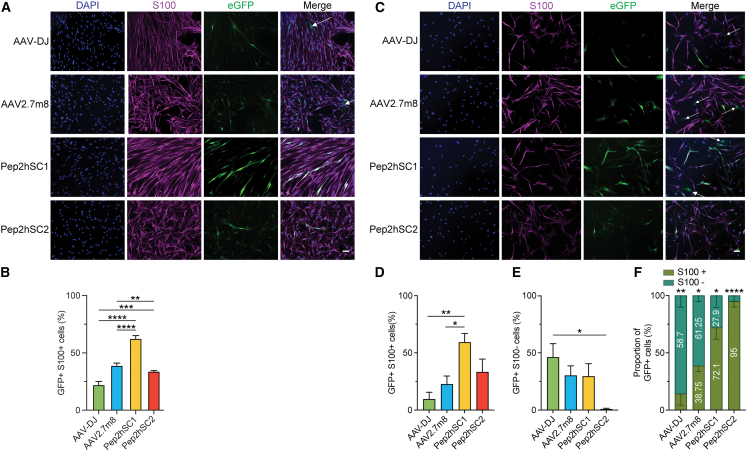
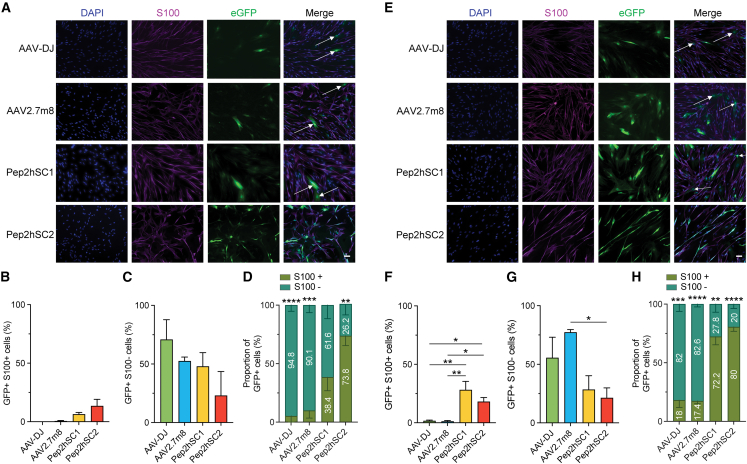
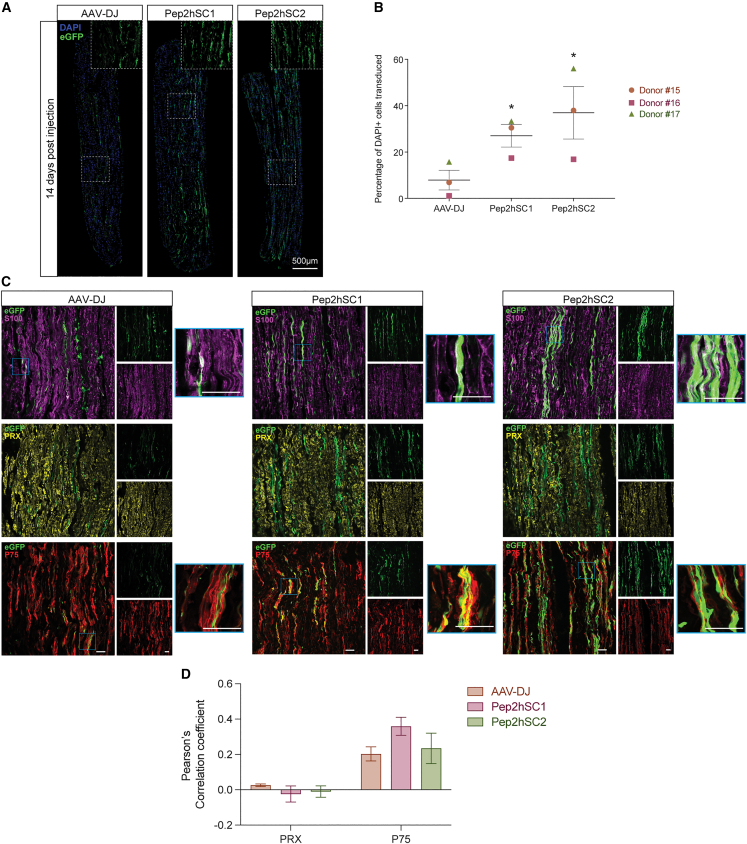
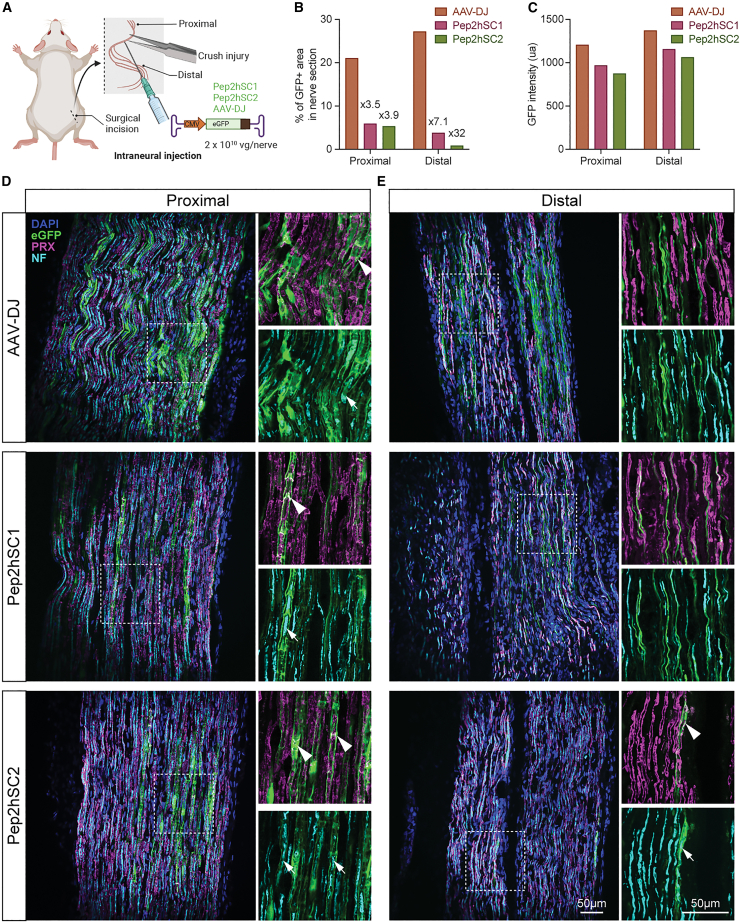
Gene therapies and associated technologies are transforming biomedical research and enabling novel therapeutic options for patients living with debilitating and incurable genetic disorders. The vector system based on recombinant adeno-associated viral vectors (AAVs) has shown great promise in recent clinical trials for genetic diseases of multiple organs, such as the liver and the nervous system. Despite recent successes toward the development of novel bioengineered AAV variants for improved transduction of primary human tissues and cells, vectors that can efficiently transduce human Schwann cells (hSCs) have yet to be identified. Here, we report the application of the functional transduction-RNA selection method in primary hSCs for the development of AAV variants for specific and efficient transgene delivery to hSCs. The two identified capsid variants, Pep2hSC1 and Pep2hSC2, show conserved potency for delivery across various in vitro, in vivo, and ex vivo models of hSCs. These novel AAV capsids will serve as valuable research tools, forming the basis for therapeutic solutions for both SC-related disorders or peripheral nervous system injury.

Keywords: AAV; Schwann cells; adeno-associated vector; directed evolution; gene therapy; vector engineering.


Conflict of interest statement

M.D., J.M., M.C.-C., A.W., S.L.G., I.E.A., and L.L. are inventors on patent applications filed by Children’s Medical Research Institute related to AAV capsid sequences, in vivo function of novel AAV variants and AAV selection platforms. L.L. is a co-founder and scientific advisor of LogicBio Therapeutics. L.L. and I.A.E. are co-founders of Exigen Biotherapeutics. L.L. and I.E.A. have consulted on broad technologies addressed in this paper. L.L. and I.A.E. have stock and/or equity in companies with technology broadly related to this paper.

Figures

None
Graphical abstract
Figure 1
Figure 1
FT selection platform for AAV capsids targeting primary hSCs (A) Overview of the capsid variant selection using the FT platform. (B) Phylogenic relation of the selected AAV shuffling capsid variants and the parental AAV serotypes used to construct the library. Scale: evolutionary distance of the number of substitutions per site. (C) Schematic representation of the barcoded-AAV hSC testing kit for NGS comparison in primary hSk-SCs or the hN-SCs and primary human fibroblasts from different donors. (D) Identity of the amino acid peptide sequences of Pep2hSC1 and Pep2hSC2 inserted in a modified AAV2 capsid. (E and F) Analysis of barcoded variants with capsid recovery achieved at the level of both (E) cell entry (DNA) and (F) transgene expression (mRNA). Heatmap and clustering analysis of capsid performance as a percentage of total NGS reads for each cell type. Values are normalized to a pre-mix pool and are the average of two barcodes.
Figure 2
Figure 2
Novel AAV variants transduce hSCs with high efficiency and specificity (A) Representative images of pure cultured hSCs transduced with EGFP reporter AAVs packaged using indicated capsids at 1,000 vg/cell. Blue, DAPI; purple, S100 (SCs marker); green, AAV-encoded EGFP. Arrows show EGFP+/S100 cells. Scale bar, 50 μm. (B) Percentage of EGFP+ SCs. Quantification was performed using ≥80 cells per image, and ≥3 images per variant. p values were determined by one-way ANOVA with Holm-Śidák’s multiple comparison test (∗∗p ≤ 0.01; ∗∗∗p ≤ 0.001; ∗∗∗∗p ≤ 0.0001). Data are shown as mean ± SEM. (C) Representative immunofluorescence images of mixed cultured hSCs transduced with EGFP reporter AAVs packaged using indicated capsids at 1,000 vg/cell. For (A) and (C), arrows indicate EGFP+/S100 cells. Scale bar, 50 μm. (D and E) Percentage of (D) EGFP+/S100+ cells and (E) EGFP+/S100 cells. Quantification was performed using ≥30 cells per image, and ≥4 images per variant. p values were determined by one-way ANOVA with Holm-Śidák multiple comparison test (∗p ≤ 0.05; ∗∗p ≤ 0.01). Data are shown as mean ± SEM. (F) Proportion of EGFP+ cells in the mixed hSC culture. Percentages of S100+ and S100 cells among total EGFP+ cells were calculated. p values were determined by unpaired t-test (∗p ≤ 0.05; ∗∗p ≤ 0.01; ∗∗∗∗p ≤ 0.0001).
Figure 3
Figure 3
Novel AAV variants showed enhanced transduction in hSCs isolated from NF1 plexiform neurofibroma compared with AAV-DJ and AAV2.7m8 Functional analysis of indicated AAVs in hSC isolated from NF1 plexiform neurofibroma transduced at (A–D) 1,000 or (E–H) 10,000 vg/cell. Representative images of hSCs transduced with indicated AAVs encoding EGFP reporter at (A) 1,000 vg/cell or (E) 10,000 vg/cell. Blue, DAPI; purple, S100 (SCs marker); green, AAV-encoded EGFP. Arrows show EGFP+/S100 cells. Scale bar, 50 μm. (B and C) Percentage of (B) EGFP+/S100+ cells and (C) EGFP+/S100 cells. (D) Proportion of EGFP+ cells in the mixed hSC culture. Percentages of S100+ and S100 cells among total EGFP+ cells were calculated. p values were determined by unpaired t-test (∗∗p ≤ 0.01; ∗∗∗p ≤ 0.001; ∗∗∗∗p ≤ 0.0001). (F and G) Percentage of (F) EGFP+/S100+ cells and (G) EGFP+/S100 cells. (H) Proportion of EGFP+ cells in the mixed hSC culture. Percentages of S100+ and S100 cells among total EGFP+ cells were calculated. p values were determined by unpaired t-test (∗∗p ≤ 0.01; ∗∗∗p ≤ 0.001; ∗∗∗∗p ≤ 0.0001). (B, C, F, and G) Quantification was performed using ≥30 cells per image, and ≥4 images per variant. p values were determined by one-way ANOVA with Holm-Śidák’s’s multiple comparison test (∗p ≤ 0.05; ∗∗p ≤ 0.01). Data are shown as mean ± SEM.
Figure 4
Figure 4
Novel AAV variants transduce SCs in human nerve segments (A) Immunofluorescence of longitudinal sections of human sural nerve segments at 14 days after injection. Nerve segments (0.5cm) were injected with AAV-DJ, Pep2hSC1, or Pep2hSC2 vectors encoding a CMV-EGFP transgene (1 × 1010 vg dose per segment). Insets show magnified area of transduced cells with elongated morphology characteristic of SCs. DAPI (blue), AAV-encoded EGFP (green). Scale bar, 500 μm. (B) Number of EGFP+ cells overlapping with DAPI marker in nerve segment 14 days after injection from three donors (mean ± SEM; n = 3). p values were determined by unpaired t-test (∗p ≤ 0.05). (C) Confocal microscopy images of longitudinal sections immunostained for EGFP (green) with either S100 (purple) for SCs, PRX (yellow) for nmSCs, or P75 (red) for non-nmSCs. Blue outlined insets show magnified area of colocalization. Scale bar, 50 μm. (D) Pearson’s correlation coefficient for colocalization of EGFP and PRX or P75 (mean ± SEM; n = 3). Donor 15 is a 42-year-old male, donor 16 is a 44-year-old male, Caucasian, and donor 17 is a 73-year-old male, Asian.
Figure 5
Figure 5
Evaluation of novel AAV variants in sciatic nerve crush model (A) Graphical illustration of AAV delivery following nerve crush injury. Following forceps-induced nerve injury, AAV-DJ, Pep2hSC1, or Pep2hSC2 were administered by intraneural injection (2 × 1010 vg dose per mouse) and sciatic nerves were harvested 4 weeks post-injection. (B) Quantification of the percentage of transduced area in proximal and distal region from the crushed site (transduction area has been reported as the percentage of EGFP stained area versus total nerve area). (C) Quantification of the mean EGFP intensity per transduced cell. (D and E) Longitudinal sections with DAPI (blue), EGFP (green), PRX (magenta) and neurofilament (NF) staining (light blue). (D and E) Representative images of (D) proximal region and (E) distal region from crushed site. Insets show a magnified views of selected areas highlighted by white dotted outline. Arrowheads indicate colocalization between EGFP and PRX (nmSC marker). Arrows show EGFP-labeled cells enclose the axons marked by NF staining. Scale bar, 50 μm.

References

    1. Mendell J.R., Al-Zaidy S., Shell R., Arnold W.D., Rodino-Klapac L.R., Prior T.W., Lowes L., Alfano L., Berry K., Church K., et al. Single-Dose Gene-Replacement Therapy for Spinal Muscular Atrophy. N. Engl. J. Med. 2017;377:1713–1722. doi: 10.1056/NEJMoa1706198. - DOI - PubMed
    1. Ginn S.L., Amaya A.K., Alexander I.E., Edelstein M., Abedi M.R. Gene therapy clinical trials worldwide to 2017: An update. J. Gene Med. 2018;20 doi: 10.1002/jgm.3015. - DOI - PubMed
    1. Au H.K.E., Isalan M., Mielcarek M. Gene Therapy Advances: A Meta-Analysis of AAV Usage in Clinical Settings. Front. Med. 2021;8 doi: 10.3389/fmed.2021.809118. - DOI - PMC - PubMed
    1. Büning H., Srivastava A. Capsid Modifications for Targeting and Improving the Efficacy of AAV Vectors. Mol. Ther. Methods Clin. Dev. 2019;12:248–265. doi: 10.1016/j.omtm.2019.01.008. - DOI - PMC - PubMed
    1. Bhatheja K., Field J. Schwann cells: Origins and role in axonal maintenance and regeneration. Int. J. Biochem. Cell Biol. 2006;38:1995–1999. doi: 10.1016/j.biocel.2006.05.007. - DOI - PubMed