. 2024 Mar 15:4:1199198.
doi: 10.3389/fnetp.2024.1199198. eCollection 2024.

Modulation of expression of Connexins 37, 40 and 43 in endothelial cells in culture

Affiliations

Modulation of expression of Connexins 37, 40 and 43 in endothelial cells in culture

Wenqing Zhuang et al. Front Netw Physiol. .

Abstract

Connexin (Cx) 37, 40, and 43 are implicated in vascular function, specifically in the electrical coupling of endothelial cells and vascular smooth-muscle cells. In the present study, we investigated whether factors implicated in vascular dysfunction can modulate the gene expression of Cx37, Cx40, and Cx43 and whether this is associated with changes in endothelial layer barrier function in human microvascular endothelial cells (HMEC-1). First, HMEC-1 were subjected to stimuli for 4 and 8 h. We tested their responses to DETA-NONOate, H2O2, high glucose, and angiotensin II, none of which relevantly affected the transcription of the connexin genes. Next, we tested inflammatory factors IL-6, interferon gamma (IFNγ), and TNFα. IFNγ (10 ng/mL) consistently induced Cx40 expression at 4 and 8 h to 10-20-fold when corrected for the control. TNFα and IL-6 resulted in small but significant depressions of Cx37 expression at 4 h. Two JAK inhibitors, epigallocatechin-3-gallate (EGCG) (100-250 μM) and AG490 (100-250 μM), dose-dependently inhibited the induction of Cx40 expression by IFNγ. Subsequently, HMEC-1 were subjected to 10 ng/mL IFNγ for 60 h, and intercellular and transcellular impedance was monitored by electric cell-substrate impedance sensing (ECIS). In response to IFNγ, junctional-barrier impedance increased more than cellular-barrier impedance; this was prevented by AG490 (5 μM). In conclusion, IFNγ can strongly induce Cx40 expression and modify the barrier properties of the endothelial cell membrane through the JAK/STAT pathway. Moreover, the Cx37, Cx40, and Cx43 expression in endothelial cells is stable and, apart from IFNγ, not affected by a number of factors implicated in endothelial dysfunction and vascular diseases.

Keywords: JAK/STAT; cardiovascular risk factors; connexin; endothelial cell; interferon gamma.


Conflict of interest statement

The authors declare that the research was conducted in the absence of any commercial or financial relationships that could be construed as a potential conflict of interest.

Figures
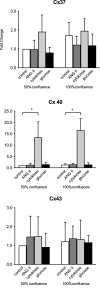
FIGURE 1
FIGURE 1
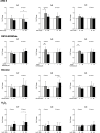
Initial evaluation of connexin mRNA responses at 50 versus 100% confluency in time-control cells and in ECs after 8 h of exposure to 100 nM angiotensin II (ANG II; dark gray), a combination of 20 IU/mL IL-6, 10 ng/mL IFNγ, and 20 ng/mL TNFα (cytokines, light gray) and 20 mmol/L glucose (glucose, black). +: p <0.0001. Data represent the mean ± SD of three independent experiments.
FIGURE 2
FIGURE 2
Immunofluorescence of connexin 37 (Alexa Fluor™ 488, green), 40 (Alexa Fluor™ 594, red), and 43 (Alexa Fluor™ 594, red) which were stained in human microvascular ECs (HMEC-1; X-200) (upper panels). Cell nuclei were stained with DAPI (dark blue fluorescence). Confocal images of cells exposed only to the secondary antibody did not reveal any signal for Cx37, Cx40, and Cx43 (lower panels).
FIGURE 3
FIGURE 3
HMEC-1 mRNA expression of Cx37, Cx40, and Cx43 upon exposure to ANG II, DETA-NONOate, glucose, and H2O2. Cx37 gene expression decreased after 8 h of exposure to 100 μM ANG II. Cx40 expression mildly increased after 4 h of exposure to 10 μM ANG II. The expression of Cx43 remained stable. Concentrations of 1 µM and 10 µM DETA-NONOate did not affect Cx37 expression. DETA-NONOate at 1 μM increased the Cx40 and Cx43 gene expression after 4 h. Cx37, Cx40, and Cx43 gene expressions did not change upon exposure to 5 or 25 mM glucose compared to the control. In response to H2O2, there was a slight induction of Cx37 after 8 h of exposure to 100 nM. It should be noted that all observed changes were quantitatively small. All data were derived from six independent experiments per experimental setting and three replicates in each experiment. *p <0.05; **p <0.01.
FIGURE 4
FIGURE 4
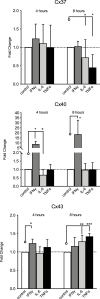
HMEC-1 mRNA expression of Cx37, Cx40, and Cx43 upon exposure to TNFα, IFNγ, and IL-6. Cx37 expression significantly decreased after 8 h of exposure to IL-6 (20 U/mL) and TNFα (20 ng/mL) modulation. Cx40 expression was reduced after 4 h of exposure to IL-6, but not after 8 h. IFNγ (10 ng/mL) induced Cx40 expression, approximately 10-fold after 4 h and approximately 17-fold at 8 h. IFNγ increased Cx43 expression at 4 h but not at 8 h. Both TNFα (p <0.001) and IL-6 increased Cx43 expression significantly after 8 h of stimulation. All data were derived from six independent experiments per experimental setting and three replicates in each experiment. *p <0.05, **p <0.01, ***p <0.001, and + p < 0.0001. Significance is indicated as compared to the bars pointed at with a line with a circle.
FIGURE 5
FIGURE 5
HMEC-1 Cx40 mRNA expression in response to IFNγ in the absence and presence of JAK/STAT inhibitors, EGCG and AG490. EGCG inhibited the enhanced Cx40 gene expression by IFNγ 1 or 3 ng/mL at concentrations over 100 μM. Every concentration of AG490 inhibited the elevated Cx40 expression induced by IFNγ in a dose of 1 or 3 ng/mL. The highest dosages of the EGCG and AG490 inhibition resulted in a decreased Cx40 gene expression versus control. All data were derived from three independent experiments per experimental setting and three replicates in each experiment. A total of 95% confidence intervals were derived from the curve fitting. *p <0.05, **p <0.01, ***p <0.001, and + p < 0.0001. Significance is indicated as compared to the bars pointed at with a line with a circle.
FIGURE 6
FIGURE 6
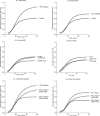
Normalized impedance of HMEC-1 at 4 kHz and 64 kHz throughout 60 h of treatment. Panels A1 and A2 show impedance changes in response to IFNγ at 4 and 64 kHz, respectively. After 1 h of recording, the medium was replaced with the growth medium containing 10 ng/mL IFNγ with DPBS serving as the control. IFNγ resulted in a higher impedance level compared to the control after 30 h at both frequencies. Panels B1 and B2 show impedance time series at 4 kHz and 64 kHz, respectively, where the HMEC-1 medium was replaced with the growth medium containing AG490 5 μM and 10 uM, with DPBS as the control. At 4 kHz, impedance plateaued at similar levels to the control in the presence of 5 μM AG490; yet, the plateau in the presence of 10 uM AG490 was lower compared to the control. At 64 kHz, both doses of AG490 resulted in a lower impedance plateau compared to the control. In panels C1 and C2, the response at 4 kHz and 64 kHz is shown where HMEC-1 cells were pretreated with AG490 and then exposed to 10 ng/mL IFNγ. Both 5 μM and 10 μM AG490 diminished the enhanced impedance in response to 10 ng/mL IFNγ at both 4 kHz and 64 kHz. Data were derived from 5–12 wells in the ECIS arrays in 5–7 independent experiments.
FIGURE 7
FIGURE 7
Comparison of the average impedance level between 40 and 50 h at 4 and 64 kHz. At 4 kHz between 40 and 50 h, IFNγ significantly increased impedance compared to the control. Pre-treatment with 10 μM AG490 decreased the impedance level below the control level. Pre-treatment with both doses of AG490 diminished the enhancement of impedance by IFNγ. At 64 kHz between 40 and 50 h, changes were similar but less pronounced. Data were obtained from 5–7 independent experiments. **: p <0.005; +: p <0.0001. Significance is indicated as compared to the bars pointed at with a line with a circle.

Similar articles

References

    1. Abed A., Dussaule J. C., Boffa J. J., Chatziantoniou C., Chadjichristos C. E. (2014). Connexins in renal endothelial function and dysfunction. Cardiovasc Hematol. Disord. Drug Targets 14, 15–21. 10.2174/1871529x14666140401105827 - DOI - PubMed
    1. Bluyssen H. A., Rastmanesh M. M., Tilburgs C., Jie K., Wesseling S., Goumans M. J., et al. (2010a). IFN gamma-dependent SOCS3 expression inhibits IL-6-induced STAT3 phosphorylation and differentially affects IL-6 mediated transcriptional responses in endothelial cells. Am. J. Physiol. Cell Physiol. 299, C354–C362. 10.1152/ajpcell.00513.2009 - DOI - PubMed
    1. Bluyssen H. A., Rastmanesh M. M., Tilburgs C., Jie K., Wesseling S., Goumans M. J., et al. (2010b). IFN gamma-dependent SOCS3 expression inhibits IL-6-induced STAT3 phosphorylation and differentially affects IL-6 mediated transcriptional responses in endothelial cells. Am. J. Physiol. Cell Physiol. 299, C354–C362. 10.1152/ajpcell.00513.2009 - DOI - PubMed
    1. Bouis D., Hospers G. A., Meijer C., Molema G., Mulder N. H. (2001). Endothelium in vitro: a review of human vascular endothelial cell lines for blood vessel-related research. Angiogenesis 4, 91–102. 10.1023/a:1012259529167 - DOI - PubMed
    1. Braam B., Allen P., Benes E., Koomans H. A., Navar L. G., Hammond T. (2003). Human proximal tubular cell responses to angiotensin II analyzed using DNA microarray. Eur. J. Pharmacol. 464, 87–94. 10.1016/s0014-2999(03)01382-7 - DOI - PubMed

LinkOut - more resources