

Identification of miRNAs that target Fcγ receptor-mediated phagocytosis during macrophage activation syndrome
- PMID: 38558807
- PMCID: PMC10981272
- DOI: 10.3389/fimmu.2024.1355315
Identification of miRNAs that target Fcγ receptor-mediated phagocytosis during macrophage activation syndrome
Abstract
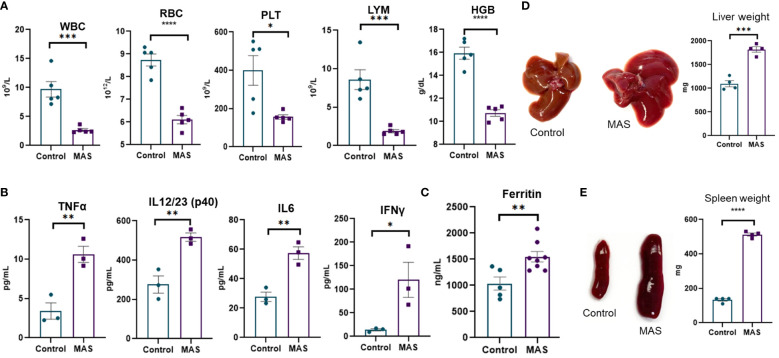
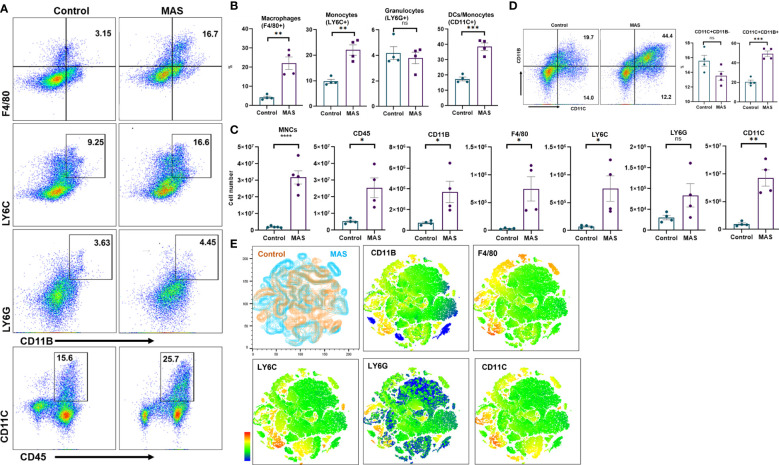
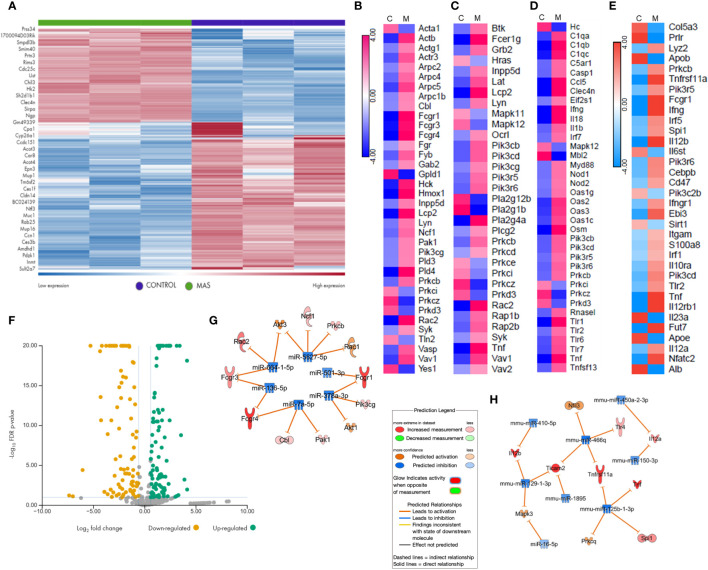
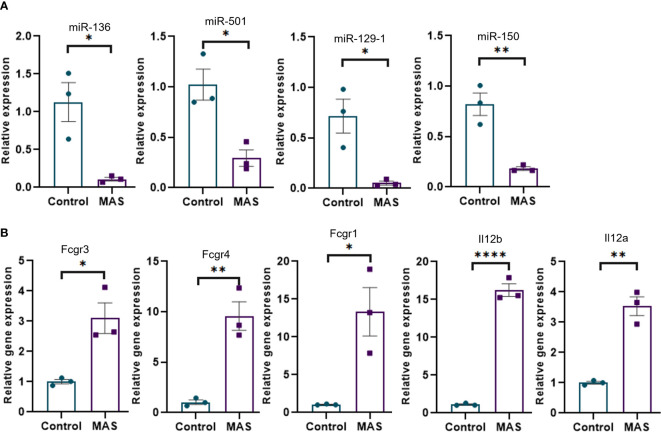
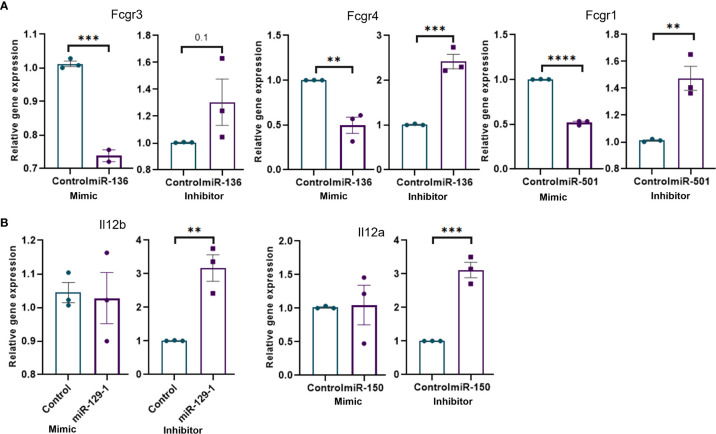
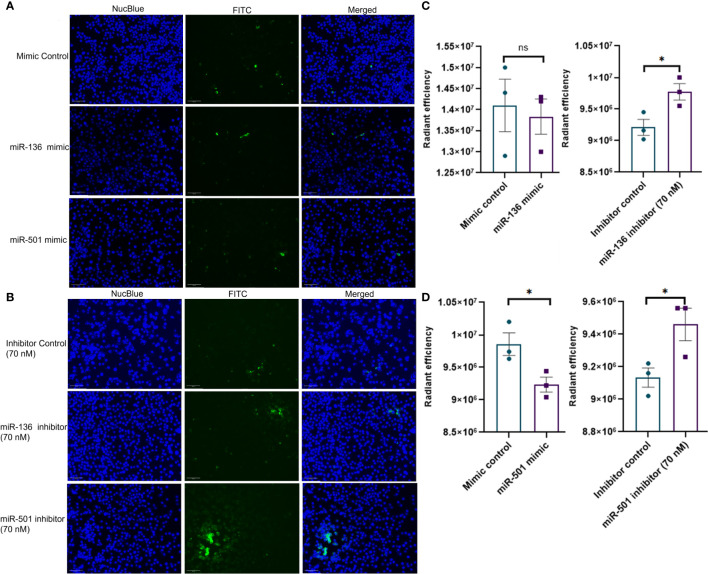
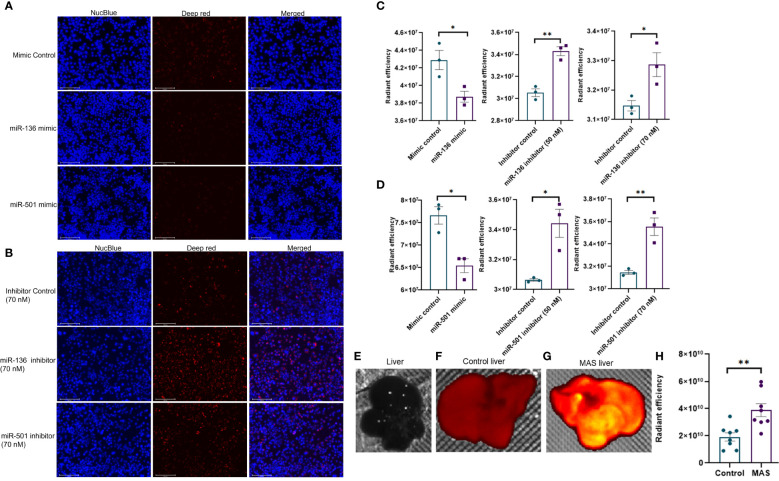
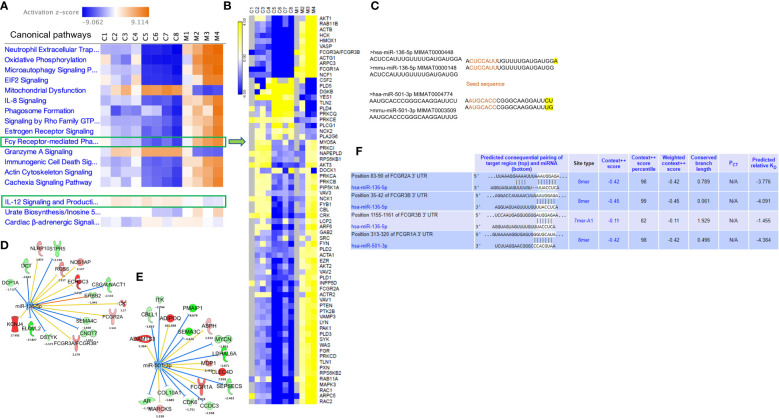
Macrophage activation syndrome (MAS) is a life-threatening complication of systemic juvenile arthritis, accompanied by cytokine storm and hemophagocytosis. In addition, COVID-19-related hyperinflammation shares clinical features of MAS. Mechanisms that activate macrophages in MAS remain unclear. Here, we identify the role of miRNA in increased phagocytosis and interleukin-12 (IL-12) production by macrophages in a murine model of MAS. MAS significantly increased F4/80+ macrophages and phagocytosis in the mouse liver. Gene expression profile revealed the induction of Fcγ receptor-mediated phagocytosis (FGRP) and IL-12 production in the liver. Phagocytosis pathways such as High-affinity IgE receptor is known as Fc epsilon RI -signaling and pattern recognition receptors involved in the recognition of bacteria and viruses and phagosome formation were also significantly upregulated. In MAS, miR-136-5p and miR-501-3p targeted and caused increased expression of Fcgr3, Fcgr4, and Fcgr1 genes in FGRP pathway and consequent increase in phagocytosis by macrophages, whereas miR-129-1-3p and miR-150-3p targeted and induced Il-12. Transcriptome analysis of patients with MAS revealed the upregulation of FGRP and FCGR gene expression. A target analysis of gene expression data from a patient with MAS discovered that miR-136-5p targets FCGR2A and FCGR3A/3B, the human orthologs of mouse Fcgr3 and Fcgr4, and miR-501-3p targets FCGR1A, the human ortholog of mouse Fcgr1. Together, we demonstrate the novel role of miRNAs during MAS pathogenesis, thereby suggesting miRNA mimic-based therapy to control the hyperactivation of macrophages in patients with MAS as well as use overexpression of FCGR genes as a marker for MAS classification.
Keywords: Fcγ receptors; MAS; MiRNA inhibitors; MiRNA mimics; cytokine; miRNA therapeutics; phagocytosis.
Copyright © 2024 Varsha, Yang, Cannon, Zhong, Nagarkatti and Nagarkatti.
Conflict of interest statement
The authors declare that the research was conducted in the absence of any commercial or financial relationships that could be construed as a potential conflict of interest.
Figures
Similar articles
-
MicroRNA target Fc receptors to regulate Ab-dependent Ag uptake in primary macrophages and dendritic cells.Innate Immun. 2016 Oct;22(7):510-21. doi: 10.1177/1753425916661042. Epub 2016 Jul 22. Innate Immun. 2016. PMID: 27449126
-
Oral Spirochete Treponema denticola Intraoral Infection Reveals Unique miR-133a, miR-486, miR-126-3p, miR-126-5p miRNA Expression Kinetics during Periodontitis.Int J Mol Sci. 2023 Jul 28;24(15):12105. doi: 10.3390/ijms241512105. Int J Mol Sci. 2023. PMID: 37569480 Free PMC article.
-
Genetic and Epigenetic Regulation of the Innate Immune Response to Gout.Immunol Invest. 2023 Apr;52(3):364-397. doi: 10.1080/08820139.2023.2168554. Epub 2023 Feb 6. Immunol Invest. 2023. PMID: 36745138 Review.
-
Phospholipase C δ1 in macrophages negatively regulates TLR4-induced proinflammatory cytokine production and Fcγ receptor-mediated phagocytosis.Adv Biol Regul. 2016 May;61:68-79. doi: 10.1016/j.jbior.2015.11.004. Epub 2015 Nov 28. Adv Biol Regul. 2016. PMID: 26643908
-
Regulation of the MIR155 host gene in physiological and pathological processes.Gene. 2013 Dec 10;532(1):1-12. doi: 10.1016/j.gene.2012.12.009. Epub 2012 Dec 14. Gene. 2013. PMID: 23246696 Review.
Cited by
-
The relationship between microRNAs and COVID-19 complications.Noncoding RNA Res. 2024 Aug 22;10:16-24. doi: 10.1016/j.ncrna.2024.08.007. eCollection 2025 Feb. Noncoding RNA Res. 2024. PMID: 39296641 Free PMC article. Review.
-
Transcriptomics of Various Diseases Reveals the Core Role of Immune System Pathways in Retinal Damage Repair and Nerve Regeneration.Mol Neurobiol. 2025 Aug;62(8):10935-10953. doi: 10.1007/s12035-025-04929-y. Epub 2025 Apr 17. Mol Neurobiol. 2025. PMID: 40244560
References
-
- Ravelli A, Minoia F, Davì S, Horne A, Bovis F, Pistorio A, et al. . 2016 Classification criteria for macrophage activation syndrome complicating systemic juvenile idiopathic arthritis. A Eur League Against Rheumatism/American Coll Rheumatology/Paediatric Rheumatol Int Trials Organisation Collab Initiative. (2016) 75:481–9. doi: 10.1136/annrheumdis-2015-208982 - DOI - PubMed
-
- Billiau AD, Roskams T, Van Damme-Lombaerts R, Matthys P, Wouters C. Macrophage activation syndrome: characteristic findings on liver biopsy illustrating the key role of activated, ifn-gamma-producing lymphocytes and il-6- and tnf-alpha-producing macrophages. Blood. (2005) 105:1648–51. doi: 10.1182/blood-2004-08-2997 - DOI - PubMed
-
- Halyabar O, Chang MH, Schoettler ML, Schwartz MA, Baris EH, Benson LA, et al. . Calm in the midst of cytokine storm: A collaborative approach to the diagnosis and treatment of hemophagocytic lymphohistiocytosis and macrophage activation syndrome. Pediatr Rheumatol. (2019) 17:7. doi: 10.1186/s12969-019-0309-6 - DOI - PMC - PubMed
Publication types
MeSH terms
Substances
Grants and funding
LinkOut - more resources
Full Text Sources