

Comparison of SARS-CoV-2 spike-specific IgA and IgG in nasal secretions, saliva and serum
- PMID: 38558811
- PMCID: PMC10978617
- DOI: 10.3389/fimmu.2024.1346749
Comparison of SARS-CoV-2 spike-specific IgA and IgG in nasal secretions, saliva and serum
Abstract
Introduction: Several novel vaccine platforms aim at mucosal immunity in the respiratory tract to block SARS-CoV-2 transmission. Standardized methods for mucosal sample collection and quantification of mucosal antibodies are therefore urgently needed for harmonized comparisons and interpretations across mucosal vaccine trials and real-world data.
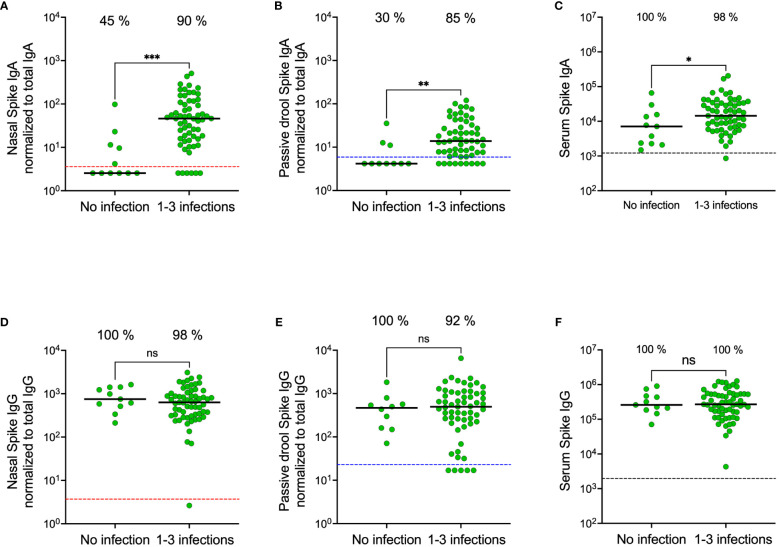
Methods: Using commercial electrochemiluminescence antibody panels, we compared SARS-CoV-2 spike-specific IgA and IgG in paired saliva, nasal secretions, and serum from 1048 healthcare workers with and without prior infection.
Results: Spike-specific IgA correlated well in nasal secretions and saliva (r>0.65, p<0.0001), but the levels were more than three-fold higher in nasal secretions as compared to in saliva (p<0.01). Correlations between the total population of spike-specific IgA and spike-specific secretory IgA (SIgA) were significantly stronger (p<0.0001) in nasal secretions (r=0.96, p<0.0001) as opposed to in saliva (r=0.77, p<0.0001), and spike-specific IgA correlated stronger (p<0.0001) between serum and saliva (r=0.73, p<0.001) as opposed to between serum and nasal secretions (r=0.54, p<0.001), suggesting transudation of monomeric spike specific IgA from the circulation to saliva. Notably, spike-specific SIgA had a markedly higher SARS-CoV-2 variant cross-binding capacity as compared to the total population of spike specific IgA and IgG in both nasal secretions, saliva and serum, (all p<0.0001), which emphasizes the importance of taking potential serum derived monomeric IgA into consideration when investigating mucosal immune responses.
Discussion: Taken together, although spike-specific IgA can be reliably measured in both nasal secretions and saliva, our findings imply an advantage of higher levels and likely also a larger proportion of SIgA in nasal secretions as compared to in saliva. We further corroborate the superior variant cross-binding capacity of SIgA in mucosal secretions, highlighting the potential protective benefits of a vaccine targeting the upper respiratory tract.
Keywords: Covid-19; SARS-CoV-2; antibodies; mucosal immunity; nasal sampling; saliva sampling; secretory IgA; vaccines.
Copyright © 2024 Bladh, Aguilera, Marking, Kihlgren, Greilert Norin, Smed-Sörensen, Sällberg Chen, Klingström, Blom, Russell, Havervall, Thålin and Åberg.
Conflict of interest statement
The authors declare that the research was conducted in the absence of any commercial or financial relationships that could be construed as a potential conflict of interest. The author(s) declared that they were an editorial board member of Frontiers, at the time of submission. This had no impact on the peer review process and the final decision.
Figures


Similar articles
-
Salivary and serum IgA and IgG responses to SARS-CoV-2-spike protein following SARS-CoV-2 infection and after immunization with COVID-19 vaccines.Allergy Asthma Proc. 2022 Sep 1;43(5):419-430. doi: 10.2500/aap.2022.43.220045. Allergy Asthma Proc. 2022. PMID: 36065108 Free PMC article.
-
Detection of SARS-CoV-2-Specific Secretory IgA and Neutralizing Antibodies in the Nasal Secretions of Exposed Seronegative Individuals.Viruses. 2024 May 27;16(6):852. doi: 10.3390/v16060852. Viruses. 2024. PMID: 38932145 Free PMC article.
-
Long-term systemic and mucosal SARS-CoV-2 IgA response and its association with persistent smell and taste disorders.Front Immunol. 2023 Mar 8;14:1140714. doi: 10.3389/fimmu.2023.1140714. eCollection 2023. Front Immunol. 2023. PMID: 36969158 Free PMC article.
-
Mucosal immunity: The missing link in comprehending SARS-CoV-2 infection and transmission.Front Immunol. 2022 Aug 17;13:957107. doi: 10.3389/fimmu.2022.957107. eCollection 2022. Front Immunol. 2022. PMID: 36059541 Free PMC article. Review.
-
Clinical Assessment of SARS-CoV-2 Antibodies in Oral Fluids Following Infection and Vaccination.Clin Chem. 2024 Apr 3;70(4):589-596. doi: 10.1093/clinchem/hvad169. Clin Chem. 2024. PMID: 38039096 Free PMC article. Review.
Cited by
-
mRNA vaccine-induced IgG mediates nasal SARS-CoV-2 clearance in mice.Mol Ther Nucleic Acids. 2024 Oct 15;35(4):102360. doi: 10.1016/j.omtn.2024.102360. eCollection 2024 Dec 10. Mol Ther Nucleic Acids. 2024. PMID: 39524696 Free PMC article.
-
SARS-CoV-2 Vaccines: The Advantage of Mucosal Vaccine Delivery and Local Immunity.Vaccines (Basel). 2024 Jul 18;12(7):795. doi: 10.3390/vaccines12070795. Vaccines (Basel). 2024. PMID: 39066432 Free PMC article. Review.
-
Role of IgA1 protease-producing bacteria in SARS-CoV-2 infection and transmission: a hypothesis.mBio. 2024 Oct 16;15(10):e0083324. doi: 10.1128/mbio.00833-24. Epub 2024 Aug 29. mBio. 2024. PMID: 39207101 Free PMC article.
-
Natural and induced immune responses in oral cavity and saliva.BMC Immunol. 2025 Apr 18;26(1):34. doi: 10.1186/s12865-025-00713-8. BMC Immunol. 2025. PMID: 40251519 Free PMC article. Review.
-
Induction of hemagglutinin stalk reactive antibodies by the administration of a live-attenuated influenza virus vaccine in children.iScience. 2025 Jun 13;28(7):112893. doi: 10.1016/j.isci.2025.112893. eCollection 2025 Jul 18. iScience. 2025. PMID: 40620902 Free PMC article.
References
-
- Feikin DR, Higdon MM, Abu-Raddad LJ, Andrews N, Araos R, Goldberg Y, et al. . Duration of effectiveness of vaccines against SARS-CoV-2 infection and COVID-19 disease: results of a systematic review and meta-regression. Lancet. (2022) 399:924–44. doi: 10.1016/S0140-6736(22)00152-0 - DOI - PMC - PubMed
-
- Nordström P, Ballin M, Nordström A. Effectiveness of a fourth dose of mRNA COVID-19 vaccine against all-cause mortality in long-term care facility residents and in the oldest old: A nationwide, retrospective cohort study in Sweden. Lancet Regional Health – Europe. (2022) 21:100466. doi: 10.1016/j.lanepe.2022.100466 - DOI - PMC - PubMed
-
- Külper-Schiek W, Piechotta V, Pilic A, Batke M, Dreveton LS, Geurts B, et al. . Facing the Omicron variant-how well do vaccines protect against mild and severe COVID-19? Third interim analysis of a living systematic review. Front Immunol. (2022) 13:940562. doi: 10.3389/fimmu.2022.940562 - DOI - PMC - PubMed
Publication types
MeSH terms
Substances
Supplementary concepts
LinkOut - more resources
Full Text Sources
Medical
Miscellaneous