

Towards the design of user-centric strategy recommendation systems for collaborative Human-AI tasks
- PMID: 38558883
- PMCID: PMC10976429
- DOI: 10.1016/j.ijhcs.2023.103216
Towards the design of user-centric strategy recommendation systems for collaborative Human-AI tasks
Abstract
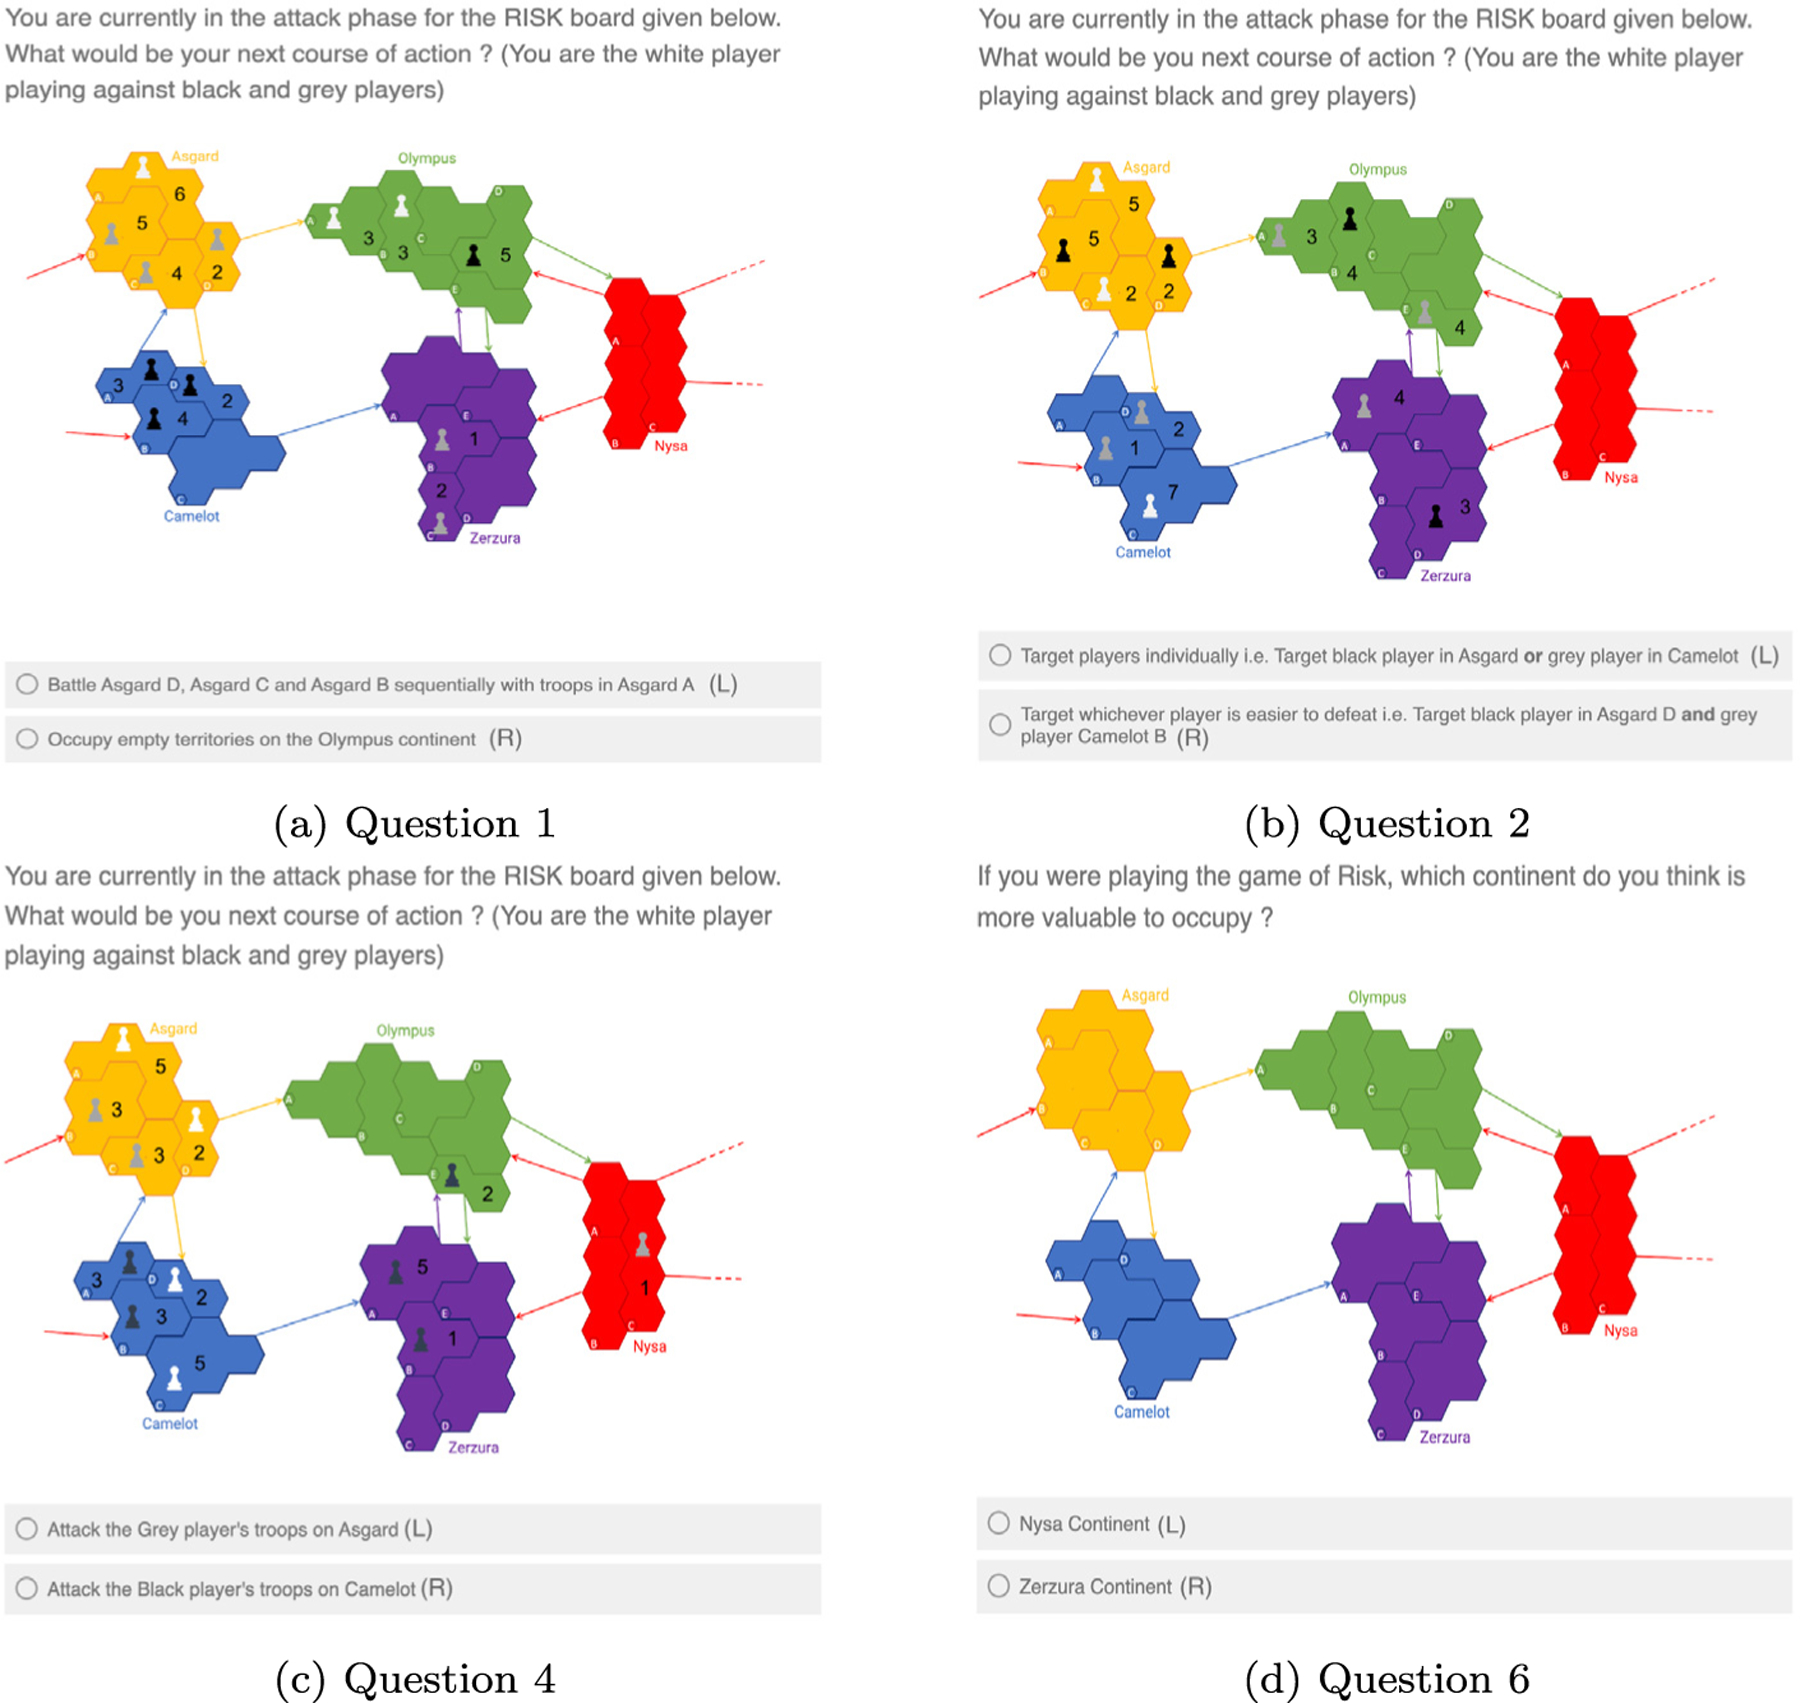
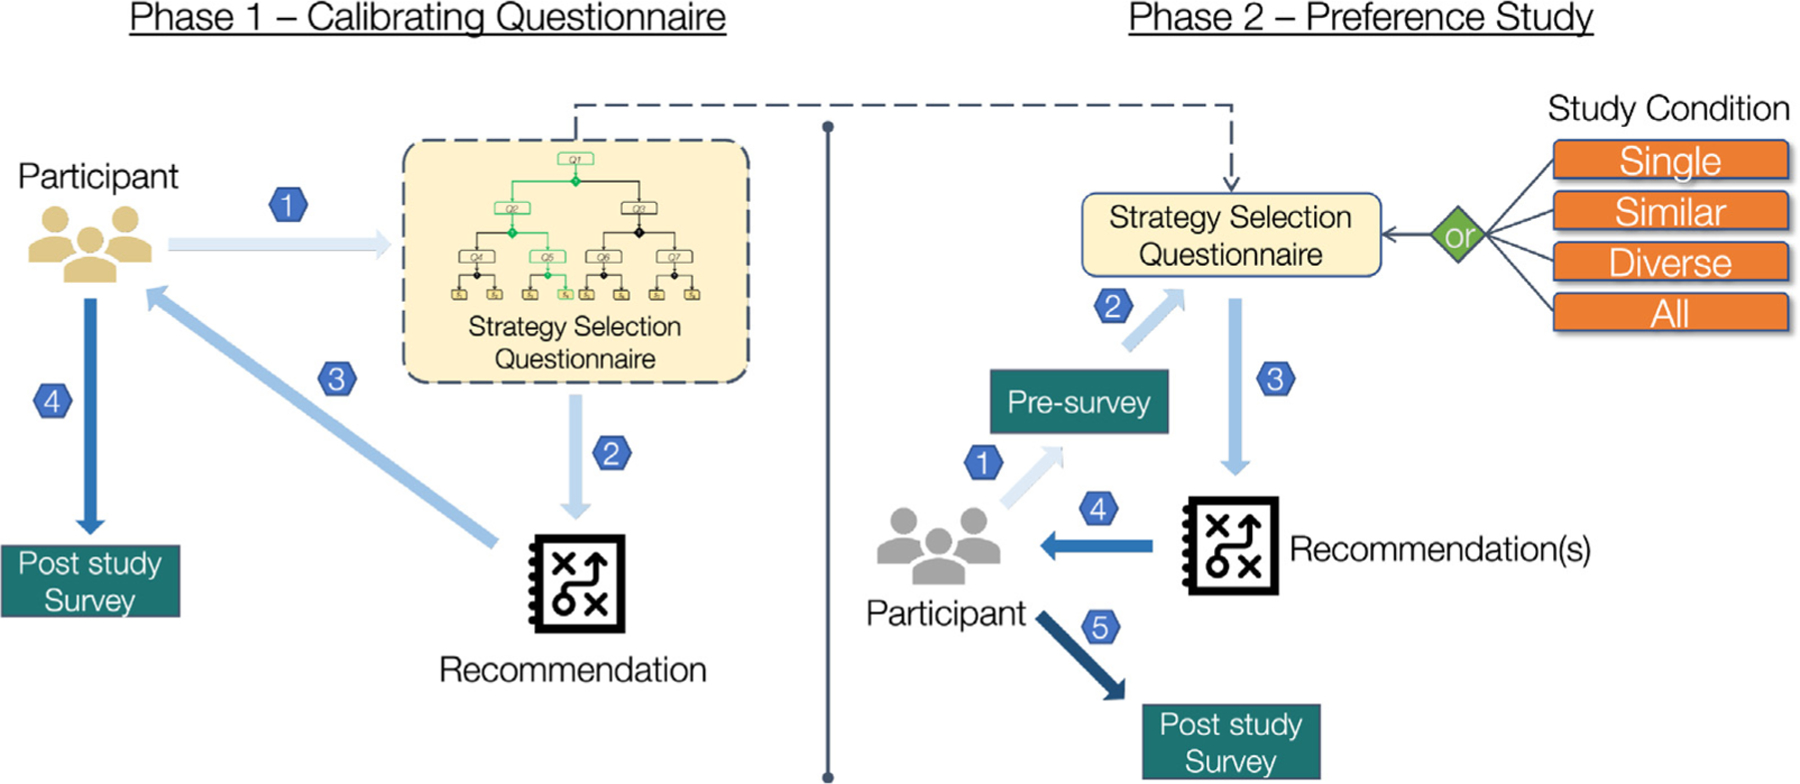
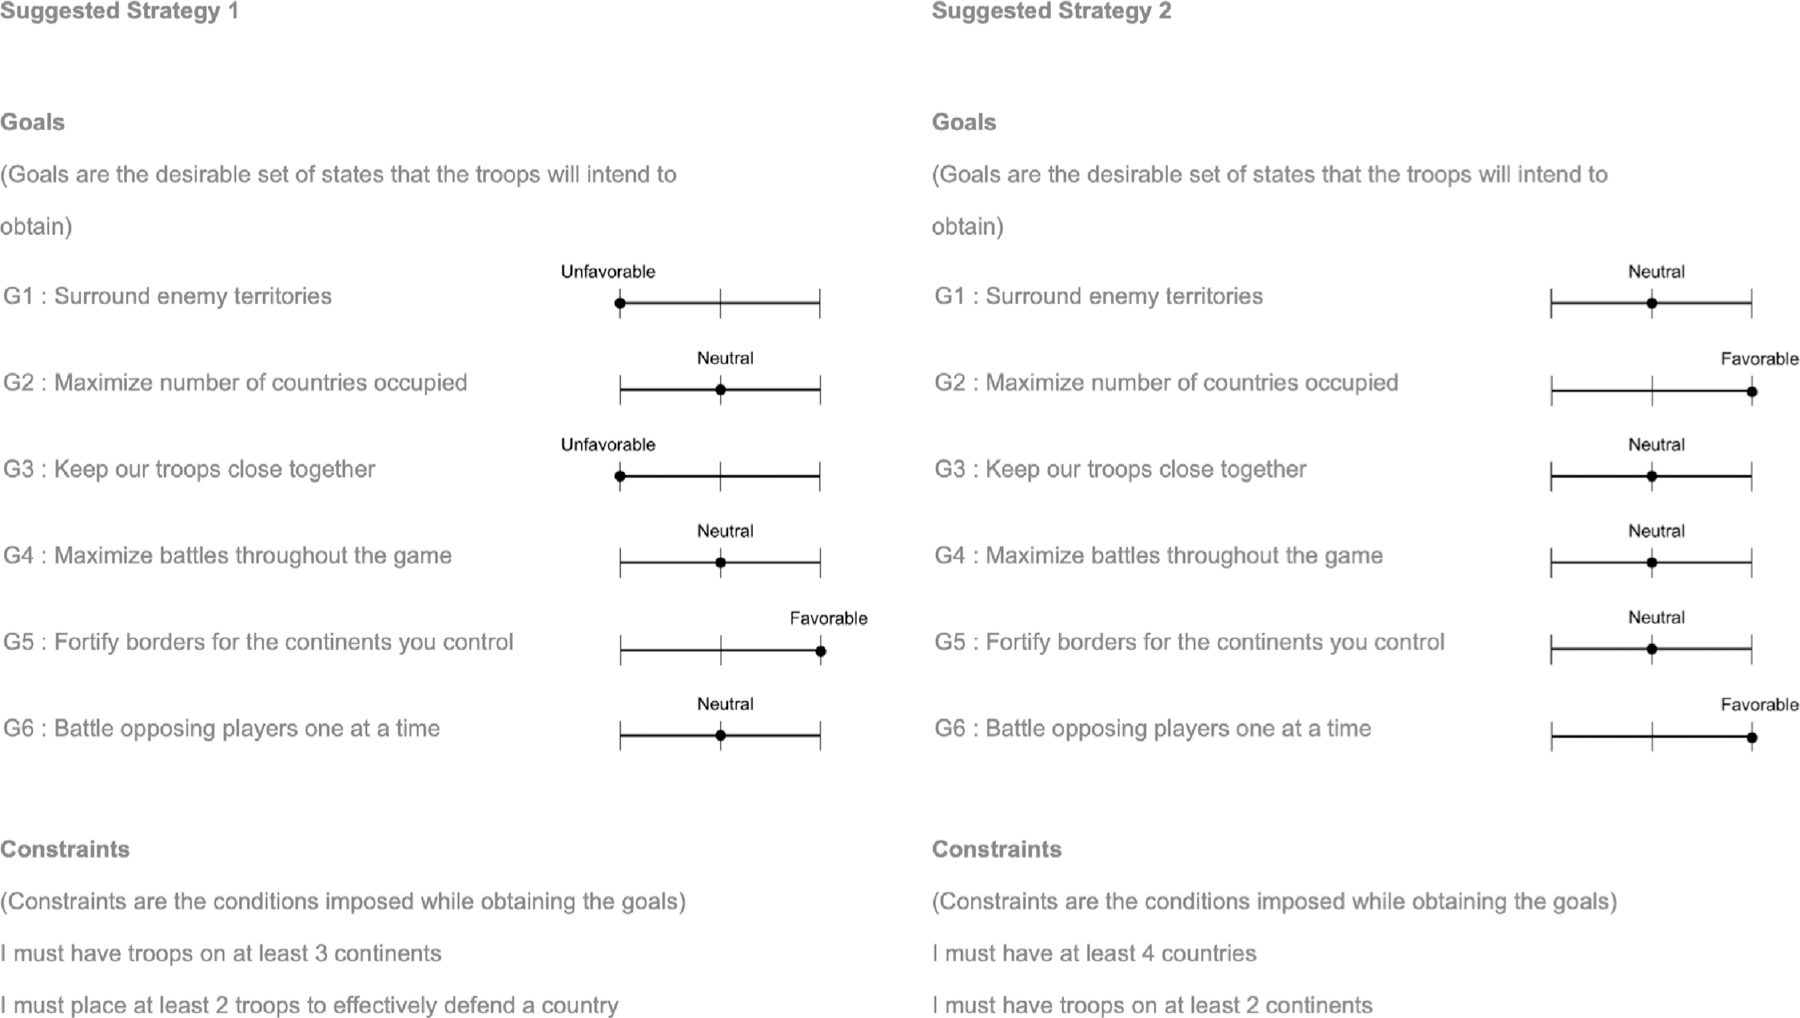
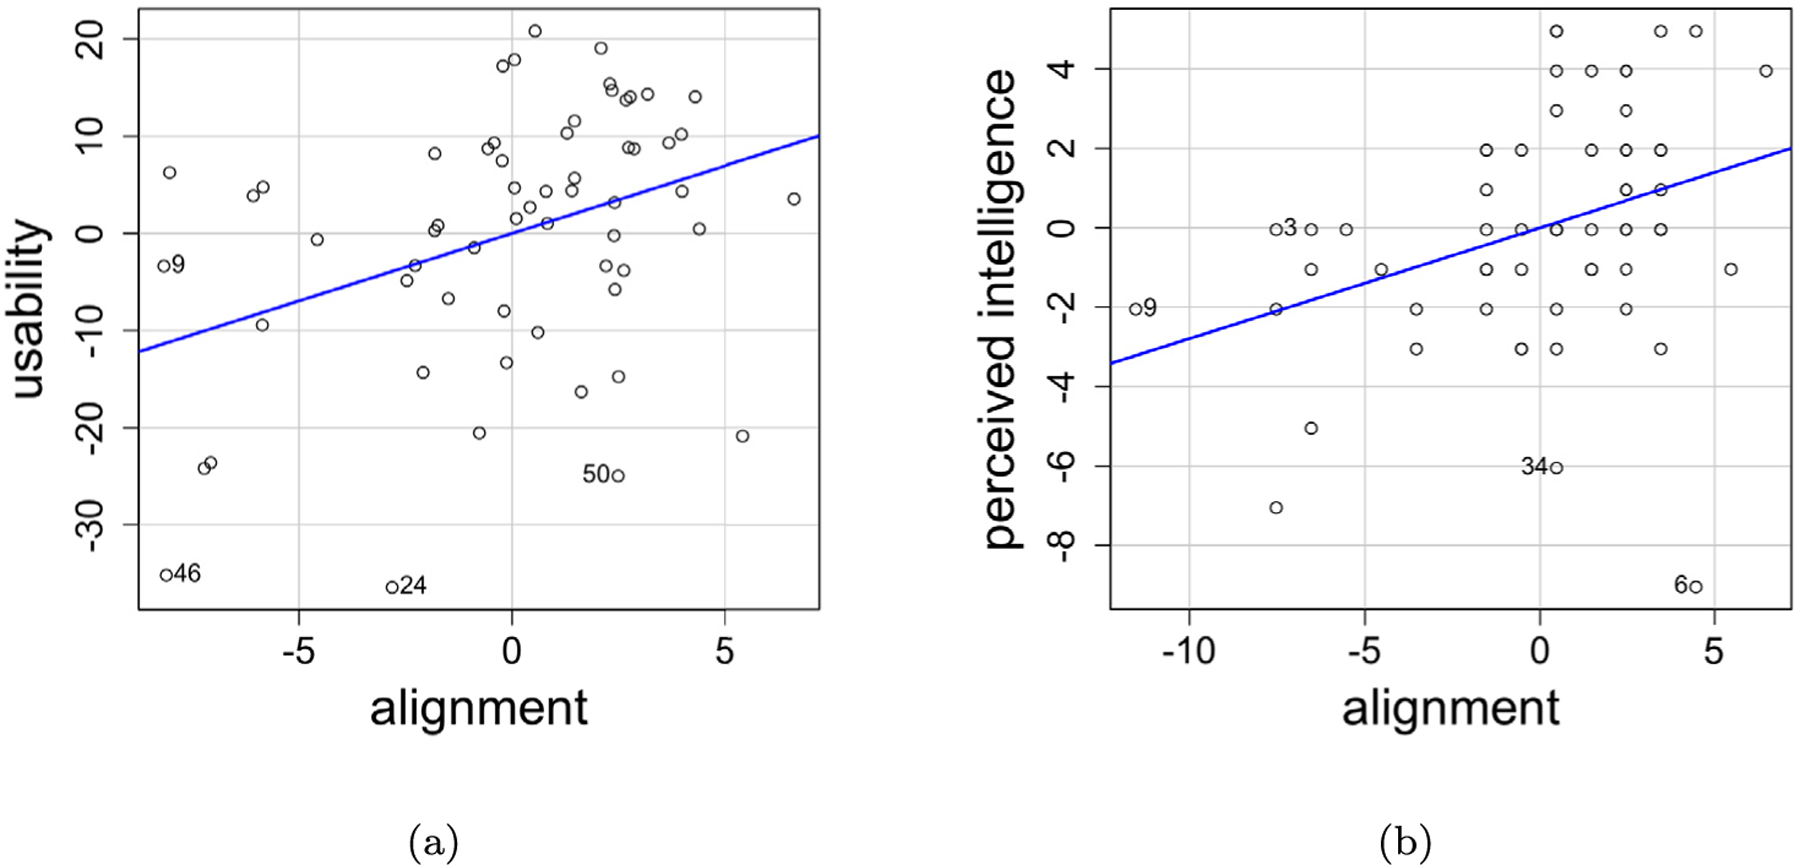
Artificial Intelligence is being employed by humans to collaboratively solve complicated tasks for search and rescue, manufacturing, etc. Efficient teamwork can be achieved by understanding user preferences and recommending different strategies for solving the particular task to humans. Prior work has focused on personalization of recommendation systems for relatively well-understood tasks in the context of e-commerce or social networks. In this paper, we seek to understand the important factors to consider while designing user-centric strategy recommendation systems for decision-making. We conducted a human-subjects experiment (n=60) for measuring the preferences of users with different personality types towards different strategy recommendation systems. We conducted our experiment across four types of strategy recommendation modalities that have been established in prior work: (1) Single strategy recommendation, (2) Multiple similar recommendations, (3) Multiple diverse recommendations, (4) All possible strategies recommendations. While these strategy recommendation schemes have been explored independently in prior work, our study is novel in that we employ all of them simultaneously and in the context of strategy recommendations, to provide us an in-depth overview of the perception of different strategy recommendation systems. We found that certain personality traits, such as conscientiousness, notably impact the preference towards a particular type of system (𝑝 < 0.01). Finally, we report an interesting relationship between usability, alignment, and perceived intelligence wherein greater perceived alignment of recommendations with one's own preferences leads to higher perceived intelligence (𝑝 < 0.01) and higher usability (𝑝 < 0.01).
Keywords: Design and evaluation of innovative interactive systems; Intelligent user interfaces; Interactive decision support systems.
Conflict of interest statement
Declaration of competing interest The authors declare the following financial interests/personal relationships which may be considered as potential competing interests: Matthew Gombolay reports financial support was provided by Office of Naval Research. Lakshita Dodeja reports financial support was provided by Office of Naval Research. Pradyumna Tambwekar reports financial support was provided by Office of Naval Research. Matthew Gombolay reports a relationship with Johns Hopkins University Applied Physics Laboratory that includes: consulting or advisory.
Figures


Similar articles
-
CourseQ: the impact of visual and interactive course recommendation in university environments.Res Pract Technol Enhanc Learn. 2021;16(1):18. doi: 10.1186/s41039-021-00167-7. Epub 2021 Jun 30. Res Pract Technol Enhanc Learn. 2021. PMID: 34226840 Free PMC article.
-
The Effectiveness of Integrated Care Pathways for Adults and Children in Health Care Settings: A Systematic Review.JBI Libr Syst Rev. 2009;7(3):80-129. doi: 10.11124/01938924-200907030-00001. JBI Libr Syst Rev. 2009. PMID: 27820426
-
User preference modeling for movie recommendations based on deep learning.Sci Rep. 2025 May 13;15(1):16592. doi: 10.1038/s41598-025-00030-5. Sci Rep. 2025. PMID: 40360567 Free PMC article.
-
Knowledge-based recommender systems: overview and research directions.Front Big Data. 2024 Feb 26;7:1304439. doi: 10.3389/fdata.2024.1304439. eCollection 2024. Front Big Data. 2024. PMID: 38469430 Free PMC article. Review.
-
User Models for Personalized Physical Activity Interventions: Scoping Review.JMIR Mhealth Uhealth. 2019 Jan 16;7(1):e11098. doi: 10.2196/11098. JMIR Mhealth Uhealth. 2019. PMID: 30664474 Free PMC article.
References
-
- Akpa OM, Unuabonah EI, 2011. Small-sample corrected Akaike information criterion: an appropriate statistical tool for ranking of adsorption isotherm models. Desalination 272 (1–3), 20–26.
-
- Anderson A, Maystre L, Anderson I, Mehrotra R, Lalmas M, 2020. Algorithmic effects on the diversity of consumption on spotify In: Proceedings of the Web Conference 2020. pp. 2155–2165.
-
- Bakir V, Laffer A, McStay A, 2023. Human-first, please: Assessing citizen views and industrial ambition for emotional AI in recommender systems. Surveill. Soc 21 (2), 205–222.
-
- Bartneck C, Kulić D, Croft E, Zoghbi S, 2009. Measurement instruments for the anthropomorphism, animacy, likeability, perceived intelligence, and perceived safety of robots. Int. J. Soc. Robotics 1 (1), 71–81.
-
- Behera RK, Gunasekaran A, Gupta S, Kamboj S, Bala PK, 2020. Personalized digital marketing recommender engine. J. Retail. Consum. Serv 53, 101799.
Grants and funding
LinkOut - more resources
Full Text Sources
