. 2024 Feb 20;27(4):109295.
doi: 10.1016/j.isci.2024.109295. eCollection 2024 Apr 19.

The effects of aging and hearing impairment on listening in noise

Affiliations

The effects of aging and hearing impairment on listening in noise

Ádám Boncz et al. iScience. .

Abstract

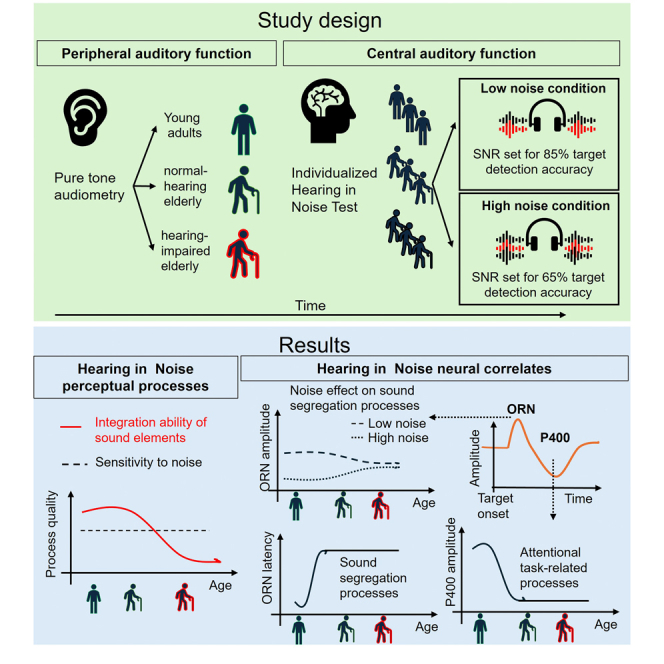
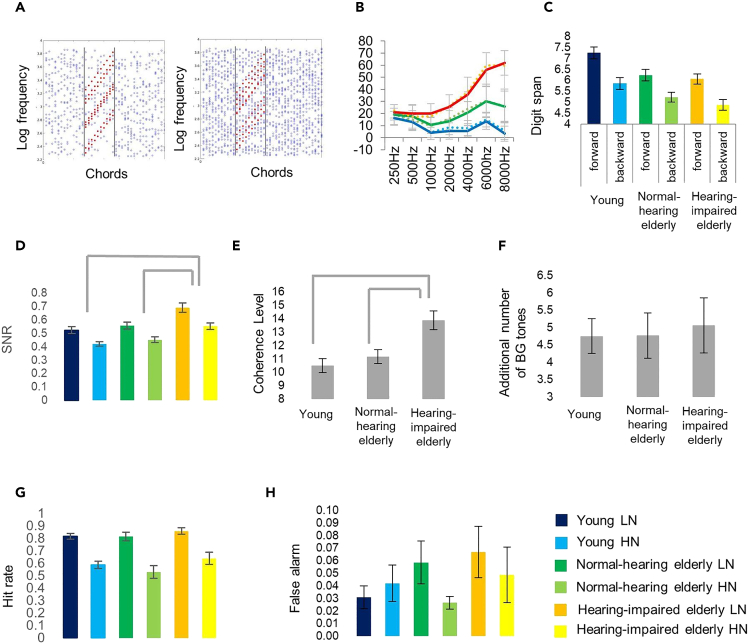
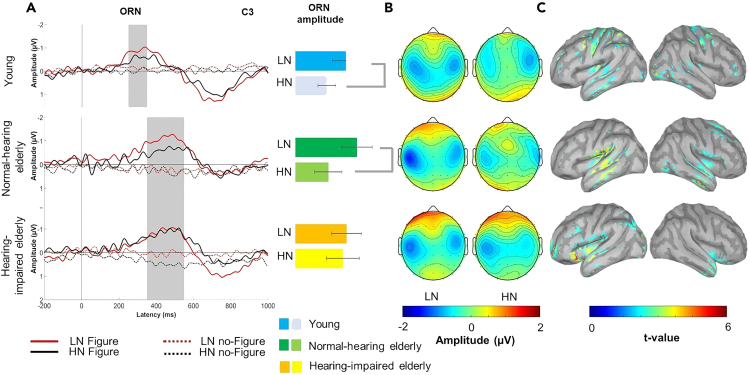
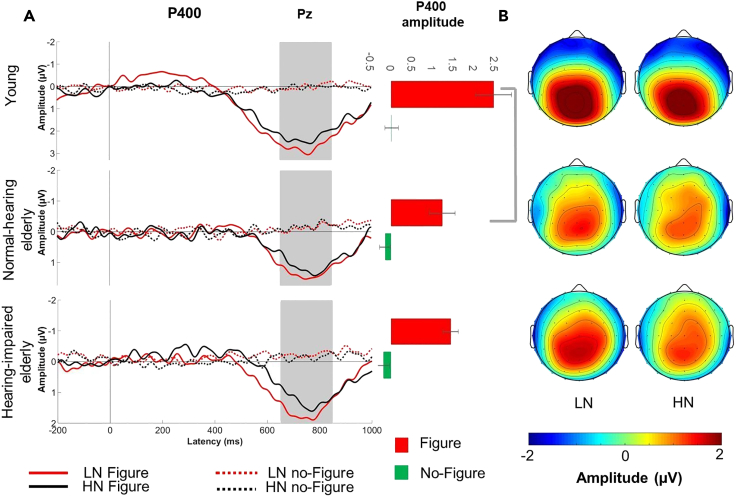
The study investigates age-related decline in listening abilities, particularly in noisy environments, where the challenge lies in extracting meaningful information from variable sensory input (figure-ground segregation). The research focuses on peripheral and central factors contributing to this decline using a tone-cloud-based figure detection task. Results based on behavioral measures and event-related brain potentials (ERPs) indicate that, despite delayed perceptual processes and some deterioration in attention and executive functions with aging, the ability to detect sound sources in noise remains relatively intact. However, even mild hearing impairment significantly hampers the segregation of individual sound sources within a complex auditory scene. The severity of the hearing deficit correlates with an increased susceptibility to masking noise. The study underscores the impact of hearing impairment on auditory scene analysis and highlights the need for personalized interventions based on individual abilities.

Keywords: Neuroscience; Sensory neuroscience.


Conflict of interest statement

The authors declare no competing interests.

Figures

None
Graphical abstract
Figure 1
Figure 1
Stimuli and behavioral results (A) Figure examples of stimuli for the low (LN) and high noise (HN) conditions, respectively. (B) Mean pure tone audiometry thresholds for the young, adult (blue line; N = 20), normal-hearing, elderly (green line; N = 13), and hearing-impaired older listeners across elderly groups (red line; N = 16) in the 250–8000 Hz range. Error bars depict SEM on all graphs. (C) Forward and backward digit span performance (corresponding to working memory capacity and control) for the three groups. (D) Mean SNR values were derived from the threshold detection tasks (across LN and HN) from the stimulus individualization procedure. (E) Mean figure coherence level derived from the first threshold detection task (and employed later in the FG segregation task) for the three groups. Mean Figure coherence level of the LN stimuli for the three groups; significant group differences (p < 0.01) are marked by gray lines above the bar charts. (F) Mean increase in the background tone number between the tones from LN to HN conditions for the three groups. (G and H) Behavioral performance (Hit rate and false alarm rate, respectively) in, separately for LN and HN; color labels are at the FG segregation task lower right corner of the figure.
Figure 2
Figure 2
EEG results: ORN response (A) Group-averaged (young adult: N = 20; normal-hearing elderly: N = 13; hearing-impaired older elderly: N = 16) central (C3; maximal ORN amplitude) ERP responses to figure (solid line) and no-figure (dashed line) related central (C3 lead) ORN elicited stimuli obtained in the LN (red) and the HN condition (black), respectively, for young normal-hearing and hearing-impaired older listeners.). Zero latency is at the onset of the figure event. Gray vertical bands show the measurement window for ORN while the yellow dashed line indicates the latency. The bar charts on the right side of ORN in young adults. On the panel shown on the right, the effect of NOISE is shown on the barplot for mean ORN amplitude of figure only trials, respectively, for amplitudes (with SEM) separately for the LN and HN conditions and groups. Significant NOISE effects (p < 0.05) are marked by gray lines beside the bar charts. (B) Scalp distribution of the ORN responses to Figure elicited ORN response, respectively, stimuli for the LN and HN conditions and groups with color scale below. (C) Source localization results of Brain areas sensitive to the NOISE effect (HN vs. LN condition) within the ORN time window. (C) Significant NOISE effect on source activity (current source density based on dSPM) found in young normal-hearing and hearing-impaired older adult groups separately. (Color scale below).
Figure 3
Figure 3
EEG results: P400 response (A) Group-averaged (young adult: N = 20; normal-hearing elderly: N = 13; hearing-impaired older elderly: N = 16) parietal (Pz; maximal P400 amplitude) ERP responses to figure (solid line) and no-figure (dashed line) related parietal (Pz lead) p400 elicited stimuli obtained in the LN (red) and the HN condition (black), respectively, for young normal-hearing and hearing-impaired older listeners.). Zero latency is at the onset of the figure event. Gray vertical bands show the measurement window for P400. On the right, the effect of FIGURE is shown the bar charts on the barplot for the right side of the panel show the mean P400 amplitude, respectively, for figure and no-figure trials (collapsed across LN and HN) and groups. Amplitudes (with SEM) separately for the LN and HN conditions. Significant group effects (p < 0.05) are marked by gray lines beside the bar charts. (B) Scalp distribution of figure elicited the P400 response, respectively, responses to figure stimuli for the LN and HN conditions and groups with color scale below.

Similar articles

References

    1. Prosser S., Turrini M., Arslan E. Effects of different noises on speech discrimination by the elderly. Acta Otolaryngol. 1991;111:136–142. doi: 10.3109/00016489109127268. - DOI - PubMed
    1. Tun P.A., Wingfield A. One voice too many: Adult age differences in language processing with different types of distracting sounds. J. Gerontol. B-Psychol. 1999;54:317–327. doi: 10.1093/geronb/54B.5.P317. - DOI - PubMed
    1. Schneider B.A., Daneman M., Murphy D.R., See S.K. Listening to discourse in distracting settings: the effects of aging. Psychol. Aging. 2000;15:110–125. doi: 10.1037/0882-7974.15.1.110. - DOI - PubMed
    1. Cardin V. Effects of aging and adult-onset hearing loss on cortical auditory regions. Front. Neurosci. 2016;10:199. doi: 10.3389/fnins.2016.00199. - DOI - PMC - PubMed
    1. Slade K., Plack C.J., Nuttall H.E. The effects of age-related hearing loss on the brain and cognitive function. Trends Neurosci. 2020;43:810–821. doi: 10.1016/j.tins.2020.07.005. - DOI - PubMed

LinkOut - more resources