[Preprint]. 2024 Mar 14:2024.03.13.584859.
doi: 10.1101/2024.03.13.584859.

Expanding the human gut microbiome atlas of Africa

Affiliations

Expanding the human gut microbiome atlas of Africa

Dylan G Maghini et al. bioRxiv. .

Update in

  • Expanding the human gut microbiome atlas of Africa.
    Maghini DG, Oduaran OH, Olubayo LAI, Cook JA, Smyth N, Mathema T, Belger CW, Agongo G, Boua PR, Choma SSR, Gómez-Olivé FX, Kisiangani I, Mashaba GR, Micklesfield L, Mohamed SF, Nonterah EA, Norris S, Sorgho H, Tollman S, Wafawanaka F, Tluway F, Ramsay M, Wirbel J; AWI-Gen 2 Collaborative Centre; Bhatt AS, Hazelhurst S. Maghini DG, et al. Nature. 2025 Feb;638(8051):718-728. doi: 10.1038/s41586-024-08485-8. Epub 2025 Jan 29. Nature. 2025. PMID: 39880958 Free PMC article.

Abstract

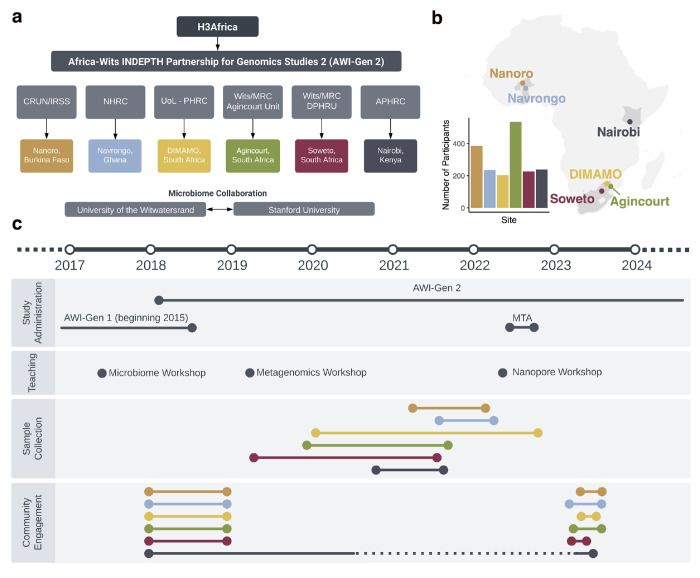
Population studies are crucial in understanding the complex interplay between the gut microbiome and geographical, lifestyle, genetic, and environmental factors. However, populations from low- and middle-income countries, which represent ~84% of the world population, have been excluded from large-scale gut microbiome research. Here, we present the AWI-Gen 2 Microbiome Project, a cross-sectional gut microbiome study sampling 1,803 women from Burkina Faso, Ghana, Kenya, and South Africa. By intensively engaging with communities that range from rural and horticultural to urban informal settlements and post-industrial, we capture population diversity that represents a far greater breadth of the world's population. Using shotgun metagenomic sequencing, we find that study site explains substantially more microbial variation than disease status. We identify taxa with strong geographic and lifestyle associations, including loss of Treponema and Cryptobacteroides species and gain of Bifidobacterium species in urban populations. We uncover a wealth of prokaryotic and viral novelty, including 1,005 new bacterial metagenome-assembled genomes, and identify phylogeography signatures in Treponema succinifaciens. Finally, we find a microbiome signature of HIV infection that is defined by several taxa not previously associated with HIV, including Dysosmobacter welbionis and Enterocloster sp. This study represents the largest population-representative survey of gut metagenomes of African individuals to date, and paired with extensive clinical biomarkers, demographic data, and lifestyle information, provides extensive opportunity for microbiome-related discovery and research.


Conflict of interest statement

Competing Interests The authors declare no competing interests.

Figures

Figure 1.
Figure 1.. Overview of the AWI-Gen 2 Microbiome study.
a) Organizational chart of the AWI-Gen 2 project. The partnership, funded by the National Institutes of Health under the umbrella of the Human Heredity and Health in Africa consortium (H3Africa), includes five Health and Demographic Surveillance Sites (HDSSs) and the Soweto Developmental Pathways for Health Research Unit (DPHRU). The HDSSs and DPHRU are managed by the Clinical Research Unit of Nanoro Institut de Recherche en Sciences de la Sante (CRUN/IRSS), Navrongo Health Research Centre (NHRC), University of Limpopo Population Health Research Centre (UoL - PHRC), University of the Witwatersrand and the South African Medical Research Council (Wits/MRC), and African Population Health and Research Center (APHRC). Researchers from Stanford University and the University of the Witwatersrand lead the microbiome analysis. b) Study site locations and number of participants recruited from each site. c) Timeline of the AWI-Gen 2 microbiome study research activities, including study administration, sample collection, and community engagement. During both AWI-Gen phases, researchers led microbiome and bioinformatic workshops for local researchers. Community engagement preceded sample collection at all sites, and participants with concerning health-related results were referred to their local healthcare facilities in accordance with site-specific protocols. Community engagement in Nairobi continued intermittently throughout sample collection to accommodate roadblocks during the COVID-19 pandemic.
Figure 2.
Figure 2.. Microbial composition and diversity in the AWI-Gen 2 Microbiome cohort.
a) Principal coordinate analysis of all samples based on Bray-Curtis distance on species-level prokaryotic profiles. Study site is colour-coded and the boxplots on the side and above show the samples per site projected onto the first and second principal coordinate. b) The Spearman correlation coefficient (Spearman’s rho) between principal coordinate values and relative abundance of prokaryotic phyla (and prokaryotic richness) is indicated by arrows. Phyla with an absolute correlation coefficient higher than 0.4 for either of the two principal coordinates are highlighted in blue. c) The amount of variance in the prokaryotic composition that is explained by various covariates in distance-based redundancy analysis is shown for all covariates that explain more than 0.5% of variance (SFig. 3). d) Prokaryotic richness (number of prokaryotic species present at ≥1e-04% abundance after rarefaction) per site(Kruskal-Wallis test p < 2e-16, n=1796). e) Phage richness (number of phage species clusters present in each sample, see Methods) per site (Kruskal-Wallis test p < 2e-16, n=1796). f) Pairwise comparisons between sites in prokaryotic and phage richness. Each tile corresponds to the results of a linear model comparing the richness between two different sites. The fill colour indicates if the richness is higher in site A (see x-axis) compared to site B (see y-axis of the heatmap). Stars indicate the significance (tested by ANOVA) after correction for multiple hypothesis testing using the Benjamini-Hochberg procedure (see Methods). Above the diagonal, prokaryotic richness is compared, whereas comparisons in phage richness are shown below the diagonal. For all boxplots, boxes denote the interquartile range (IQR) with the median as a thick black line and the whiskers extending up to the most extreme points within 1.5-fold IQR.
Figure 3.
Figure 3.. Site comparison reveals patterns of lifestyle-related microbiome transition.
a) The prevalence per site is shown for all prokaryotic species with prevalence higher than 5% in at least 2 sites (n=886 species), clustered using the Ward algorithm. Spearman correlation between sites is shown on the right. b) For the same species as in a), the number of bacterial species that have a high generalized fold change between sites (see Methods) is indicated by the thickness of the edge connecting two sites. c) The mean log10-transformed abundance of the same prokaryotic species as in a). Species that belong to the 10 genera with the highest variance in fold change across all sites (see Methods) are highlighted by colours. d) The log10 relative abundance of select genera are shown across the six different study sites (sites ordered by the clustering in a). See Fig. 2 for boxplot definitions.
Figure 4.
Figure 4.. Catalogue of novel microbial features.
a) Phylogenetic tree of 2,584 de-replicated bacterial metagenome-assembled genomes generated in this study. Outer ring indicates study site of origin, inner ring indicates assigned GTDB phylum, and leaf points indicate genomes that are novel relative to UHGG. Total number of novel and existing b) prokaryotic genomes, c) viral genomes, and d) prokaryotic proteins in the AWI-Gen assemblies, relative to existing databases for each feature. Only representative genomes and proteins after feature clustering are represented. Rarefaction curves of the number of e) prokaryotic genomes, f) viral genomes, and g) prokaryotic proteins detected as a function of the number of individuals sampled, by study site or from the full AWI-Gen sample set (grey). Each random subset was repeated a hundred times, and lines represent the mean feature count and standard deviation.
Figure 5.
Figure 5.. Features of Treponema succinifaciens metagenome-assembled genomes (MAGs).
a) Number of T. succinifaciens metagenome-assembled genomes by study site. b) Distribution of the length, in megabase pairs (Mbp), of each T. succinifaciens MAG. MAGs from Soweto are not pictured, as Soweto samples only contained two MAGs. c) Number of genes in each MAG that were classified as core (≥ 80% prevalence), shell (25 ≤ prevalence < 80%), or cloud genes (< 25% prevalence) in the complete MAG set. d) Midpoint-rooted phylogenetic tree of T. succinifaciens MAGs from this study (noted in pink inner ring) and public data sets (n = 513 total genomes). Middle ring indicates the country of origin, and outer ring indicates the continent of origin. White line and asterisk indicate the T. succinifaciens DSM 2489 type strain reference genome.
Figure 6.
Figure 6.. Microbial composition and diversity in people living with HIV.
a) Number of seronegative individuals (HIV−) and people living with HIV (PLWH) on antiretroviral treatment included for analysis. b) Prokaryotic richness (number of prokaryotic species present at ≥1e-04% abundance) by site and HIV status. Points represent individual samples. Differences in alpha diversity for each individual site were tested with ANOVA and for all sites combined with a linear mixed effect model accounting for site as a random effect. c) Principal coordinate analysis of all samples based on Bray-Curtis distance on species-level prokaryotic profiles. Points represent individual samples, coloured by study site, and PLWH are shaded. Boxplots on the side and below show the samples by HIV status projected onto the first and second principal coordinate. d) Differentially abundant species as determined by a linear mixed effect model accounting for confounders (see Methods). Species with q-value < 0.01 are shown and species with q-value < 1e-05 are annotated (see STable 3 for the full list). Shading indicates site-specific abundance fold change between seronegative individuals and PLWH. e) Receiver-operating characteristic (ROC) for machine learning models trained to distinguish HIV status on samples from each site or for all data combined. Shaded areas indicate the 95% confidence interval and numbers indicate area under the ROC curve (AU-ROC). f) AU-ROC values for machine learning model evaluation. Models trained on participants from each site were applied to the data from other sites and the external predictions were evaluated via AU-ROC (see Methods). In the leave-one-site-out (LOSO) validation, models were trained on data from two sites and validated on the left-out site (e.g. model trained on data from Soweto and Nairobi was evaluated on data from Agincourt). g) Fraction of samples from other sites predicted to be positive calibrated at a 5% false positive rate (indicated by dashed black line, see Methods). For DIMAMO, HIV status is known and therefore, the false positive rate and the true positive rate can be evaluated. Note that serostatus is not known for individuals in Nanoro and Navrongo but is expected to be below 2%. See Fig. 2 for boxplot definitions.

References

    1. Qin J. et al. A human gut microbial gene catalogue established by metagenomic sequencing. Nature 464, 59–65 (2010). - PMC - PubMed
    1. Human Microbiome Project Consortium. Structure, function and diversity of the healthy human microbiome. Nature 486, 207–214 (2012). - PMC - PubMed
    1. Lloyd-Price J. et al. Multi-omics of the gut microbial ecosystem in inflammatory bowel diseases. Nature 569, 655–662 (2019). - PMC - PubMed
    1. Zhou W. et al. Longitudinal multi-omics of host-microbe dynamics in prediabetes. Nature 569, 663–671 (2019). - PMC - PubMed
    1. Gacesa R. et al. Environmental factors shaping the gut microbiome in a Dutch population. Nature 604, 732–739 (2022). - PubMed

Publication types