

This is a preprint.
A framework for conducting time-varying genome-wide association studies: An application to body mass index across childhood in six multiethnic cohorts
- PMID: 38559031
- PMCID: PMC10980110
- DOI: 10.1101/2024.03.13.24304263
A framework for conducting time-varying genome-wide association studies: An application to body mass index across childhood in six multiethnic cohorts
Update in
-
A framework for conducting GWAS using repeated measures data with an application to childhood BMI.Nat Commun. 2024 Nov 20;15(1):10067. doi: 10.1038/s41467-024-53687-3. Nat Commun. 2024. PMID: 39567492 Free PMC article.
Abstract
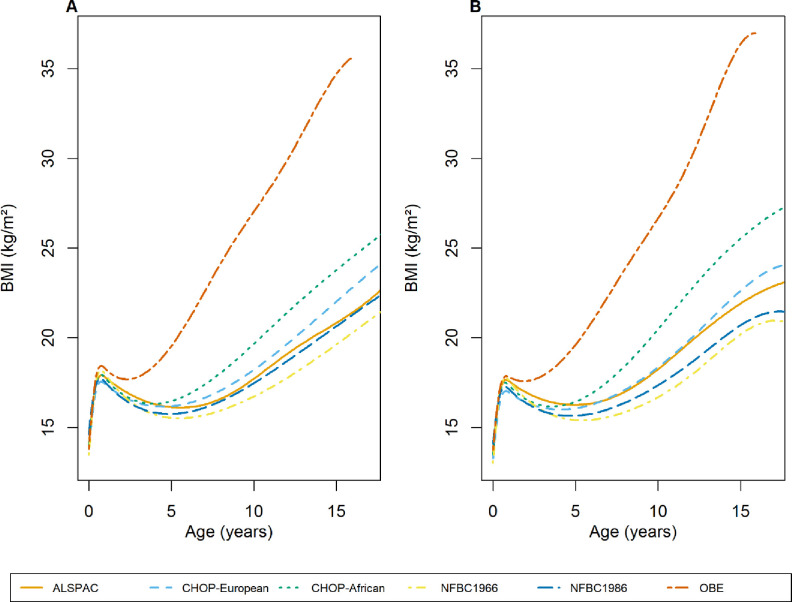
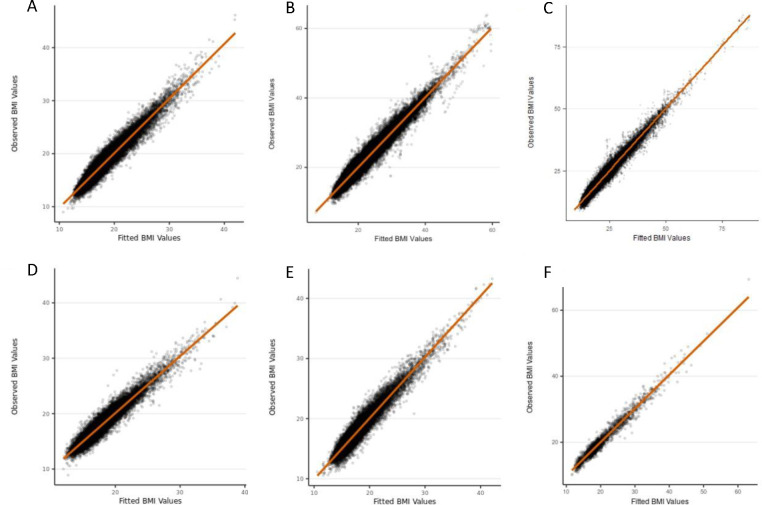
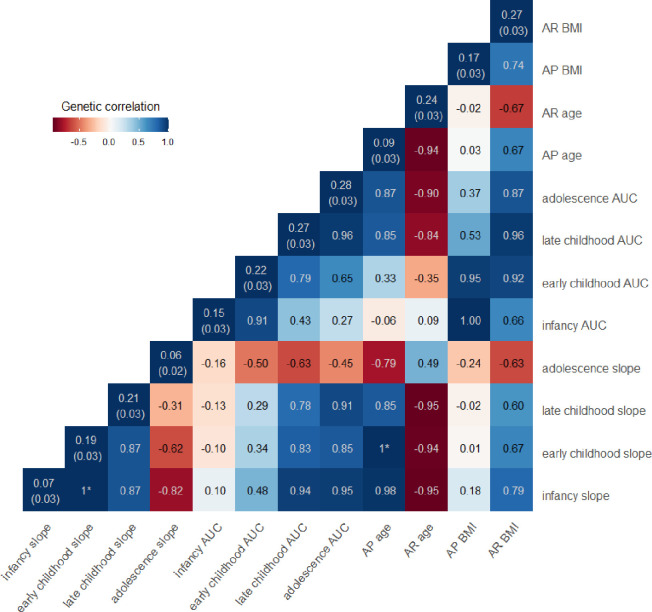
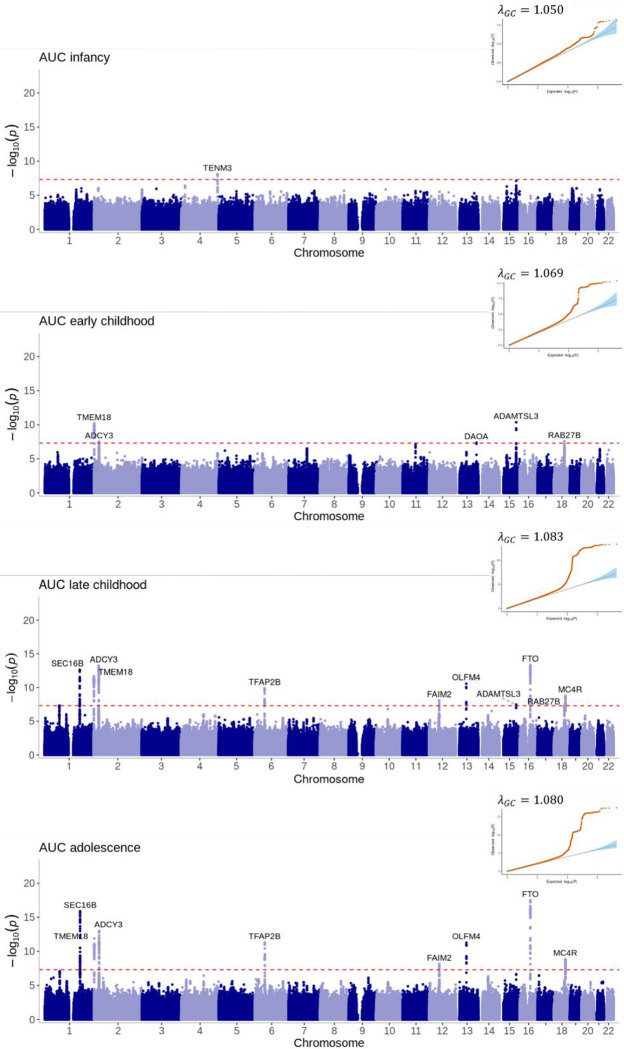
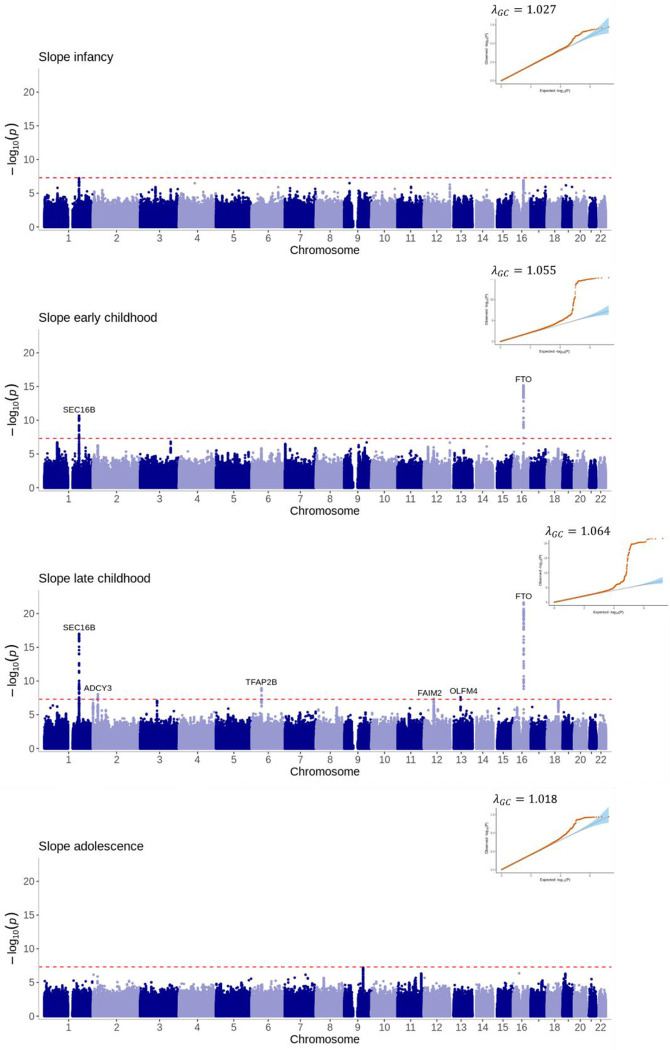
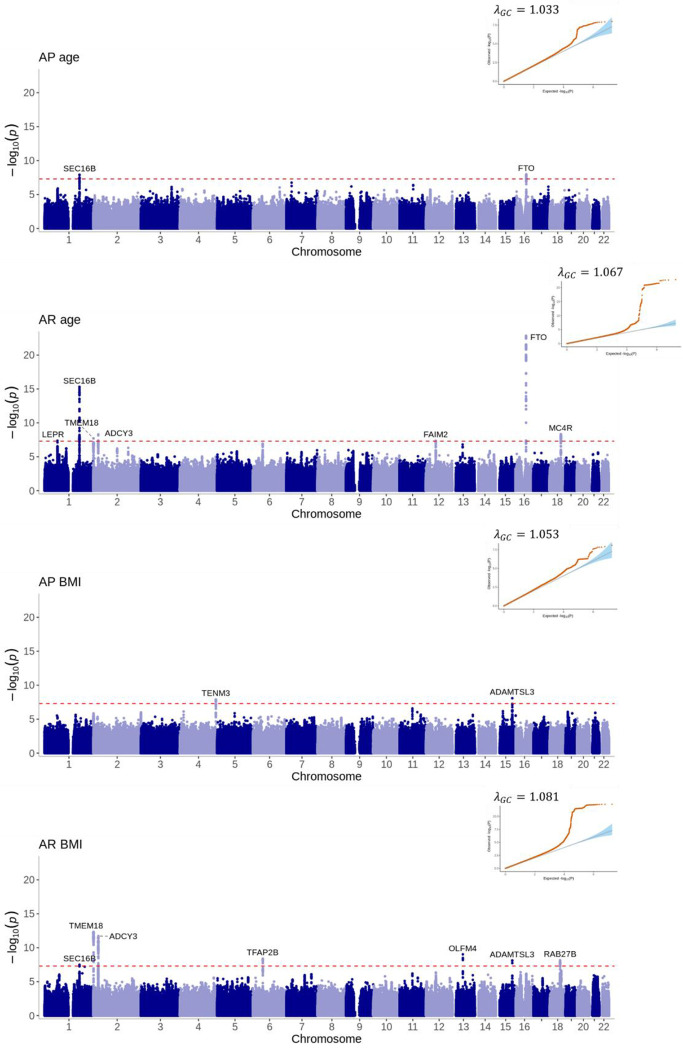
Genetic effects on changes in human traits over time are understudied and may have important pathophysiological impact. We propose a framework that enables data quality control, implements mixed models to evaluate trajectories of change in traits, and estimates phenotypes to identify age-varying genetic effects in genome-wide association studies (GWASs). Using childhood body mass index (BMI) as an example, we included 71,336 participants from six cohorts and estimated the slope and area under the BMI curve within four time periods (infancy, early childhood, late childhood and adolescence) for each participant, in addition to the age and BMI at the adiposity peak and the adiposity rebound. GWAS on each of the estimated phenotypes identified 28 genome-wide significant variants at 13 loci across the 12 estimated phenotypes, one of which was novel (in DAOA) and had not been previously associated with childhood or adult BMI. Genetic studies of changes in human traits over time could uncover novel biological mechanisms influencing quantitative traits.
Conflict of interest statement
Conflict of interest: DAL received support from Medtronic Ltd and Roche Diagnostics for research unrelated to that presented here. All other authors report no conflict of interest.
Figures
References
-
- Boughton Andrew P, Welch Ryan P, Flickinger Matthew, VandeHaar Peter, Taliun Daniel, Abecasis Gonçalo R, and Boehnke Michael. 2021. ‘LocusZoom.Js: Interactive and Embeddable Visualization of Genetic Association Study Results’. Bioinformatics 37 (18): 3017–18. 10.1093/bioinformatics/btab186. - DOI - PMC - PubMed
-
- Boyd Andy, Golding Jean, Macleod John, Lawlor Debbie A., Fraser Abigail, Henderson John, Molloy Lynn, Ness Andy, Ring Susan, and Smith George Davey. 2013. ‘Cohort Profile: The “Children of the 90s”—the Index Offspring of the Avon Longitudinal Study of Parents and Children’. International Journal of Epidemiology 42 (1): 111–27. 10.1093/ije/dys064. - DOI - PMC - PubMed
-
- Brand Judith S., Gaillard Romy, West Jane, McEachan Rosemary R. C., Wright John, Voerman Ellis, Felix Janine F., Tilling Kate, and Lawlor Deborah A.. 2019. ‘Associations of Maternal Quitting, Reducing, and Continuing Smoking during Pregnancy with Longitudinal Fetal Growth: Findings from Mendelian Randomization and Parental Negative Control Studies’. Edited by Minelli Cosetta. PLOS Medicine 16 (11): e1002972. 10.1371/journal.pmed.1002972. - DOI - PMC - PubMed
-
- Bulik-Sullivan Brendan K., Loh Po-Ru, Finucane Hilary K., Ripke Stephan, Yang Jian, Schizophrenia Working Group of the Psychiatric Genomics Consortium, Patterson Nick, Daly Mark J., Price Alkes L., and Neale Benjamin M.. 2015. ‘LD Score Regression Distinguishes Confounding from Polygenicity in Genome-Wide Association Studies’. Nature Genetics 47 (3): 291–95. 10.1038/ng.3211. - DOI - PMC - PubMed
Publication types
Grants and funding
LinkOut - more resources
Full Text Sources