[Preprint]. 2024 Mar 14:2024.03.13.584179.
doi: 10.1101/2024.03.13.584179.

Synthetic dosage-compensating miRNA circuits allow precision gene therapy for Rett syndrome

Affiliations

Synthetic dosage-compensating miRNA circuits allow precision gene therapy for Rett syndrome

Michael J Flynn et al. bioRxiv. .

Abstract

A longstanding challenge in gene therapy is expressing a dosage-sensitive gene within a tight therapeutic window. For example, loss of MECP2 function causes Rett syndrome, while its duplication causes MECP2 duplication syndrome. Viral gene delivery methods generate variable numbers of gene copies in individual cells, creating a need for gene dosage-invariant expression systems. Here, we introduce a compact miRNA-based, incoherent feed-forward loop circuit that achieves precise control of Mecp2 expression in cells and brains, and improves outcomes in an AAV-based mouse model of Rett syndrome gene therapy. Single molecule analysis of endogenous and ectopic Mecp2 mRNA revealed precise, sustained expression across a broad range of gene dosages. Delivered systemically in a brain-targeting AAV capsid, the circuit strongly suppressed Rett behavioral symptoms for over 24 weeks, outperforming an unregulated gene therapy. These results demonstrate that synthetic miRNA-based regulatory circuits can enable precise in vivo expression to improve the safety and efficacy of gene therapy.


Conflict of interest statement

Declaration of Interests A patent has been filed by the California Institute of Technology related to this work (US application number 17/100,857). M.B.E. is a scientific advisory board member or consultant at TeraCyte, Primordium, and Spatial Genomics.

Figures

Figure 1.
Figure 1.. Mathematical modeling predicts that incoherent feedforward loop circuits can maintain gene expression within a therapeutic window.
(A) Gene therapy contends with multiple sources of variability in expression. Ideally, all cells would receive the same number of viral genome copies, and express the correct amount of the therapeutic gene (upper left). However, viral uptake rates can vary greatly by organ and cell type (upper right), such that a dose that is therapeutic in one organ (e.g. brain, blue) may be toxic in another that takes up viral vectors at a higher rate (e.g. liver, red). With direct injection, cells close to the injection site receive more copies than cells farther away (lower left). Finally, even with correct mean delivery, viral uptake remains subject to stochastic variation (lower right). (B) The high level of expression induced by synthetic promoters commonly used in gene therapy may cause toxic overexpression from even a single transgene copy (left). Additionally, for X-linked genes like MECP2, approximately half of cells in affected females express a fully functioning endogenous copy. The gene therapy must not overexpress MeCP2 when its expression is added to the wildtype allele (right). (C) Schematic of an incoherent feedforward loop motif in which a therapeutic gene is co-expressed with its own negative regulator. (D) Therapeutic gene expression as a function of gene dosage, as modeled for an idealized IFFL. The increasingly negative action of the repressor (R, black) compensates for increases in gene dosage, leading to regimes where large changes in gene dosage yield nearly the same output expression of the circuit (blue), preventing overexpression. (E) Simulated distributions of therapeutic gene expression at different viral MOI, either unregulated (left) or regulated by an IFFL (right), compared to a target endogenous expression distribution (blue). Simulations incorporate stochastic viral uptake, bursty transcription, and stochastic enzyme kinetics as well as an offset between single-copy expression and the endogenous level of a therapeutic gene. The IFFL circuit compensates for these sources of variation.
Figure 2.
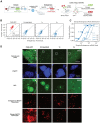
Figure 2.. Synthetic miRNA IFFLs can adapt to variations in gene dosage in cell culture.
(A) Designs of 3 constructs based on a divergent promoter producing MeCP2-EGFP in the forward direction and the mRuby3 dosage indicator in the reverse. The first circuit, labeled “unregulated”, has no miRNA targets and no miRNA cassette and serves as an unregulated control. The second (1x) and third (4x) circuits contain a miRNA cassette located within a synthetic intron in the 3’ UTR of Mecp2-EGFP, which respectively targets 1 or 4 fully complementary miRNA target sites upstream of the intron. All constructs are less than 4300 bp and fit inside an AAV. (B) Workflow to characterize circuit performance at both the mRNA and protein levels. For protein, U2OS cells were transiently transfected, cultured for 48 hours, and had protein expression measured by flow cytometry (upper path). For mRNA, U2OS cells were transiently transfected, incubated for 48 hours, fixed, and then analyzed with smFISH and confocal microscopy (lower path). (C) MeCP2-EGFP protein fluorescence as a function of mRuby3 dosage indicator for the 3 constructs, as measured by flow cytometry. MeCP2-EGFP was proportional to dosage for the unregulated construct (gray), as expected. For the 1x construct (medium blue), the slope was reduced, indicating a decreased responsiveness to dosage. For the 4x construct (dark blue), MeCP2-EGFP expression was nearly independent of dosage over 2.5 orders of magnitude variation in gene dosage (framed region). This stable expression level was approximately 3-fold above the fluorescence of untransfected cells (dashed black line). Here, and in D, shaded regions represent ±1 standard deviation of the logarithmic expression values. (D) Mecp2-EGFP transcript count as a function of average mRuby3 fluorescence, as measured by smFISH and confocal microscopy. The relationship between Mecp2-EGFP transcripts and dosage indicator fluorescence largely agreed with the protein-level results for each construct. The 4x construct produced an expression level that varied less than 4-fold over a greater than 300-fold range of dosage (framed region). (E) smFISH imaging of ectopic Mecp2-EGFP transcripts (upper row) and protein (middle row), as well as mRuby dosage indicator (lower row). Cells displayed comparable levels of mRuby protein in all conditions (bottom row), while Mecp2-EGFP expression decreases with stronger IFFL regulation at both transcript (upper) and protein (middle) levels.
Figure 3.
Figure 3.. Synthetic miRNA IFFLs regulate expression to near or below endogenous Mecp2 levels in mouse brains.
(A) Orthogonal HCR probes were designed to specifically target endogenous or ectopic Mecp2. Ectopic Mecp2-EGFP was targeted with HCR probes against the EGFP coding sequence. Endogenous Mecp2 was targeted with HCR probes against sequences in the endogenous 3’ UTR which do not appear in the ectopic construct. Mice were injected with viral constructs and, after 3 weeks of expression, brain slices were analyzed by HCR and confocal microscopy. (B) Ectopic (y-axis) vs endogenous (x-axis) transcripts measured in single cells (Methods). The diagonal black line denotes equal expression. Red dots denote cells whose counts have been corrected to account for dense dot spacing (Methods, Supplementary Figure 3). CAG-EGFP expressed ectopic transcript at levels an order of magnitude greater than endogenous Mecp2 transcripts. The unregulated, 1x, and 4x constructs showed progressively reduced ectopic expression, with the 1x construct matching endogenous Mecp2 transcript levels, and the 4x construct expressing lower levels. (C) Distributions of the ectopic to endogenous Mecp2 transcripts in single cells. Annotations denote the 10th, 50th and 90th percentiles. The median cell receiving the unregulated construct overexpressed ectopic Mecp2 by a factor of 2.1 relative to endogenous levels. With the 1x circuit, the median cell expressed ectopic Mecp2 at 0.8 times the endogenous level. However, 10% of cells overexpressed ectopic Mecp2 by a factor of at least 2.3. The median cell receiving the 4x construct only expressed 0.14 ectopic transcripts per endogenous transcript, but few cells overexpressed Mecp2. (D) Sample HCR images, focusing on individual cells in a field of cortical neurons (first row, white boxes denote enlarged areas below). All cells exhibited similar endogenous Mecp2 expression (fourth row), but decreasing ectopic MeCP2-EGFP protein (third row) and ectopic Mecp2 transcripts (fifth row) from CAG-GFP to unregulated to 1x to 4x constructs. (*) Brightness of CAG-GFP image has been reduced to better distinguish cells. (**) Brightness of the 4x-GFP image has been increased to make the dimmer fluorescence of MeCP2 nuclear puncta more visible.
Figure 4.
Figure 4.. IFFL-regulated gene therapy outperforms unregulated gene therapy in a mouse model of Rett syndrome.
(A) Female Mecp2-/X mice were divided into 4 treatment groups: uninjected or injected with one of the 3 constructs (Figure 2A) packaged in AAV-CAP.B22. Female wildtype littermates were included as healthy controls. At 4 weeks of age, baseline Rett behavior scores were recorded and the mice were injected with 1×10¹⁴ vg/kg. Rett phenotype scores (21) were then measured biweekly for 24 weeks. (B) Rett behavior (RTT) scores over time for individual mice (colored tracks) in each group. In each of the uninjected control, unregulated, and 1x groups, 1 mouse died during the study (“X” marker). In the 4x and wildtype groups, no mice died. After 22 weeks, 2 mice were removed from both the uninjected control group and the unregulated group for another experiment (“O” marker). (C) Mean score trajectories for each group in (B). Legend in left column of (B). (D) Rett behavior scores averaged across all timepoints for each mouse. Orange bars denote the median of each group. Mice that received the 4x construct had mean scores significantly lower than both the uninjected mice (bootstrap p=0.003) and mice that received the unregulated construct (bootstrap p=0.01). The standard deviation of the 4x group, 0.30, was also significantly lower than that of the unregulated group, 1.04 (bootstrap p=0.02). The mean scores of the wildtype controls were significantly lower than the uninjected controls (bootstrap p=0.0003) and mice receiving the unregulated (bootstrap p=0.001) and the 4x (bootstrap p=0.01) constructs. (E) Ectopic vs endogenous Mecp2 transcripts quantified in single cells of mouse brains after behavior experiments were completed (week 28). Brain slices were analyzed by HCR as in Figure 3. Despite continuous expression for 24 weeks, ectopic and endogenous levels remained similar for each construct. (F) Distribution of the ratios of ectopic to endogenous transcripts in single cells after 24 weeks of expression (cf. Figure 3C). The unregulated construct overexpressed Mecp2 by a factor of 3 at the median, while the 1x construct roughly agreed at the median, but overexpressed in the tail. The 4x construct was expressed below endogenous levels at the median, with fewer overexpressing cells.

References

    1. Mendell J. R., Al-Zaidy S., Shell R., Arnold W. D., Rodino-Klapac L. R., Prior T. W., Lowes L., Alfano L., Berry K., Church K., Kissel J. T., Nagendran S., L’Italien J., Sproule D. M., Wells C., Cardenas J. A., Heitzer M. D., Kaspar A., Corcoran S., Braun L., Likhite S., Miranda C., Meyer K., Foust K. D., Burghes A. H. M., Kaspar B. K., Single-Dose Gene-Replacement Therapy for Spinal Muscular Atrophy. N. Engl. J. Med. 377, 1713–1722 (2017). - PubMed
    1. Nathwani A. C., Reiss U. M., Tuddenham E. G. D., Rosales C., Chowdary P., McIntosh J., Della Peruta M., Lheriteau E., Patel N., Raj D., Riddell A., Pie J., Rangarajan S., Bevan D., Recht M., Shen Y.-M., Halka K. G., Basner-Tschakarjan E., Mingozzi F., High K. A., Allay J., Kay M. A., Ng C. Y. C., Zhou J., Cancio M., Morton C. L., Gray J. T., Srivastava D., Nienhuis A. W., Davidoff A. M., Long-term safety and efficacy of factor IX gene therapy in hemophilia B. N. Engl. J. Med. 371, 1994–2004 (2014). - PMC - PubMed
    1. George L. A., Sullivan S. K., Giermasz A., Rasko J. E. J., Samelson-Jones B. J., Ducore J., Cuker A., Sullivan L. M., Majumdar S., Teitel J., McGuinn C. E., Ragni M. V., Luk A. Y., Hui D., Wright J. F., Chen Y., Liu Y., Wachtel K., Winters A., Tiefenbacher S., Arruda V. R., van der Loo J. C. M., Zelenaia O., Takefman D., Carr M. E., Couto L. B., Anguela X. M., High K. A., Hemophilia B Gene Therapy with a High-Specific-Activity Factor IX Variant. N. Engl. J. Med. 377, 2215–2227 (2017). - PMC - PubMed
    1. Ozelo M. C., Mahlangu J., Pasi K. J., Giermasz A., Leavitt A. D., Laffan M., Symington E., Quon D. V., Wang J.-D., Peerlinck K., Pipe S. W., Madan B., Key N. S., Pierce G. F., O’Mahony B., Kaczmarek R., Henshaw J., Lawal A., Jayaram K., Huang M., Yang X., Wong W. Y., Kim B., GENEr8–1 Trial Group, Valoctocogene Roxaparvovec Gene Therapy for Hemophilia A. N. Engl. J. Med. 386, 1013–1025 (2022). - PubMed
    1. Russell S., Bennett J., Wellman J. A., Chung D. C., Yu Z.-F., Tillman A., Wittes J., Pappas J., Elci O., McCague S., Cross D., Marshall K. A., Walshire J., Kehoe T. L., Reichert H., Davis M., Raffini L., George L. A., Hudson F. P., Dingfield L., Zhu X., Haller J. A., Sohn E. H., Mahajan V. B., Pfeifer W., Weckmann M., Johnson C., Gewaily D., Drack A., Stone E., Wachtel K., Simonelli F., Leroy B. P., Wright J. F., High K. A., Maguire A. M., Efficacy and safety of voretigene neparvovec (AAV2-hRPE65v2) in patients with RPE65-mediated inherited retinal dystrophy: a randomised, controlled, open-label, phase 3 trial. Lancet 390, 849–860 (2017). - PMC - PubMed

Publication types