[Preprint]. 2024 Dec 11:2024.02.28.582647.
doi: 10.1101/2024.02.28.582647.

RNA Polymerase II hypertranscription at histone genes in cancer FFPE samples

Affiliations

RNA Polymerase II hypertranscription at histone genes in cancer FFPE samples

Steven Henikoff et al. bioRxiv. .

Update in

  • RNA polymerase II at histone genes predicts outcome in human cancer.
    Henikoff S, Zheng Y, Paranal RM, Xu Y, Greene JE, Henikoff JG, Russell ZR, Szulzewsky F, Thirimanne HN, Kugel S, Holland EC, Ahmad K. Henikoff S, et al. Science. 2025 Jan 2;387(6735):737-743. doi: 10.1126/science.ads2169. Epub 2025 Feb 13. Science. 2025. PMID: 39946483 Free PMC article.

Abstract

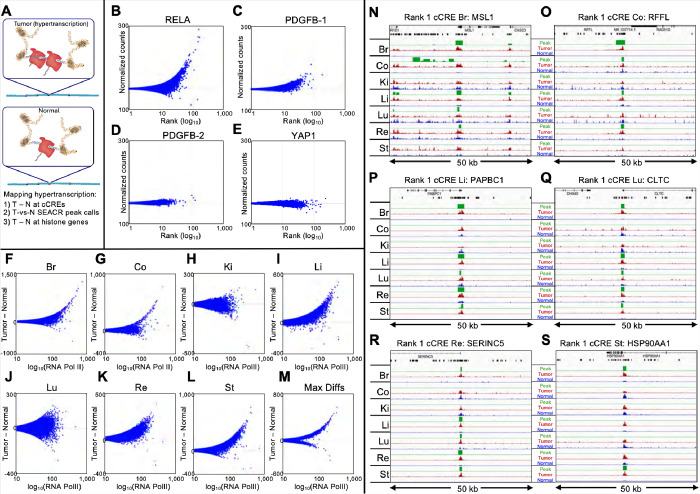
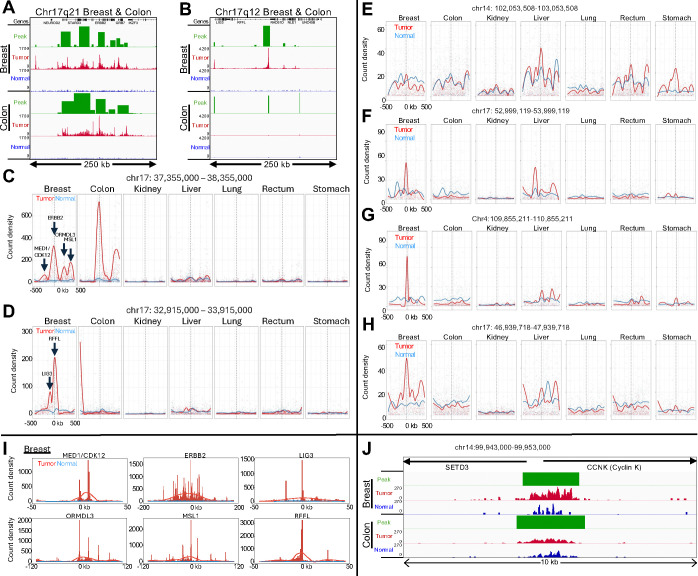
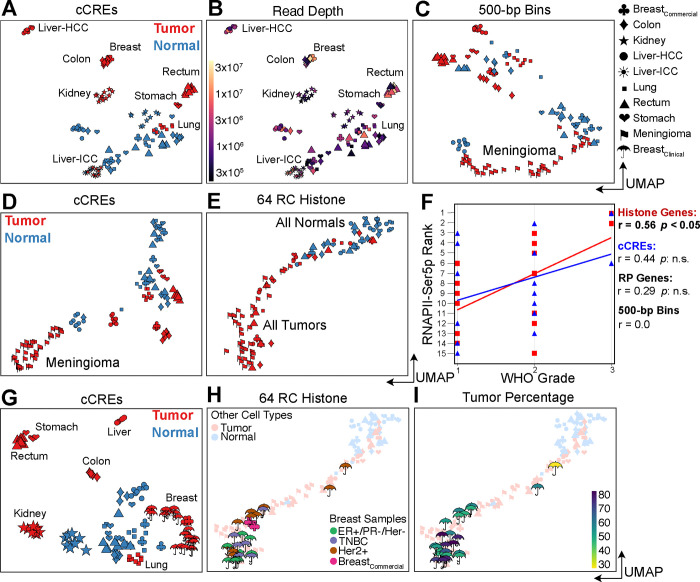
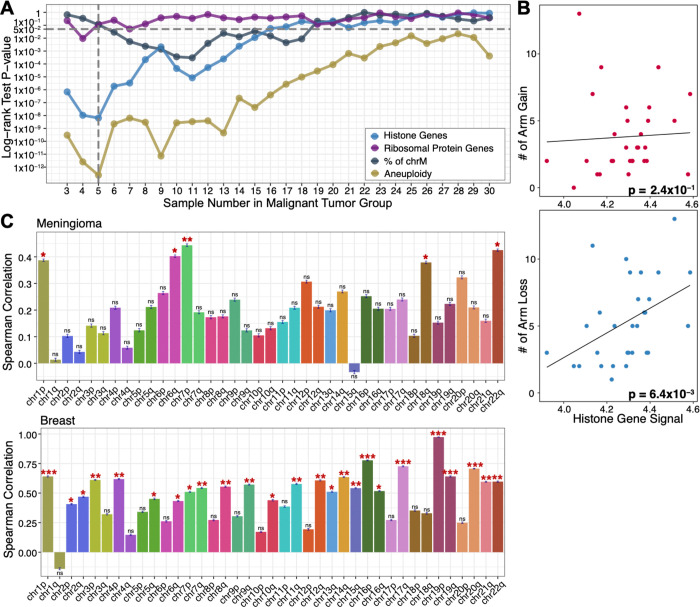
Genome-wide hypertranscription is common in human cancer and predicts poor prognosis. To understand how hypertranscription might drive cancer, we applied our FFPE-CUTAC method for mapping RNA Polymerase II (RNAPII) genome-wide in formalin-fixed paraffin-embedded (FFPE) sections. We demonstrate global RNAPII elevations in mouse gliomas and assorted human tumors in small clinical samples and discover regional elevations corresponding to de novo HER2 amplifications punctuated by likely selective sweeps. RNAPII occupancy at replication-coupled histone genes correlated with WHO grade in meningiomas, accurately predicted rapid recurrence, and corresponded to whole-arm chromosome losses. Elevated RNAPII at histone genes in meningiomas and diverse breast cancers is consistent with histone production being rate-limiting for S-phase progression and histone gene hypertranscription driving overproliferation and aneuploidy in cancer, with general implications for precision oncology.

Keywords: Centromeres; Epigenomics; Gene Regulation; HER2 amplification; Meningioma; Mitochondrial DNA; Whole-arm aneuploidy.


Conflict of interest statement

Competing interests S.H. is an inventor in a USPTO patent application filed by the Fred Hutchinson Cancer Center pertaining to CUTAC and FFPE-CUTAC (application number 63/505,964). The remaining authors declare no competing interests.

Figures

Figure 1:
Figure 1:. RNAPII-Ser5p FFPE-CUTAC directly maps hypertranscription.
(A) Model for hypertranscription in cancer: Paused RNA Polymerase II (RNAPII) at active gene regulatory elements such as promoters and enhancers increases on average over the cell cycle, resulting in a net proportional gain in RNAPII occupancy across the genome. Using RNAPII FFPE-CUTAC we can map hypertranscription genome-wide using three complementary approaches: 1) Genome-scaled Tumor (T) minus Normal (N) counts at cCREs, 2) T − N at replication-coupled histone genes and 3) SEACR Tumor peak calls using Normal as the background control. (B-E) T − N versus log(T + N)/2 plots showing hypertranscription mapped over the 343,731 annotated mouse cCREs for tumor and normal sections dissected post-tagmentation from a 10 micron FFPE slice from each of four different paraffin blocks. Hypertranscription of a cCRE is defined as the excess of RNAPII-Ser5p in the indicated tumor over normal (Tumor minus Normal in normalized count units for Mm10-mapped fragments pooled from the same slide). (F-M) All fragments were pooled from four slides from the same paraffin block and the number of fragments equalized between tumor and normal for each of the seven cancers. T − N versus log(T + N)/2 plots showing hypertranscription mapped over the 984,834 annotated mouse cCREs for tumor and matched normal sections from 5 micron FFPE slices. Max Diffs displays the Tumor minus Normal maximum of the seven samples for each cCRE. (N-O) For each of the indicated tumors, tracks are shown for 50-kb regions around the #1-ranked cCRE based on Tumor (dark red) and Normal (blue) counts. Raw data tracks were group-autoscaled together for tumor (red) and normal (blue), where SEACR Tumor peak calls (green) use Normal as the negative control. Gene annotations and cCREs (black rectangles) are shown at the top.
Figure 2:
Figure 2:. RNAPII levels identify likely HER2 amplifications and regions of linkage disequilibrium.
(A-B) Normalized count tracks and SEACR peak calls for the 250-kb region on Chromosome 17q21 (A) and for the 250-kb 17q12 region (B) amplified in the breast tumor but evidently not in the colon tumor. Tracks were group-autoscaled together for Tumor (red) and Normal (blue), where SEACR Tumor peak calls (green) use Normal as the negative control. Broad regions of prominent RNAPII hypertranscription indicate likely HER2 amplifications in both tumors. (C-D) Bins of 1-kb were tiled over each 1 Mb region centered on the highest peak in Chr17q21 (C) corresponding to the ERBB2 promoter in Chr17q21, and the RFFL promoter in Chr17q12 (D), and count density within each bin is plotted with curve-fitting and smoothing. Each of the six summits in the Breast tumor sample is centered over the promoter peak indicated by an arrow. (E-H) Same as (C-D) for top-ranked loci outside of the HER2 amplicon. (I) Individual broad summits in (D-E) were zoomed-in and rescaled on the x-axis centered over the indicated promoter peak and superimposed over data tracks scaled to the height of the central peak. (J) Data tracks for the CCNK promoter region, where the normalized count increase in the Breast tumor relative to normal over the 10-kb region shown is 5.4-fold and for Colon is 2.1-fold. The range for the other five tumors is 0.9–2.5.
Figure 3:
Figure 3:. RNAPII over histone genes correlates with aggressiveness in meningiomas (A-F) and breast tumors (G-I).
(A) UMAP of 114 human tumor samples and replicates including those from 30 meningiomas. HCC: Hepatocellular carcinoma; ICC: Intrahepatic cholangiocarcinoma. (B) Same as (A) colored for sequencing depth and indicating homogeneous tumor clusters. (C) UMAP of RNAPII FFPE-CUTAC data based on 500-bp bins over the human genome. (D) Same as (C) for cCREs. (E) Same as (C) for the 64 Replication-Coupled (RC) histone genes. (F) WHO grade correlates best with RNAPII occupancy over histone genes. (G) Same as (A) excluding meningiomas but including samples and replicates from 13 additional breast tumors. (H) Same as (E) for breast tumor samples and replicates, colored for tumor type. (I) Same as (H) colored for tumor percentage.
Figure 4:
Figure 4:. RNAPII over histone genes uniquely predicts recurrence in meningiomas.
(A) UMAPs of FFPE-CUTAC and frozen RNA-seq meningioma patient samples grouped by different biomarkers. From the left to right: RNAPII over RC histone genes; RNAPII over ribosomal protein genes; Percent of Chromosome M (chrM = Mitochondrial DNA); Chr22q loss. UMAPs are based on integrating FFPE-CUTAC (circles) with frozen-RNA-seq (triangles) samples (fig. S10) using the canonical correlation analysis. For RC histone and ribosomal protein genes, points are colored by high (red) or low (blue for histone genes and purple for ribosomal protein genes) RNAPII enrichment over the corresponding genes for FFPE-CUTAC samples or their shared nearest neighbor RNA-seq samples. For chrM, points are colored by low (red) or high (dark grey) fractions of Chromosome M fragments, with the hypothesis that a low chrM fraction predicts malignant. For chr22q loss, the FFPE-CUTAC samples with chr22q loss and their RNA-seq samples are colored red, while the ones with chr22q intact are colored green. (B) Kaplan-Meier (KM) plots of recurrence-free rate as a function of time in months based on each grouping strategy using the biomarkers shown in (C). For fair comparisons between Histone genes, Ribosomal Protein genes and chrM, the same number of samples, i.e., the top five patients, are selected in the malignant group. The fraction of the chrM predictor has settings (6 to 18 samples in the malignant group) with small p values. However, the KM curve order is in the wrong direction for the hypothesis that a low fraction of chrM predicts fast recurrence.
Figure 5:
Figure 5:. RNAPII over histone genes predicts whole-arm chromosome losses.
(A) P-values from the log-rank test for the KM separation of malignant from benign for all thresholds of the 30 meningioma patients and the corresponding 36 FFPE-CUTAC samples for Histone genes (blue), Ribosomal protein genes (purple) and % mitochondrial DNA (grey) (Fig. 4), also including the combined aneuploidy data for all 39 chromosome arms (gold). (B) Scatterplots and Spearman correlations between RNAPII over histone genes and number of whole-arm gains (upper panel) and losses (lower panel) for each of the 30 meningioma patient samples. (C) Spearman correlations between the signal for RNAPII over histone genes and null RNAPII occupancies at cCREs for all 39 autosomal arms for Meningiomas (upper panel) and Breast tumors (lower panel). This summarizes correlation coefficients and significances on the correlation scatterplot in fig. S14. A negative correlation is expected if gains are more frequent than losses (i.e., chromosome arm gain will lead to a lower percentage of cCREs regions with zero RNAPII signals) with increasing RC histone gene signal and a positive correlation if losses are more frequent than gains. The error bar describing the standard deviation of the Spearman correlation coefficient is based on 1000 bootstrap estimation. The significance level is indicated by the stars on the top of each bar with *: p-value < 0.05, **: p-value <0.01, and ***: p-value < 0.001.
Figure 6:
Figure 6:. Acrocentric and metacentric whole-arm SCNAs are recovered at similar frequencies in cancer.
(A) Left to right: A metacentric segregation; An acrocentric segregation; A metacentric segregation following a centromere break; An acrocentric segregation following a centromere break. (B) Summary of whole-genome sequencing data from the Cancer Genome Atlas (TCGA, https://portal.gdc.cancer.gov/) representing 10,674 cancer patients for 33 cancer types (fig. S15). For 32 of 33 cancer types, no significant differences are seen between acrocentrics and metacentrics in the frequencies of whole-arm SCNA gains, losses or both gains and losses (Wilcoxon rank test). Each dot represents a different autosomal chromosome arm (5 acrocentric long arms and 17 metacentrics). (C) We inferred the chromosome arm gain or loss using allele-specific copy number analysis of tumors (ASCAT) (56) profiles for each patient. We summed the major and minor alleles of each segment and took the minimum and maximum of the copy number across segments on each chromosome arm. Any increases in the minimal allelic copy number from the diploid copy number of 2 indicate an arm gain. Similarly, any decreases in the maximum allelic copy number from the diploid copy number of 2 indicate a whole-arm loss for the corresponding autosomal arm. (D) Model for induction of centromere breaks and aneuploidy by histone gene hypertranscription. Histone H3|H4 dimers (blue-green spheres) are deposited along chromosome arms during DNA replication for chromatin duplication, while CENPA|H4 dimers (red-green spheres) are deposited at centromeres and maintain centromere identity. H3|H4 and CENPA|H4 histone dimers are preferentially deposited (black arrows) at the CAF1 and HJURP assembly factors, respectively. However, the excess H3|H4 dimers produced by hypertranscription in cancer cells compete with CENPA|H4 for centromere assembly, reducing centromere function and creating DNA breaks (45, 46). Segregation of broken chromosomes leads to whole-arm aneuploidies.

Similar articles

Cited by

References

    1. Dong Y., Tu R., Liu H., Qing G., Regulation of cancer cell metabolism: oncogenic MYC in the driver’s seat. Signal transduction and targeted therapy 5, 124 (2020). - PMC - PubMed
    1. Patange S. et al. , MYC amplifies gene expression through global changes in transcription factor dynamics. Cell Rep 38, 110292 (2022). - PMC - PubMed
    1. Pellanda P. et al. , Integrated requirement of non-specific and sequence-specific DNA binding in Myc-driven transcription. EMBO J 40, e105464 (2021). - PMC - PubMed
    1. Zatzman M. et al. , Widespread hypertranscription in aggressive human cancers. Sci Adv 8, eabn0238 (2022). - PMC - PubMed
    1. Cao S. et al. , Estimation of tumor cell total mRNA expression in 15 cancer types predicts disease progression. Nat. Biotechnol. 40, 1624 (2022). - PMC - PubMed

Publication types