[Preprint]. 2024 Mar 12:2024.03.08.584072.
doi: 10.1101/2024.03.08.584072.

Integrated in vivo functional screens and multi-omics analyses identify α-2,3-sialylation as essential for melanoma maintenance

Affiliations

Integrated in vivo functional screens and multi-omics analyses identify α-2,3-sialylation as essential for melanoma maintenance

Praveen Agrawal et al. bioRxiv. .

Update in

Abstract

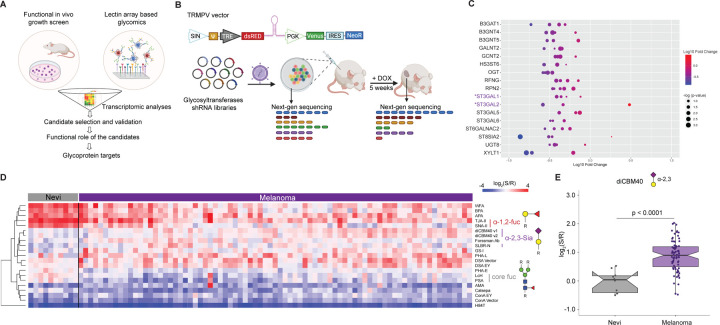
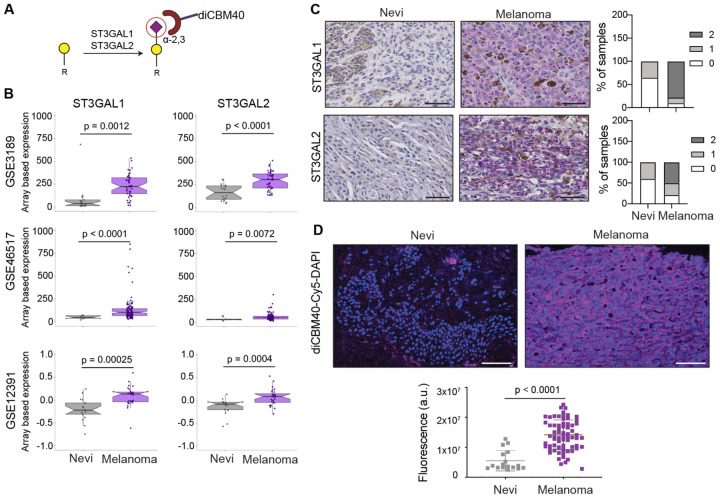
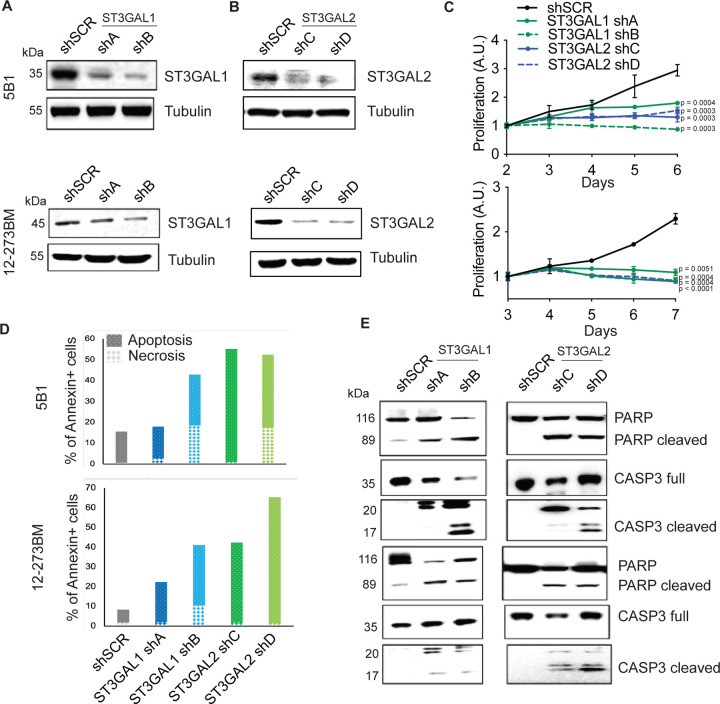
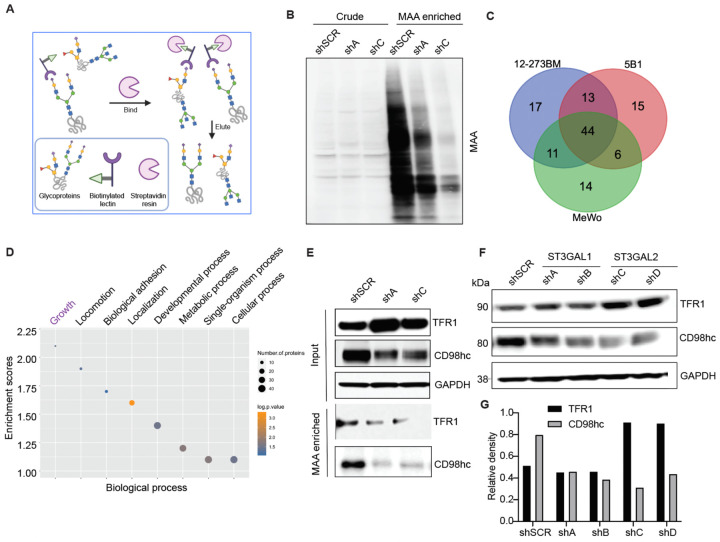
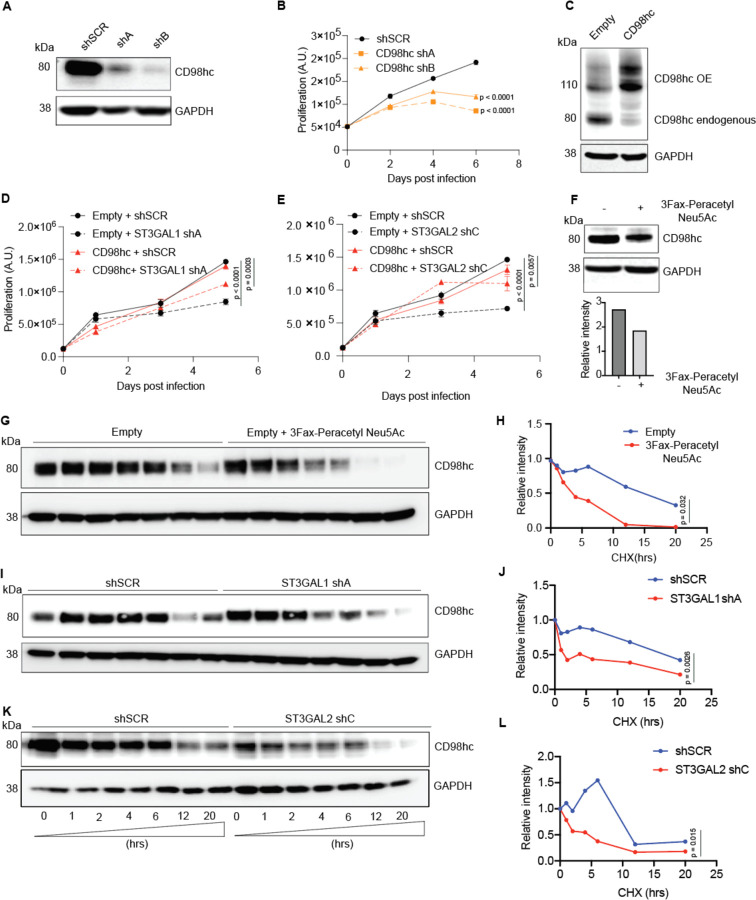
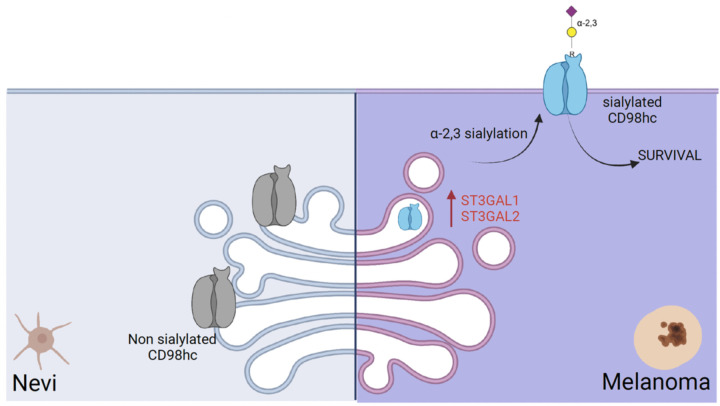
Glycosylation is a hallmark of cancer biology, and altered glycosylation influences multiple facets of melanoma growth and progression. To identify glycosyltransferases, glycans, and glycoproteins essential for melanoma maintenance, we conducted an in vivo growth screen with a pooled shRNA library of glycosyltransferases, lectin microarray profiling of benign nevi and melanoma patient samples, and mass spectrometry-based glycoproteomics. We found that α-2,3 sialyltransferases ST3GAL1 and ST3GAL2 and corresponding α-2,3-linked sialosides are upregulated in melanoma compared to nevi and are essential for melanoma growth in vivo and in vitro. Glycoproteomics revealed that glycoprotein targets of ST3GAL1 and ST3GAL2 are enriched in transmembrane proteins involved in growth signaling, including the amino acid transporter Solute Carrier Family 3 Member 2 (SLC3A2/CD98hc). CD98hc suppression mimicked the effect of ST3GAL1 and ST3GAL2 silencing, inhibiting melanoma cell proliferation. We found that both CD98hc protein stability and its pro-survival effect in melanoma are dependent upon α-2,3 sialylation mediated by ST3GAL1 and ST3GAL2. In summary, our studies reveal that α-2,3-sialosides functionally contribute to melanoma maintenance, supporting ST3GAL1 and ST3GAL2 as novel therapeutic targets in these tumors.

Keywords: Melanoma; ST3GAL1; ST3GAL2; cell growth; glycosyltransferase; α-2,3 sialylation.


Figures

Fig. 1.
Fig. 1.. In vivo functional genetic screen and multi-omics approach identify essential glycogenes and glycans for melanoma growth.
(A) Schematic illustration of our approach to identifying glycosylation enzymes involved in melanoma growth and their targets. (B) Schematic representation of dual-color TRINE vector that enables Tet-regulated shRNA expression to suppress glycosyltransferases involved in cell proliferation and survival. The in vivo growth screen schema is also presented. (C) Bubble plot representing log 10-fold change of the depleted or enriched shRNA in the MeWo cells transduced with glycosyltransferase shRNA libraries in tumors (5 weeks post-injection) relative to baseline (before injection). Glycosyltransferases corresponding to α−2,3 sialylation are highlighted in purple. (D) Heatmap of ratiometric lectin microarray data for nevi (n=10) and melanoma FFPE tissues (n=79); Only lectins showing significant differences between the 2 groups are shown (student’s t-test (two-tailed), p < 0.05). Pink, log2(S/R) > log2(Smedian/Rmedian); blue, log2(Smedian/Rmedian) > log2(S/R). Lectins corresponding to α−2,3 sialosides are highlighted in purple. The complete heatmap is given in Fig. S2A. (E) Whisker plot showing significantly increased diCBM40 binding in melanoma compared to nevi. Significance was determined using Wilcoxon’s t-test.
Fig. 2.
Fig. 2.. ST3GAL1, ST3GAL2, and α−2,3-sialosides are upregulated in melanoma relative to nevi.
(A) α−2,3 sialylated glycans generated by ST3GAL1 and ST3GAL2 and recognized by diCBM40 lectin. (B) Whisker plot illustrating significant upregulation of ST3GAL1 and ST3GAL2 mRNA expression in melanoma samples compared to nevi in multiple datasets: GSE3189, GSE46517, GSE12391. Two-tailed unpaired t-test. (C) Representative images of IHC staining with ST3GAL1 and ST3GAL2 antibodies in 15 nevi and 50 melanoma samples show a perinuclear staining pattern (Fast red counterstaining). IHC score was calculated by combining the signal intensity and percentage of positive cells within the section. The histogram shows the distribution of ST3GAL1 and ST3GAL2 IHC scores in nevi and melanoma samples. Scale bar, 10 μm. (D) Representative images of diCBM40 lectin fluorescence microscopy of nevi and melanoma FFPE tissues (n = 17 for nevi and 68 for melanomas). diCBM40-Alexa 647 (magenta) and DAPI-stained sections of TMA. Scale bar, 100 μm. Dot plots represent the average fluorescence intensity of five fields per image, two-tailed unpaired t-test.
Fig. 3.
Fig. 3.. ST3GAL1 and ST3GAL2 are essential for melanoma proliferation in vitro.
ST3GAL1 (A) and ST3GAL2 (B) protein levels in 5B1 and 12–273BM cells stably transduced with non-targeting scrambled control shRNA (shSCR), ST3GAL1 shRNAs (shA and shB) and ST3GAL2 shRNAs (shC and shD) were assessed by Western blotting. Western blot images are representative of three independent experiments. (C) Relative growth curves of 5B1 and 12–273BM cells stably transduced with non-targeting scrambled control shRNA (shSCR), ST3GAL1 shRNAs (shA and shB), and ST3GAL2 shRNAs (shC and shD). The data shown are representative of three independent experiments. Two-tailed unpaired t-tests and p-values are shown in the figures. (D) The percentage of melanoma cells positive for Annexin V only (early apoptosis) or PI only (necrosis), Experiment was performed in duplicates. (E) Representative Western blots for caspase 3 and PARP on lysates from 5B1 and 12–273BM cells with shRNA against ST3GAL1 and ST3GAL2.
Fig. 4.
Fig. 4.. Identification of α−2,3-sialylated glycoproteins in melanoma reveals regulators of melanoma growth.
(A) Schematic illustration of the experimental approach showing affinity enrichment of α−2,3 sialylated proteins by MAA lectin affinity chromatography. (B) MAA affinity chromatography of whole-cell lysates of 5B1 cells transfected with NTC or ST3GAL1/ST3GAL2 shRNA followed by lectin blot with MAA lectin. An equal concentration of crude protein and an equal volume of MAA-enriched fractions was loaded for MAA lectin blot. (C) A number of proteins were identified by mass spectrometry analysis of the MAA-enriched fractions from 5B1, 12–273BN, and MeWo cell lines. (D) Gene ontology enrichment analysis (biological processes category) of α−2,3 sialylated proteins common to the three cell lines. Also, see Table S1 (E) Western blot analysis with a-TFR1 or a-CD98hc antibodies of MAA-pulldown and corresponding input from lysates of 5B1 cells transfected with NTC or ST3GAL1/ST3GAL2 shRNA. (F) Western blot analysis of TFR1 and CD98hc in lysates from 5B1 cells transfected with NTC or ST3GAL1 or ST3GAL2 shRNAs. (G) Densitometric analysis of CD98hc on lysates from 5B1 cells transfected with NTC or ST3GAL1 or ST3GAL2 shRNAs. The graph is representative of three replicates. Experiments in B, E, and F were performed in triplicate, and representative images were shown.
Fig. 5.
Fig. 5.. α−2,3 sialylation of SLC3A2 (CD98hc) is required for its stability and anti-proliferative effect.
(A) Western blot for CD98hc on lysates from 5B1 cells transfected with NTC or CD98hc shRNAs. (B) Relative growth curves of 5B1 cells stably transduced with non-targeting control shRNA (shSCR) and CD98hc shRNAs (shA and shB). The data shown are representative of two independent experiments. Two-tailed unpaired t-tests and p-values are shown in the figures. (C) Western blot of CD98hc in 5B1 cells stably overexpressing CD98hc or control vector. (D) Cell proliferation assay on 5B1 melanoma cells stably overexpressing CD98hc or empty vector and transduced with non-targeting control shSCR or shST3GAL1. (E) Cell proliferation assay on 5B1 melanoma cells stably overexpressing CD98hc or empty vector and transduced with non-targeting control shSCR or shST3GAL2. (F) Western blot of CD98hc in 5B1 cells treated with or without 200 uM 3Fax-peracetylNeu5Ac. Densitometric analysis is shown below. (G–H) Western blot analysis of CD98hc protein in 5B1 cells. 3Fax-peracetylNeu5Ac treated 5B1 cells were further treated with 10 μM CHX at indicated intervals and analyzed by western blot analysis. The intensity of CD98hc protein was quantified using a densitometer. Western blot analysis of SLC3A2 protein in 5B1 cells silenced for ST3GAL1 (I–J) or ST3GAL2 (K–L) and treated with 10 μM cycloheximide (CHX) at indicated intervals and analyzed by western blot analysis. Paired t-test is shown. Western blot images are representative of 2 independent experiments.
Fig. 6.
Fig. 6.
A schematic model suggests that α−2,3 sialylated transmembrane glycoprotein is required for melanoma cell survival.

Similar articles

References

    1. Damsky WE, Rosenbaum LE, Bosenberg M. Decoding melanoma metastasis. Cancers (Basel). 2010;3(1):126–63. Epub 2010/01/01. doi: 10.3390/cancers3010126. - DOI - PMC - PubMed
    1. Shain AH, Bastian BC. From melanocytes to melanomas. Nat Rev Cancer. 2016;16(6):345–58. Epub 20160429. doi: 10.1038/nrc.2016.37. - DOI - PubMed
    1. Damsky WE, Bosenberg M. Melanocytic nevi and melanoma: unraveling a complex relationship. Oncogene. 2017;36(42):5771–92. Epub 20170612. doi: 10.1038/onc.2017.189. - DOI - PMC - PubMed
    1. Turner N, Ware O, Bosenberg M. Genetics of metastasis: melanoma and other cancers. Clin Exp Metastasis. 2018;35(5–6):379–91. Epub 2018/05/04. doi: 10.1007/s10585-018-9893-y. - DOI - PubMed
    1. Schadendorf D, van Akkooi ACJ, Berking C, Griewank KG, Gutzmer R, Hauschild A, Stang A, Roesch A, Ugurel S. Melanoma. The Lancet. 2018;392(10151):971–84. doi: 10.1016/s0140-6736(18)31559-9. - DOI - PubMed

Publication types