[Preprint]. 2024 Nov 22:2024.03.17.585403.
doi: 10.1101/2024.03.17.585403.

Functional associations of evolutionarily recent human genes exhibit sensitivity to the 3D genome landscape and disease

Affiliations

Functional associations of evolutionarily recent human genes exhibit sensitivity to the 3D genome landscape and disease

Katherine Fleck et al. bioRxiv. .

Abstract

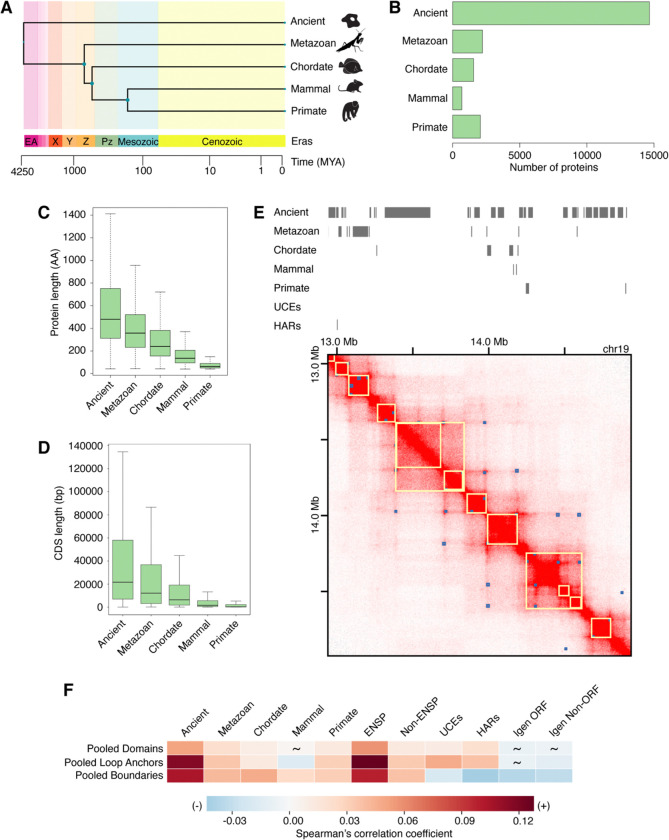
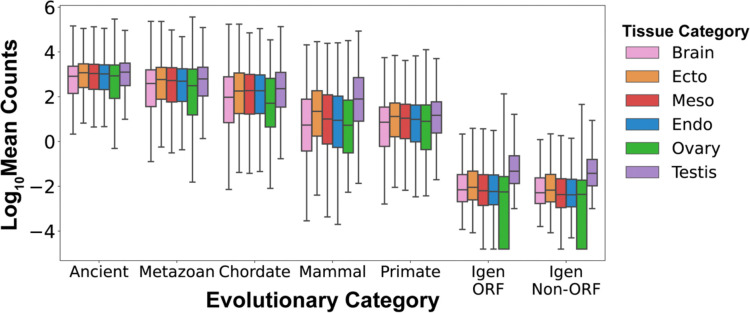
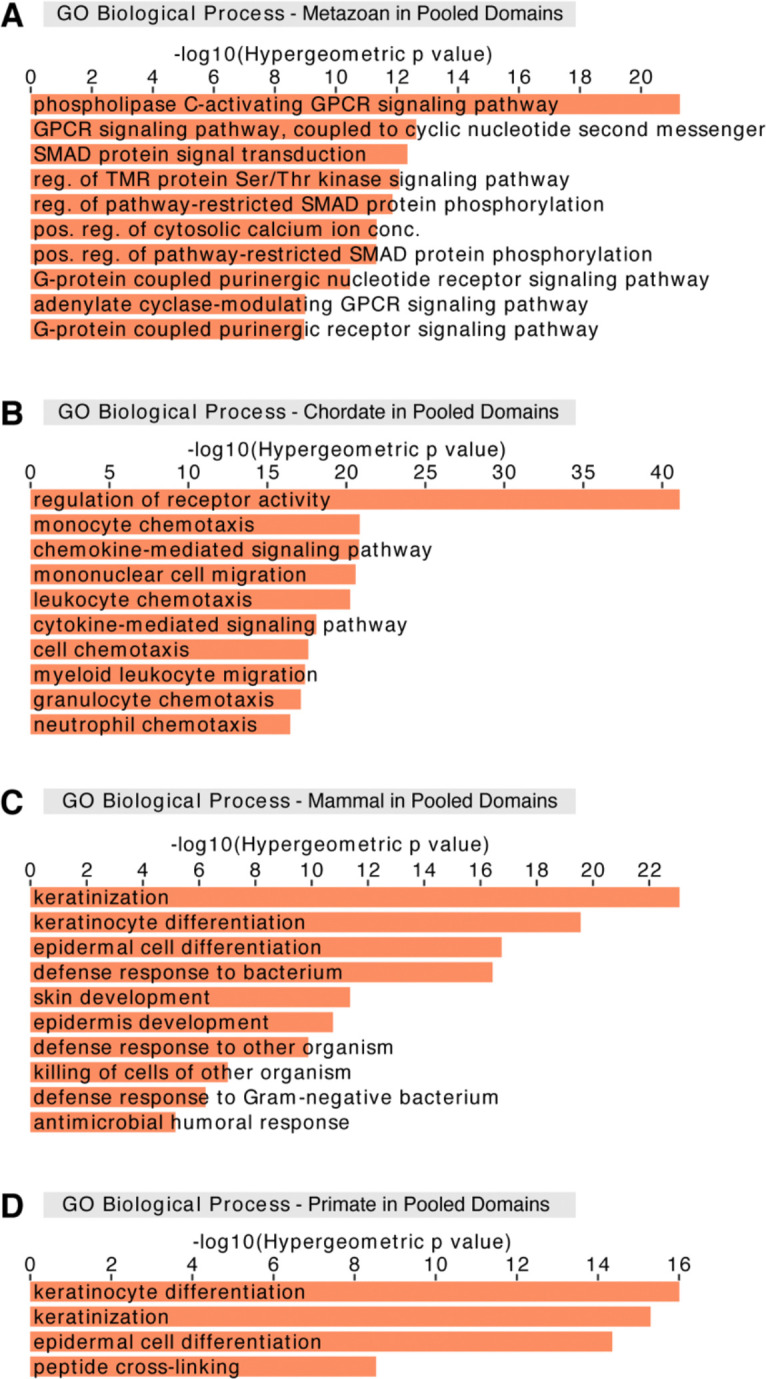
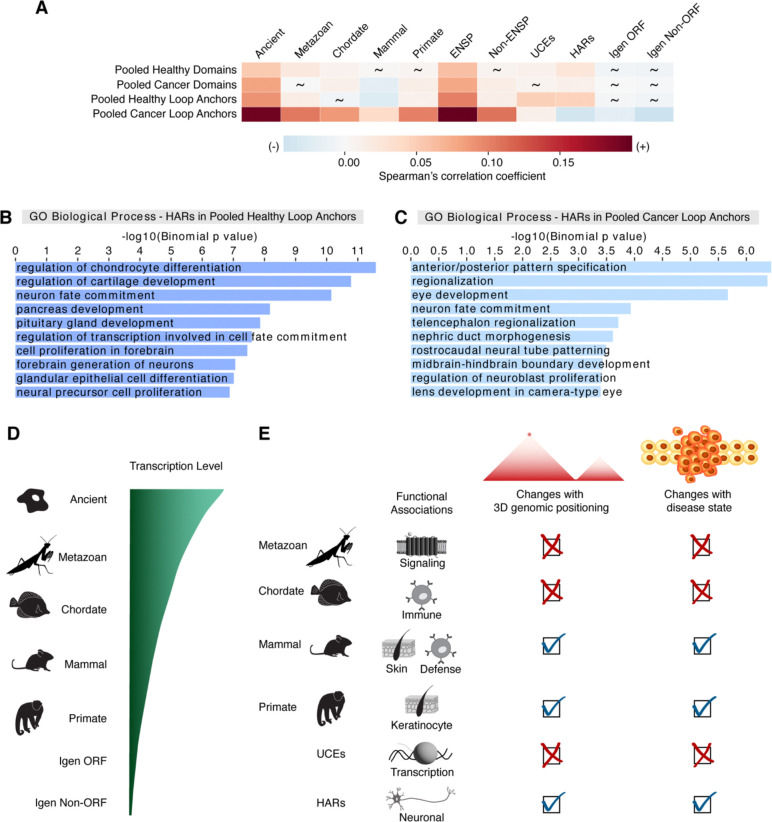
Genome organization is intricately tied to regulating genes and associated cell fate decisions. Here, we examine the positioning and functional significance of human genes, grouped by their lineage restriction level, within the 3D organization of the genome. We reveal that genes of different lineage restriction levels have distinct positioning relationships with both domains and loop anchors, and remarkably consistent relationships with boundaries across cell types. While the functional associations of each group of genes are primarily cell type-specific, associations of conserved genes maintain greater stability across 3D genomic features and disease than recently evolved genes. Furthermore, the expression of these genes across various tissues follows an evolutionary progression, such that RNA levels increase from young lineage restricted genes to ancient genes present in most species. Thus, the distinct relationships of gene evolutionary age, function, and positioning within 3D genomic features contribute to tissue-specific gene regulation in development and disease.

Keywords: 3D genome organization; cell type-specific processes; gene evolution; gene function/ontology; human accelerated regions (HARs).


Conflict of interest statement

Declaration of Interests The authors declare no competing interests.

Figures

Figure 1.
Figure 1.. Genomic regions of varying sequence conservation have distinct relationships with features of 3D genome organization
(A) Human genes assigned an evolutionary age by phylogenomics and phylostratigraphy. Representative species used with TimeTree to build a timetree: Escherichia coli (ancient), Amphimedon queenslandica (metazoan), Branchiostoma floridae (chordate), Ornithorhynchus anatinus (mammal), and Homo sapiens (primate). (B) Number of human protein-coding genes in every evolutionary era (ancient, metazoan, chordate, mammal, primate). Most genes are ancient. (C) Protein length is indicated in number of amino acids (AA) and is largest for ancient genes. (D) The length of coding sequences (CDS) is indicated as the number of base pairs (bp) and is largest for ancient genes. (E) Visualization of example genomic regions of varying sequence conservation with the GM12878 Hi-C dataset using the Juicebox tool. Domains (yellow squares) and peaks indicating loop presence (blue squares), as annotated in Juicebox. (F) Pooled domains, loop anchors, and boundaries are significantly positively correlated with era genes (1.08×10−172 ≤ p ≤ 0.022), except for mammal genes in pooled domains and loop anchors (6.03×10⁻⁵ ≤ p ≤ 0.654). UCEs and HARs are significantly positively correlated with pooled domains and loop anchors, but negatively correlated with pooled boundaries (1.34×10⁻²⁹ ≤ p ≤ 0.017). Spearman correlation analysis was performed by partitioning the genome into 50-kb bins. Spearman correlation coefficients are indicated by a heatmap. Non-significant p values are depicted by tildes. Control datasets include annotated genes, unannotated genes, Igen ORFs, and Igen Non-ORFs.
Figure 2.
Figure 2.. Transcriptional levels vary with gene age and tissue of origin
The expression of human protein-coding genes is measured as the log10 of the mean counts of RNA transcripts across 54 human tissues from the GTEx database. RNA expression levels vary as a function of evolutionary category, increasing from youngest to oldest genes, and higher in all genes than in control non-genic sequences (Igen ORF, Igen Non-ORF). Testis expression is higher than expression in other tissues in control non-genic sequences.
Figure 3.
Figure 3.. Genes of different evolutionary eras are associated with prominent cell type-specific processes in pooled domains
GREAT analysis for different era genes that overlap pooled domains with GO terms associated with (A) signaling pathways for metazoan genes, (B) immune response-related processes for chordate genes, (C) skin development and defense response to other organisms for mammal genes, and (D) keratinocyte differentiation for primate genes. (A-D) Analysis performed against all era genes as a background. Abbreviated GO terms: GPCR, G-protein coupled receptor; reg., regulation; TMR, transmembrane receptor; Ser, serine; Thr, threonine; pos., positive; conc., concentration.
Figure 4.
Figure 4.. The relationship between genomic regions of different sequence conservation and 3D genome organization in healthy versus disease states
(A) Correlations of regions of varying sequence conservation with pooled domains and pooled loop anchors in healthy versus cancer states. Spearman correlation analysis was performed by partitioning the genome into 50-kb bins. Spearman correlation coefficients indicated by a heatmap. Non-significant p values are depicted by tildes. Control datasets include annotated genes, unannotated genes, Igen ORFs, and Igen Non-ORFs. (B and C) HARs that overlap pooled loop anchors in (B) healthy (dark blue) and (C) cancer (light blue) states against whole genome background share associations with neuronal GO categories. However, such HARs in healthy state are enriched for GO terms associated with cartilage, pancreas, and gland development, while HARs in cancer are associated with pattern specification, eye, and kidney development. (D) Evolutionary progression of transcription levels: RNA expression increases with time from youngest genes (primate) to oldest genes (ancient) and is higher in genes than in control non-genic sequences (Igen ORF, Igen Non-ORF). (E) Schematic of the functional associations of genomic regions of varying sequence conservation and their changes with 3D genomic positioning and disease state. Change is indicated by a check mark and consistency is depicted by an X.

Similar articles

References

    1. Davies J.O., Oudelaar A.M., Higgs D.R., and Hughes J.R. (2017). How best to identify chromosomal interactions: a comparison of approaches. Nat Methods 14, 125–134. 10.1038/nmeth.4146. - DOI - PubMed
    1. Jerkovic I., and Cavalli G. (2021). Understanding 3D genome organization by multidisciplinary methods. Nat Rev Mol Cell Biol 22, 511–528. 10.1038/s41580-021-00362-w. - DOI - PubMed
    1. Kempfer R., and Pombo A. (2020). Methods for mapping 3D chromosome architecture. Nat Rev Genet 21, 207–226. 10.1038/s41576-019-0195-2. - DOI - PubMed
    1. Rao A., Barkley D., Franca G.S., and Yanai I. (2021). Exploring tissue architecture using spatial transcriptomics. Nature 596, 211–220. 10.1038/s41586-021-03634-9. - DOI - PMC - PubMed
    1. Dixon J.R., Selvaraj S., Yue F., Kim A., Li Y., Shen Y., Hu M., Liu J.S., and Ren B. (2012). Topological domains in mammalian genomes identified by analysis of chromatin interactions. Nature 485, 376–380. 10.1038/nature11082. - DOI - PMC - PubMed

Publication types