[Preprint]. 2024 Mar 17:2024.03.15.585289.
doi: 10.1101/2024.03.15.585289.

Social state gates vision using three circuit mechanisms in Drosophila

Affiliations

Social state gates vision using three circuit mechanisms in Drosophila

Catherine E Schretter et al. bioRxiv. .

Update in

  • Social state alters vision using three circuit mechanisms in Drosophila.
    Schretter CE, Hindmarsh Sten T, Klapoetke N, Shao M, Nern A, Dreher M, Bushey D, Robie AA, Taylor AL, Branson K, Otopalik A, Ruta V, Rubin GM. Schretter CE, et al. Nature. 2025 Jan;637(8046):646-653. doi: 10.1038/s41586-024-08255-6. Epub 2024 Nov 20. Nature. 2025. PMID: 39567699 Free PMC article.

Abstract

Animals are often bombarded with visual information and must prioritize specific visual features based on their current needs. The neuronal circuits that detect and relay visual features have been well-studied. Yet, much less is known about how an animal adjusts its visual attention as its goals or environmental conditions change. During social behaviors, flies need to focus on nearby flies. Here, we study how the flow of visual information is altered when female Drosophila enter an aggressive state. From the connectome, we identified three state-dependent circuit motifs poised to selectively amplify the response of an aggressive female to fly-sized visual objects: convergence of excitatory inputs from neurons conveying select visual features and internal state; dendritic disinhibition of select visual feature detectors; and a switch that toggles between two visual feature detectors. Using cell-type-specific genetic tools, together with behavioral and neurophysiological analyses, we show that each of these circuit motifs function during female aggression. We reveal that features of this same switch operate in males during courtship pursuit, suggesting that disparate social behaviors may share circuit mechanisms. Our work provides a compelling example of using the connectome to infer circuit mechanisms that underlie dynamic processing of sensory signals.


Figures

Fig. 1.
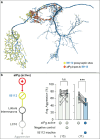
Fig. 1.. The female aggressive state modifies the flow of visual information by three distinct mechanisms.
(a) Summary of the circuit mechanisms that we propose aIPg uses to modulate transmission of visual information by visual projection neurons, specifically LC9, LC10, and LC11. These proposed mechanisms include providing additional excitatory input to a select subset of the direct targets of LC9, LC10, and LC11 (Mechanism 1, Convergence of excitatory inputs), relieving inhibition that acts on LC10 dendritic arbors in the lobula (Mechanism 2, Dendritic disinhibition), and simultaneously flipping a pair of switches that act on the axonal terminals of the LC10a and LC10c cell types to influence which of these two subtypes is active in signaling to downstream targets (Mechanism 3, Toggle switch). Other than the LC9, LC10, and LC11 targets discussed above, only three other neurons get both 1.5% or more of their input from aIPg and 5% or more of their input from an LC type. Arrows indicate putative excitatory connections (cholinergic) and bar endings indicate putative inhibitory connections (GABAergic or glutamatergic). (b) Common shared downstream targets of both aIPg and LC10 neurons. Each target cell type is represented by a circle whose diameter represents the total number of LC10 input synapses it receives. The proportion of those inputs coming from the LC10a, LC10c, LC10d, and other subtypes are indicated as a pie chart. N numbers on axes are per hemisphere. (c) Postsynaptic sites from aIPg (orange) and LC10 (dark gray) on the neuronal outline of AOTU023 (dark green). (d) A diagram of the morphology of CL053 (dark green) is shown with the position of input synapses from aIPg (orange) and LC11 (dark gray). Some ventral arbors lie outside the hemibrain volume and are not shown. (e) Common shared downstream targets of both aIPg and LC11 neurons outside of the optic lobe (OL). Each target cell is represented by a light green circle whose diameter indicates the total number of LC11 synapses that cell receives and whose position on the y-axis represents the percentage of its inputs coming from aIPg and on the x-axis the percentage coming from LC11. This graph shows LC11’s top 51 targets outside the OL representing 74% of its synapses to other cell types outside the OL. (f) A diagram of the morphology of PVLP114 (dark green) is shown with the position of input synapses from aIPg (orange) and LC9 (dark gray). Some ventral arbors lie outside the hemibrain volume and are not shown. (g) Common shared downstream targets of aIPg and LC9 neurons outside of the OL. Each target cell is represented by a light green circle. The diameter of each circle indicates the total number of LC9 synapses that cell receives and whose position on the y-axis represents the percentage of its inputs coming from aIPg and on the x-axis the percentage coming from LC9. This graph shows LC9’s top 54 targets outside the OL representing 83% of its synapses to other cell types outside the OL.
Fig. 2.
Fig. 2.. LC10a is tuned to medium-sized moving objects, similar to those found during female aggression.
(a) Schematic of experimental setup (top left) for presentation of moving dark rectangles of parameterized spatial dimensions (bottom left). Receptive-field centers were mapped for individual axons leaving the lobula, and each stimulus was then translated across the entire receptive field (see Supplementary Figure 2a – b). Average traces for individual LC9 axons in females and LC10a axons in males (bottom right). Average heat map representations of peak responses are shown across multiple animals (top right). LC9: n = 4 flies, n = 4 neurons. LC10a: n = 5 flies, n = 7 neurons. (b) Heat map representations of conspecific angular sizes experienced during aIPg-induced female aggression. During female aggression, the mean conspecific size as subtended on the retina was 26.1 +/− 8.8° (mean +/− standard deviation) in height and 32.1 +/− 13.0° in width. Female aggression frames were defined using the JAABA aggression classifier and calculated from 79 trajectories. Illustrations on top depict calculations for angular width and height of target female as subtended on subject female’s retina. See Supplementary Figure 2f for angular position and velocity data. (c) Average time spent performing aggressive behaviors before and during stimulus periods in which a 30 s continuous green (9 mW/cm2) light stimulus was delivered. See Supplementary Figure 2g - i for for time course and non-permissive temperature controls. The following genotypes were used: aIPg-LexA > TrpA emptySS > GtACR (aIPg active Negative control), aIPg-LexA > TrpA aIPg-SS > GtACR (aIPg active Positive control), aIPg-LexA > TrpA LC10a-SS > GtACR (aIPg active LC10a inactive), and aIPg-LexA > TrpA LC10bc-SS1 > GtACR (aIPg active LC10bc inactive). The average for the pre-stimulus period was calculated using the first (last 15 s) pre-stimulus period based on the time course data (see Supplementary Figure 2h – i). Averages were calculated over all flies in an experiment, with each dot representing one experiment containing approximately seven flies. All data points are shown to indicating the range and top edge of bar represents the mean. In the diagram on the left, cell types inactivated with GtACR are circled in yellow and those activated with TrpA are circled in red. Data were pooled from four independent replicates, which included separate parental crosses and were collected on different days. A non-parametric Wilcoxon Matched-pairs Signed Rank test was used for statistical analysis. Asterisk indicates significance from 0: **p<0.01; ***p<0.001.
Fig. 3.
Fig. 3.. Polysynaptic connections from aIPg to the lobula shape aggressive behaviors.
(a) Postsynaptic sites from aIPg (orange) and presynaptic sites of IB112 to its downstream targets (yellow) in the lobula are shown on the neuronal outline of IB112 (dark blue). (b) Average time spent performing aggressive behaviors before and during stimulus periods in which a 30 s continuous green (9 mW/cm2) light stimulus was delivered. See Supplementary Figure 4b – d for time course and non-permissive temperature controls. Averages were calculated over all flies in an experiment, and each dot represents one experiment containing approximately seven flies. All data points are shown to indicating the range and top edge of bar represents the mean. The following genotypes were used: aIPg-LexA > TrpA emptySS > GtACR (aIPg active Negative control) and aIPg-LexA > TrpA IB112-SS2 > GtACR (aIPg active IB112 inactive) (see Supplementary Figure 4c - d for Positive Control and IB112-SS1 data). In the diagram on the left, cell types inactivated with GtACR are circled in yellow and those activated with TrpA are circled in red. IB112 and the relevant lobula interneurons are predicted to be glutamatergic and are presumed inhibitory (see Supplementary Figure 3h for confirming data on IB112’s neurotransmitter expression). Data were pooled from four independent replicates, which included separate parental crosses and were collected on different days. A non-parametric Wilcoxon Matched-pairs Signed Rank test was used for statistical analysis. Asterisk indicates significance from 0: ***p<0.001.
Fig. 4.
Fig. 4.. aIPg selectively amplifies LC10a, while dampening LC10c transmission via TuTuA neurons.
(a) Connectivity between aIPg, TuTuA subtypes (TuTuA_1, TuTuA_2), LC10a, and LC10c. Exact synapse numbers are indicated on the arrows, which are also scaled in size according to synapse counts. Note that the TuTuA_1 and TuTuA_2 neurons are highly specific in their connections for LC10c and LC10a, respectively: 97% of TuTuA_1’s synapses onto LC10 go to the LC10c subtype, whereas 97% of TuTuA_2’s synapses onto LC10 go to LC10a subtype. Arrows indicate putative excitatory connections (cholinergic) and bar endings indicate putative inhibitory connections (SMP054, GABAergic; TuTuA_1 and TuTuA_2, glutamatergic). (b) Predicted outcomes for circuit dynamics based on aIPg activity. See text for details. Cells and connections with higher predicted activity are displayed in bold and dark colors. (c – d) Axo-axonal synapses between TuTuA_1, TuTuA_2, LC10a, and LC10c on representative neuronal skeletons for LC10c (Body ID: 861578964) and LC10a (Body ID: 954010798). Note how inhibitory synapses from the TuTuA neurons are interspersed with the LC10’s output synapses. (e) Excitatory responses recorded from TuTuA_1 (n = 16 cells) using patch clamp electrophysiology in female brain explants before, during, and following a 2 ms stimulation of aIPg neurons. The excitation was largely abolished by mecamylamine, a n-AchR blocker. Individual trials in purple (n = 8 trials from 1 cells), mean in black. (f) Inhibitory responses recorded from TuTuA_2 (n = 16 cells) before, during, and following a 2 ms stimulation of aIPg neurons. The inhibition was completely removed by mecamylamine. Individual trials are in pink (n = 8 trials from 1 cell), mean is in black. In the diagrams above the traces, cell types activated with CsChrimson are circled in red and those recorded from are in purple or pink depending on the TuTuA subtype.
Fig. 5.
Fig. 5.. Selective modulation of LC10 subtypes shapes female aggression and male courtship.
(a – b) Average time spent performing aggressive behaviors before and during stimulus periods in which a 30 s continuous green (9 mW/cm2) or red (3 mW/cm2) light stimulus was delivered. See Supplementary Figure 7a – b, and e for time course and non-permissive temperature controls. The following genotypes were used: (a, left panel) aIPg-LexA > TrpA emptySS > GtACR (aIPg active Negative control), aIPg-LexA > TrpA TuTuA_1-SS > GtACR (aIPg active TuTuA_1 inactive) (see Supplementary Figure 7a for Positive Control); (a, right panel): aIPg-LexA > TrpA emptySS > CsChrimson (aIPg active Negative control), aIPg-LexA > TrpA TuTuA_2-SS > CsChrimson (aIPg active TuTuA_2 active); (b): emptySS > GtACR (Negative control), TuTuA_2-SS > GtACR (TuTuA_2 inactive). Based on the time course data (see Supplementary Figure 7a – b, f), either the last 10 s (a, left panel) or 30 s (a, right panel and b) of each pre-stimulus period was compared to averages across all three stimulus periods (first 10 s of each – left panel a, or the 30 s of each – right panel, a and b). Inactivation experiments in (b) were performed with group housed flies which have a decreased baseline in aggression. Averages were calculated over all flies in an experiment, with each dot representing one experiment containing approximately seven flies. All data points are shown to indicating the range and top edge of bar represents the mean. Cell types inactivated with GtACR are circled in yellow and those activated with either TrpA or CsChrimson are circled in red. Data were pooled from four (a, left panel) and two (a, right panel and b) independent replicates, which included separate parental crosses and were collected on different days. (c) Left: schematic of the visual virtual reality preparation for male courtship (redrawn from (41)). Males walking on an air-supported foam ball are presented with a dynamic fly-sized visual target that sweeps left and right across the visual panorama at regular intervals. Center: Responses of TuTuA neurons (average ΔF/F0) to a visual target during periods of courtship pursuit (purple or pink) or general locomotion (black). The mean is represented as a solid line and shaded bars represent standard error between experiments (TuTuA_1-SS1, n = 4 flies; TuTuA_2-SS1, n = 5 flies). Black line above indicates when the visual target was oscillating. Courtship is determined by the vigor of male pursuit and the presence of unilateral wing-extensions. Right: The schematic represents circuit activity during male courtship pursuit. Cell types with question marks in the schematic are not definitively known due to the lack of the male connectome. A non-parametric Wilcoxon Matched-pairs Signed Rank test was used for statistical analysis. Asterisk indicates significance from 0: ***p<0.001; ****p<0.0001.
Fig. 6.
Fig. 6.. Summary of neural motifs for state-dependent modulation of visual information flow through LC10 neurons.
Overview of the circuit components for each mechanism detailed in Figure 1a. Activation of aIPg: (1) provides additional excitatory input to downstream targets of LC10 neurons, represented here by AOTU015 and AOTU023; (2) leads to disinhibition of inputs to the dendrites of LC10 neurons through the action of IB112 on local inhibitory neurons in the optic lobe; and (3) governs whether LC10a or LC10c is able to signal to their downstream targets by a novel toggle switch operated by the TuTuA_1 and TuTUA_2 neurons which provide axo-axonal inhibition to LC10c and LC10a, respectively. See text for details. Line widths represent synaptic connections and are scaled according to the key. For cell types with more than one cell per brain hemisphere, the number of cells are indicated in the circle. See Supplementary Figure 9 for additional details.

References

    1. Allman John Morgan. Evolving brains. Number 68 in Scientific American library series. Scientifc American Library, New York, 2000. ISBN 978–0-7167–5076-5.
    1. Currier Timothy A, Pang Michelle M, and Clandinin Thomas R. Visual processing in the fly, from photoreceptors to behavior. Genetics, 224(2):iyad064, June 2023. ISSN 1943–2631. doi: 10.1093/genetics/iyad064. - DOI - PMC - PubMed
    1. Longden Kit D., Rogers Edward M., Nern Aljoscha, Dionne Heather, and Reiser Michael B.. Different spectral sensitivities of ON- and OFF-motion pathways enhance the detection of approaching color objects in Drosophila. Nature Communications, 14(1):7693, November 2023. ISSN 2041–1723. doi: 10.1038/s41467-023-43566-8. - DOI - PMC - PubMed
    1. Goodale Melvyn A. and Milner A. David. Separate visual pathways for perception and action. Trends in Neurosciences, 15(1):20–25, January 1992. ISSN 0166–2236. doi: 10.1016/0166-2236(92)90344-8. - DOI - PubMed
    1. Conway Bevil R.. Color signals through dorsal and ventral visual pathways. Visual Neuroscience, 31(2):197–209, March 2014. ISSN 0952–5238, 1469–8714. doi: 10.1017/S0952523813000382. - DOI - PMC - PubMed

Publication types