[Preprint]. 2024 Nov 5:2024.03.15.585302.
doi: 10.1101/2024.03.15.585302.

Single-animal, single-tube RNA extraction for comparison of relative transcript levels via qRT-PCR in the tardigrade Hypsibius exemplaris

Affiliations

Single-animal, single-tube RNA extraction for comparison of relative transcript levels via qRT-PCR in the tardigrade Hypsibius exemplaris

Molly J Kirk et al. bioRxiv. .

Update in

Abstract

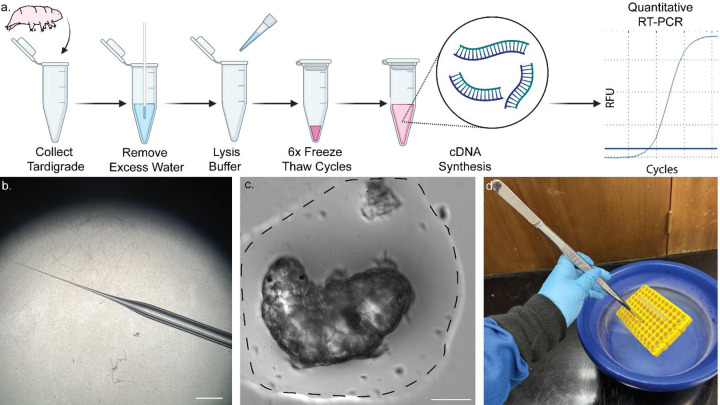
The tardigrade Hypsibius exemplaris is an emerging model organism renowned for its ability to survive environmental extremes. To explore the molecular mechanisms and genetic basis of such extremotolerance, many studies rely on RNA-sequencing (RNA-seq), which can be performed on populations ranging from large cohorts to individual animals. Reverse Transcription Polymerase Chain Reaction (RT-PCR) and RNA interference (RNAi) are subsequently used to confirm RNA-seq findings and assess the genetic requirements for candidate genes, respectively. Such studies require an efficient, accurate, and affordable method for RNA extraction and measurement of relative transcript levels by quantitative RT-PCR (qRT-PCR). This work presents an efficient single-tardigrade, single-tube RNA extraction method (STST) that not only reliably isolates RNA from individual tardigrades but also reduces the required time and cost for each extraction. This RNA extraction method yields quantities of cDNA that can be used to amplify and detect multiple transcripts by quantitative PCR (qRT-PCR). The method is validated by analyzing dynamic changes in the expression of genes encoding two heat-shock-regulated proteins, Heat-Shock Protein 70 β2 (HSP70 β2) and Heat-Shock Protein 90α (HSP90α), making it possible to assess their relative expression levels in heat-exposed individuals using qRT-PCR. STST effectively complements existing bulk and single tardigrade RNA extraction methods, permitting rapid and affordable examination of individual tardigrade transcriptional levels by qRT-PCR.

Keywords: Heat-shock; Single-tardigrade RNA extraction; Single-tube; qRT-PCR.


Conflict of interest statement

DISCLOSURES :The authors declare no conflicts of interest to disclose.

Figures

Figure 1.
Figure 1.. Single-tube pipeline for RNA extraction from a single tardigrade.
a) Scheme showing the protocol for RNA extraction from a single tardigrade, including six freeze-thaw cycles and subsequent cDNA synthesis. Samples may subsequently be used for RT-PCR and qRT-PCR. b) Image of micropipette taper used for removal of water. Scale, 2 mm. c) Bright field image of a tardigrade in a small volume of water (dotted line). Removal of most water to the extent shown is required for successful extraction and prevents dilution of lysis buffer. Scale, 50 µm. d) Image showing immersion of samples in liquid nitrogen using long forceps to rapidly freeze-thaw the samples safely. Some of the content was created in BioRender. Kirk, M. (2022) BioRender.com/d93s511
Figure 2:
Figure 2:. Optimization of single-tardigrade RT-PCR using actin cDNA as a marker for extraction quantity.
a) Representative gel depicting results from single-tardigrade RT-PCR extracted using 4 (lane 2–4), 5 (lane 5–7), and 6 (lane 8–10) freeze-thaw cycles to enhance lysis after proteinase K treatment and heat-shock. Full gel-containing samples from 1, 2, and 3 freeze-thaw cycles are shown in Figure S1. b) optical density quantification of ethidium bromide staining of actin RT-PCR across various freeze-thaw cycle numbers. Data represent optical density values of bands from three individual extractions and PCR amplification of actin via RT-PCR per condition. One way ANOVA, with Tukey’s multiple comparisons post hoc 0 vs. 6, p= 0.020 and 3 vs. 6 p=0.022, error bars represent S.D. (Standard deviation) c) Representative gel showing the effect residual spring water removal from isolated tardigrades prior to the addition of lysis buffer. Samples containing water (lanes 2–4) and samples where the water was removed (lanes 5-7). d) Representative gel showing the effect of lysis order, with freeze-thaw performed prior to chemical lysis (lanes 2–4) or chemical lysis with proteinase K prior to freeze-thaw lysis (lanes 5–7). e) RNA integrity scores reported by Agilent High Sensitivity Tape station of single tardigrade extracts animals in the absence of freeze-thaw, in the absence of vortexing, and utilizing only freeze-thaws without proteinase k digestion or vortexing. Each data point represents the RIN score from one singular RNA extraction. One way ANOVA, with Tukey’s multiple comparisons post hoc, * p=0.036. f) RIN scores reported from single tardigrade extracts in the presence of 4U/µL, 8U/µl and 16U/µL RNAse inhibitor. Brown-Forsythe ANOVA with Dunnett’s T3 multiple comparisons test, **** p=<0.0001 and *=0.0487. h) RIN scores from single tardigrade extracts thawing on ice. i) RNA quantity in ng/µL as measured using Qubit high sensitivity RNA kit. j) RNA quantity in ng per single tardigrade extract using STST. 5 µL of PCR products were loaded per lane unless otherwise noted. All error bars are reported S.D.. Some of the content was created in BioRender. Kirk, M. (2022) BioRender.com/d93s51
Figure 3.
Figure 3.. Comparison of RNA extraction protocols.
Schematized time-course for a) an existing phenol and guanidine isothiocyanate-based RNA extraction kit, requiring ~10 minutes for extraction (Scale bar is 30 minutes) and b) The single-tube, single-tardigrade protocol that permits extraction in 7 minutes and requires one tube. The time courses are drawn to scale. Scale bar is 30 minutes. c) Graph showing Ct values of actin qRT-PCR reactions run in triplicate where each data point represents the average Ct values of three technical replicates from one individual tardigrade extract. Single-tardigrade-based extractions and the background control revealing background fluorescence from samples run on qRT-PCR in the absence of template. One way ANOVA, Tukey’s multiple comparisons test ***, p=0.0003 and ****, p<0.0001, error bars reflect S.D. d) Estimated transcripts per μL of sample derived from the Ct values depicted in (c).Kruskal-Wallis Test, Dunn’s multiple comparisons test, *, p=0.0165 error bars reflect S.D. e) Representative gel showing actin RT-PCR from single-tardigrade cDNA samples extracted using RNA kit (lanes 2–4) and STST lanes (5–8). Gels were loaded with 6 µL of sample and 1 kb plus DNA Ladder
Figure 4.
Figure 4.. Expression of HSP-70 and HSP-90 transcripts.
a) Representative gel showing amplification of HSP70 from genomic DNA (gDNA; lane 2) and cDNA (lane 3) and HSP90 from gDNA (lane 4) and cDNA (lane 5). Variance in gDNA and cDNA lengths reflects the primer design, which spans an intron. b) Survival of tardigrade post exposure to 23°C and 35°C for 20 minutes. Each data point represents percent survival from a cohort of six animals. T-test found no statistical difference. c) Conditions analyzed. d) Relative expression levels of HSP70β2 at the indicated time post-20-minute heat-shock at 35 °C. Kruskals-Wallis Test with Dunn’s multiple comparisons analysis *, p=0.0339 (1 vs. 0)**, p=0.0043 (1 vs. 4), **, p=0.0097 (1 vs. 6). Each data point represents normalized expression levels from an individual tardigrade RNA extract averaged across three technical replicates. e) Relative expression levels of HSP90α at the indicated time post-20-minute 35°C heat-shock. Brown-Forsythe ANOVA with Dunnett’s T3 multiple comparisons test*, p=0.0382 (1 vs. 0) *, p=0.0421 (1 vs. 4). Each data point represents normalized expression levels from an individual tardigrade RNA extract averaged across three technical replicates. f) Raw Ct values for actin qRT-PCR amplifying either a 150 bp or 527 bp amplicon from all samples presented in panels d and e. Each data point represents Ct from an individual tardigrade RNA extract averaged across three technical replicates; T-test found no statistical difference. g) Standard deviation in Ct values across technical replicates for each extract represented in panels d and e. Reactions amplified an actin amplicon of either 150 bp or 527 bp; T-test found no statistical difference. Some content was created in BioRender. Kirk, M. (2022) BioRender.com/d93s51

Similar articles

References

    1. Møbjerg N., Neves R.C. New insights into survival strategies of tardigrades. Comparative Biochemistry and Physiology -Part A : Molecular and Integrative Physiology. 254 (2021). - PubMed
    1. Jönsson K.I., Harms-Ringdahl M., Torudd J. Radiation tolerance in the eutardigrade Richtersius coronifer. Int. J. Radiat. Biol. 81 (9), 649–656 (2005). - PubMed
    1. Horikawa D.D. et al. Radiation tolerance in the tardigrade Milnesium tardigradum. Int. J. Radiat. Biol. 82 (12), 843–848 (2006). - PubMed
    1. Bruckbauer S.T., Cox M.M. Experimental evolution of extremophile resistance to ionizing radiation. Trends in Genetics. 37 (9), 830–845 (2021). - PMC - PubMed
    1. Jönsson K.I., Hygum T.L., Andersen K.N., Clausen L.K.B., Møbjerg N. Tolerance to Gamma Radiation in the Marine Heterotardigrade, Echiniscoides sigismundi. PLoS One. 11 (12), e0168884 (2016). - PMC - PubMed

Publication types