[Preprint]. 2024 Mar 16:2024.03.15.24304164.
doi: 10.1101/2024.03.15.24304164.

CSF proteomic profiling with amyloid/tau positivity identifies distinctive sex-different alteration of multiple proteins involved in Alzheimer's disease

Affiliations

CSF proteomic profiling with amyloid/tau positivity identifies distinctive sex-different alteration of multiple proteins involved in Alzheimer's disease

Anh N Do et al. medRxiv. .

Abstract

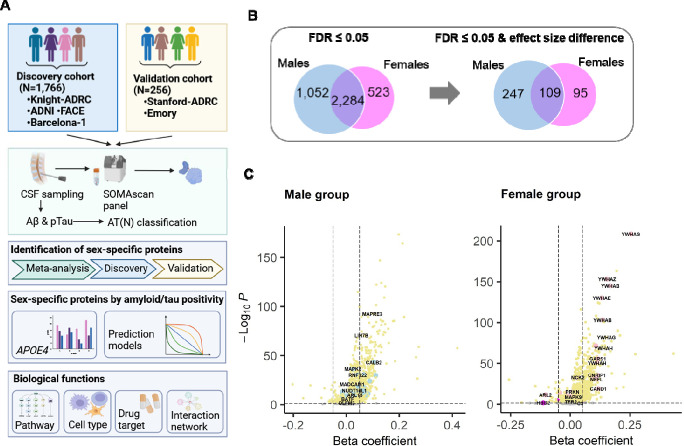
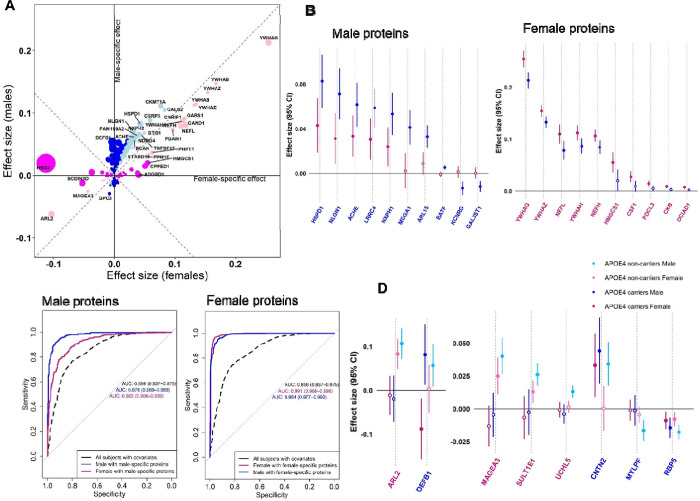
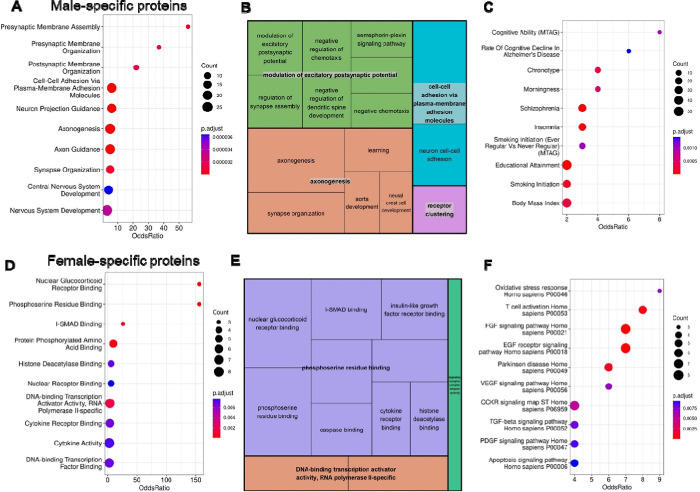
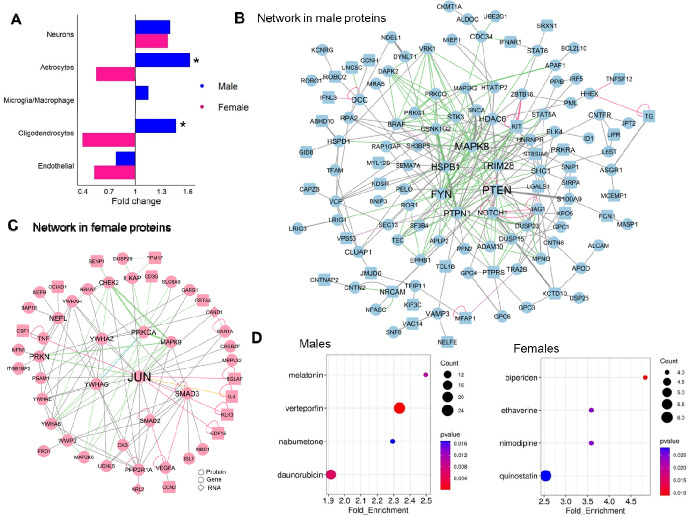
In Alzheimer's disease (AD), the most common cause of dementia, females have higher prevalence and faster progression, but sex-specific molecular findings in AD are limited. Here, we comprehensively examined and validated 7,006 aptamers targeting 6,162 proteins in cerebral spinal fluid (CSF) from 2,077 amyloid/tau positive cases and controls to identify sex-specific proteomic signatures of AD. In discovery (N=1,766), we identified 330 male-specific and 121 female-specific proteomic alternations in CSF (FDR <0.05). These sex-specific proteins strongly predicted amyloid/tau positivity (AUC=0.98 in males; 0.99 in females), significantly higher than those with age, sex, and APOE-ε4 (AUC=0.85). The identified sex-specific proteins were well validated (r≥0.5) in the Stanford study (N=108) and Emory study (N=148). Biological follow-up of these proteins led to sex differences in cell-type specificity, pathways, interaction networks, and drug targets. Male-specific proteins, enriched in astrocytes and oligodendrocytes, were involved in postsynaptic and axon-genesis. The male network exhibited direct connections among 152 proteins and highlighted PTEN, NOTCH1, FYN, and MAPK8 as hubs. Drug target suggested melatonin (used for sleep-wake cycle regulation), nabumetone (used for pain), daunorubicin, and verteporfin for treating AD males. In contrast, female-specific proteins, enriched in neurons, were involved in phosphoserine residue binding including cytokine activities. The female network exhibits strong connections among 51 proteins and highlighted JUN and 14-3-3 proteins (YWHAG and YWHAZ) as hubs. Drug target suggested biperiden (for muscle control of Parkinson's disease), nimodipine (for cerebral vasospasm), quinostatin and ethaverine for treating AD females. Together, our findings provide mechanistic understanding of sex differences for AD risk and insights into clinically translatable interventions.


Conflict of interest statement

Conflict of interest CC has received research support from: GSK and EISAI. AR and MB have received research support from Grifols, Roche, Araclon and Janssen. The funders of the study had no role in the collection, analysis, or interpretation of data; in the writing of the report; or in the decision to submit the paper for publication. CC is a member of the advisory board of Circular Genomics and owns stocks.

Figures

Figure 1:
Figure 1:. Study design and identification of sex-specific proteomic alteration by amyloid/tau positivity in discovery.
(A) Study design. CSF samples of all individuals in the discovery and validation cohorts were quantified for protein levels. Amyloid/tau positivity was determined using AT(N) framework with CSF Aβ42 and pTau levels. First, we identified sex-specific proteomic alternation by amyloid/tau positivity in CSF. Second, we further examined the APOE ε4 modification effect and their predictive performance. Third, to uncover their biological functions, we performed pathway analysis, cell type enrichment, drug targets, and interaction network. (B) Sex-specific proteins identified in discovery follow the two-step strategy. The left panel showed number of proteins passed FDR≤0.05 in association with amyloid/tau positivity. Blue circles showed proteins significant in males. Pink circles showed proteins significant in females. The overlap showed proteins significance in both. The second panel showed number of proteins significantly associated with amyloid/tau positivity and having different effect size between males vs. females (P≤0.05). The same color coding was applied (C) Volcano plot of sex-specific proteins altered by amyloid/tau positivity in males and females identified in discovery. The left panel showed male-specific proteins identified in males. Blue dots show male-specific proteins. Yellow dots show proteins significance in males but having similar effect size between males and females. The right panel showed female-specific proteins identified in females. Pink dots show female-specific proteins. Yellow dots show proteins significance in females but having similar effect sizes between males and females. X-axis shows protein alterations by amyloid/tau positivity. Y-axis shows −log10 p-values of the associations.
Figure 2:
Figure 2:. Sex-specific signature of proteins identified in discovery.
(A) Sex-stratified 451 protein alterations by amyloid/tau positivity in discovery. There were 330 male-specific proteins (in blue dots) and 121 female-specific proteins (in pink dots). The dark blue dots show proteins significant in males only and having effect size stronger in males. The light blue dots show proteins significant in both and having effect size stronger in males. The dark pink dots show proteins significance in females only and having effect size stronger in females. The light pink dots show proteins significance in both and having effect size stronger in females. The size of dots shows magnitude of effect size different between sexes. X-axis shows protein alterations by amyloid/tau positivity in females, and y-axis shows those in males. (B) Forest plot of male and female protein alterations by amyloid/tau positivity in discovery. Y-axis shows beta coefficient with confidence interval of protein changes by amyloid/tau positivity in males and females, separately. Effects in males are in blue lines, and those in females are in pink lines. Male proteins are labeled in blue, and female proteins are in pink. (C) Predictive AUC curve of sex-specific proteins on amyloid/tau positivity. The left panel showed prediction performance of male-specific proteins. Black dashed curve is with basic models including age, sex and APOE genotype in all individuals. Blue curve is with 330 male-specific proteins in males. Pink curve is with 330 male-specific proteins in females. The right panel showed prediction performance of female-specific proteins. Black dashed curve is with basic models including age, sex and APOE genotype in all individuals. Pink curve is with 121 female-specific proteins in females. Blue curve is with 121 female-specific proteins in males. Y-axis shows sensitivity, and x-axis shows specificity. (D) Forest plot of protein changes by amyloid/tau positivity stratified by sex and APOE ε4. Y-axis shows beta coefficient with confidence interval of protein changes by amyloid/tau positivity in females and males, separately. Effects in male APOE ε4 carriers are in dark blue lines, and those in male APOE ε4 non-carriers are in light blue lines. Effects in female APOE ε4 carriers are in dark pink lines, and those in female APOE ε4 non-carriers are in light pink lines. Male proteins are labeled in blue, and female proteins are in pink.
Figure 3:
Figure 3:. Gene ontology (GO) biologic processes of sex-specific proteins
(A) Enrichment analysis of 330 male-specific proteins in discovery revealed presynaptic membrane assembly as the most enriched for these proteins. Top gene ontology (GO) terms (FDR≤0.05) are ranked by odd ratios. Row name shows GO terms. (B) Graphical REVIGO schematic of GO terms (FDR≤0.05) for 330 male-specific proteins reveals modulation of excitatory postsynaptic potential and axonogenesis as the most enriched biological processes. Box size inversely corresponds to FDR for association. Bolded terms indicate higher order GO processes with the consistent color across the GO terms per each higher order term. (C) Enrichment analysis of 330 male-specific proteins in discovery revealed cognitive ability as the most enriched for these proteins. Top gene ontology (GO) terms (FDR≤0.05) are ranked by odd ratios. Row name shows GWAS phenotypes from GWAS catalog. (D) Enrichment analysis of 121 female-specific proteins in discovery nuclear glucocorticoid receptor binding as the most enriched for these proteins. Top gene ontology (GO) terms (FDR≤0.05) are ranked by odd ratios. Row name shows GO terms. (E) Graphical REVIGO schematic of GO terms (FDR≤0.05) for 121 female-specific proteins reveals modulation of phosphoserine residue binding as the most enriched biological processes. Box size inversely corresponds to FDR for association. Bolded terms indicate higher order GO processes with the consistent color across the GO terms per each higher order term. (F) Enrichment analysis of 121 female-specific proteins in discovery revealed oxidative stress response and T-cell activation as the most enriched for these proteins. Top gene ontology (GO) terms (FDR≤0.05) are ranked by odd ratios. Row name shows human biological pathways.
Figure 4:
Figure 4:. Functional characterization of the sex-specific proteins.
(A) Cell types enriched for 451 sex-specific proteins. Blue bars show male-specific proteins. Pink bars show female-specific proteins. The black vertical line shows fold enrichment at 1 to separate over or under enrichment. X-axis shows fold enrichments. Row name shows cell types. The star indicates the significant difference of cell type enrichment between sexes (P<0.05). (B &C) Molecular interaction networks of male-specific proteins and female-specific proteins from ConsensusPathDB, respectively. Blue dots show male-specific proteins. Pink dots show female-specific proteins. Circle shapes indicate proteins. Rectangle shapes indicate genes. Diamond shapes indicate RNA. The size of dots shows the number of other dots directly connecting to the dots. The thickness of edges shows the number of prior publications supporting the interactions. Green edges indicate biochemical interactions. Pink edges indicate gene regulatory interaction. Grey edges indicate protein interactions. Hubs of the networks with more interactions to other genes/proteins were shown in the middle of the network. (D) Drug target prediction using the sex-stratified effects of the 451 sex-specific proteins with left panel for male-specific proteins in males and right panel for female-specific proteins. Top drug targets (FDR≤0.05) are ranked by odd ratios. Row name shows drug names.

Similar articles

References

    1. Rajan K.B., et al. Population estimate of people with clinical Alzheimer’s disease and mild cognitive impairment in the United States (2020–2060). Alzheimers Dement 17, 1966–1975 (2021). - PMC - PubMed
    1. Knopman D.S., et al. Alzheimer disease. Nat Rev Dis Primers 7, 33 (2021). - PMC - PubMed
    1. Jessen F., et al. A conceptual framework for research on subjective cognitive decline in preclinical Alzheimer’s disease. Alzheimers Dement 10, 844–852 (2014). - PMC - PubMed
    1. Scheltens P., et al. Alzheimer’s disease. Lancet 397, 1577–1590 (2021). - PMC - PubMed
    1. van Dyck C.H., et al. Lecanemab in Early Alzheimer’s Disease. N Engl J Med 388, 9–21 (2023). - PubMed

Publication types