[Preprint]. 2024 Mar 16:2024.03.14.585083.
doi: 10.1101/2024.03.14.585083.

Mapping the Cellular Biogeography of Human Bone Marrow Niches Using Single-Cell Transcriptomics and Proteomic Imaging

Affiliations

Mapping the Cellular Biogeography of Human Bone Marrow Niches Using Single-Cell Transcriptomics and Proteomic Imaging

Shovik Bandyopadhyay et al. bioRxiv. .

Update in

Abstract

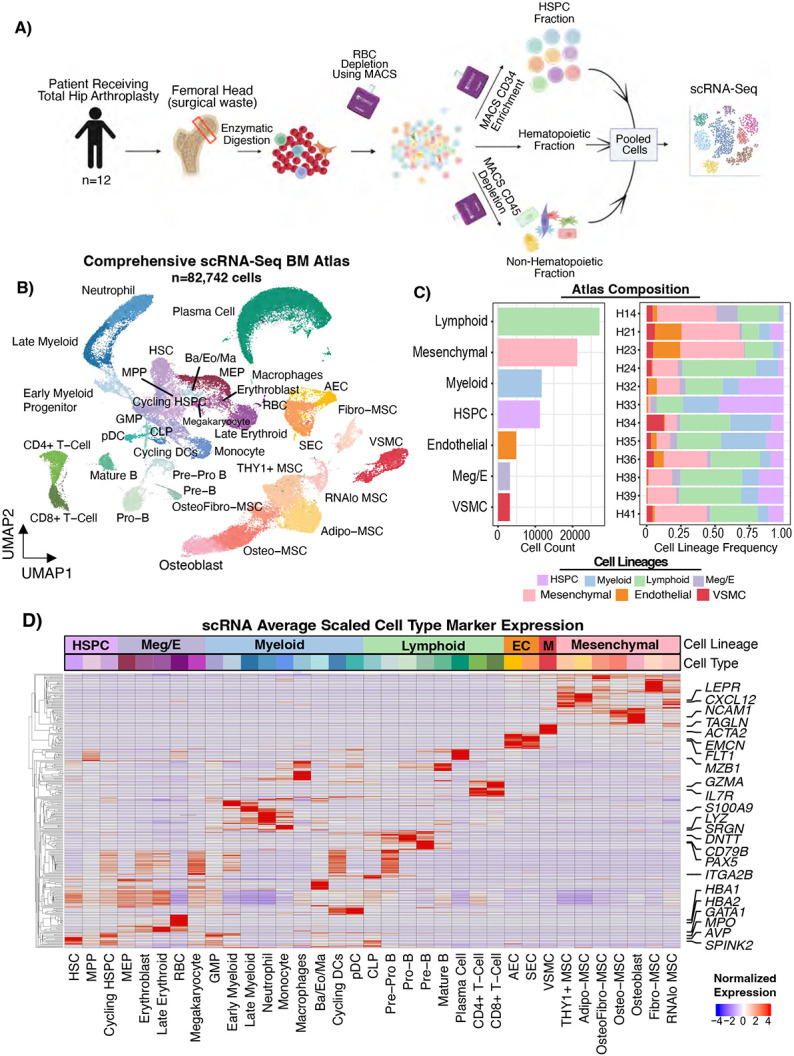
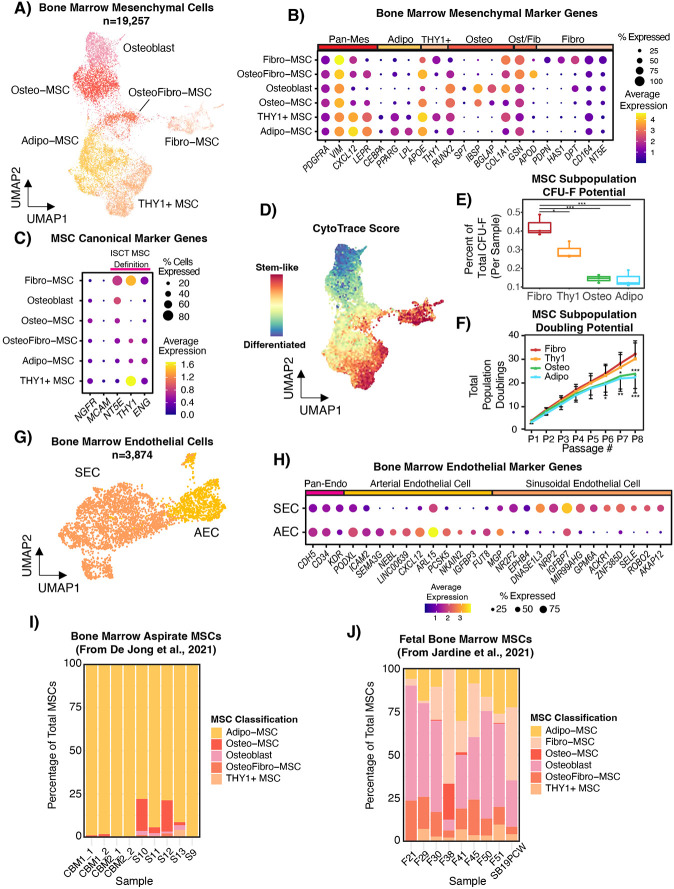
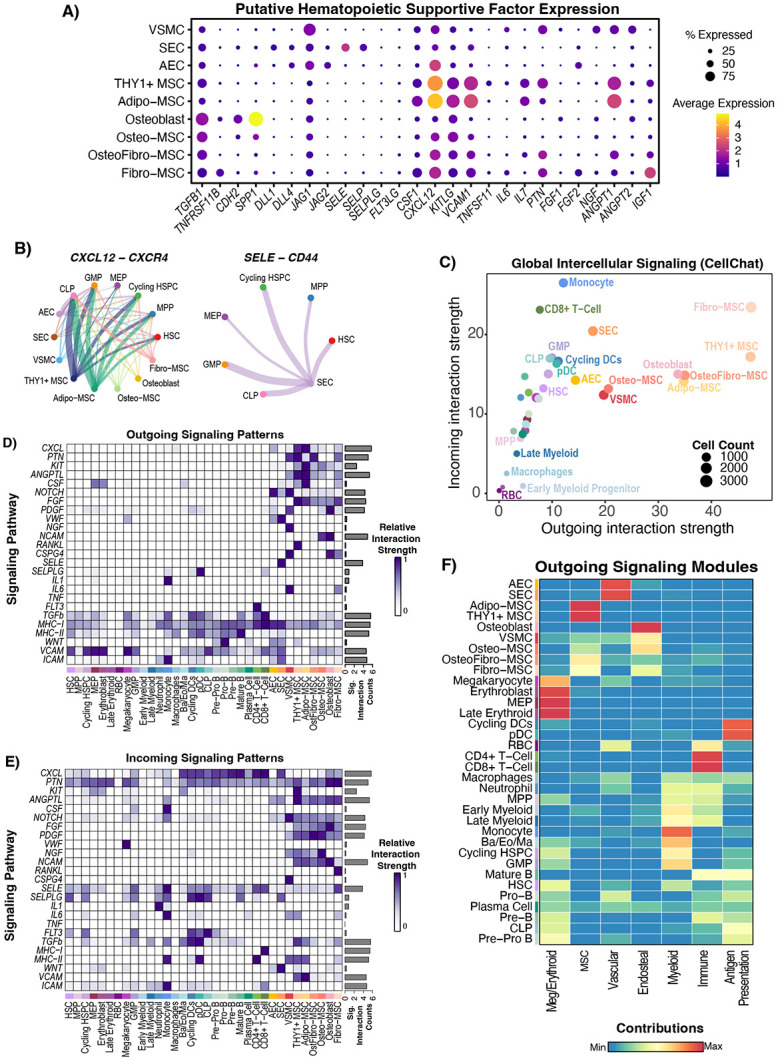
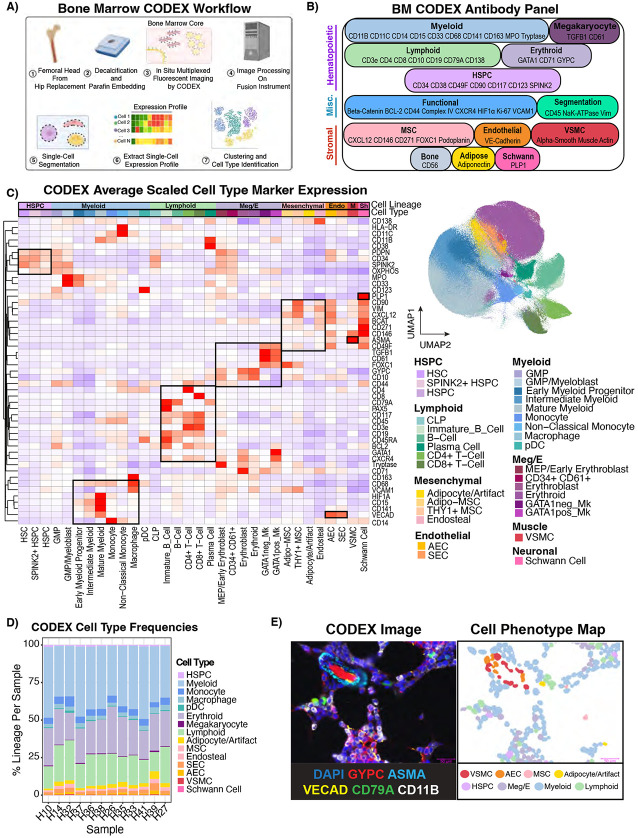
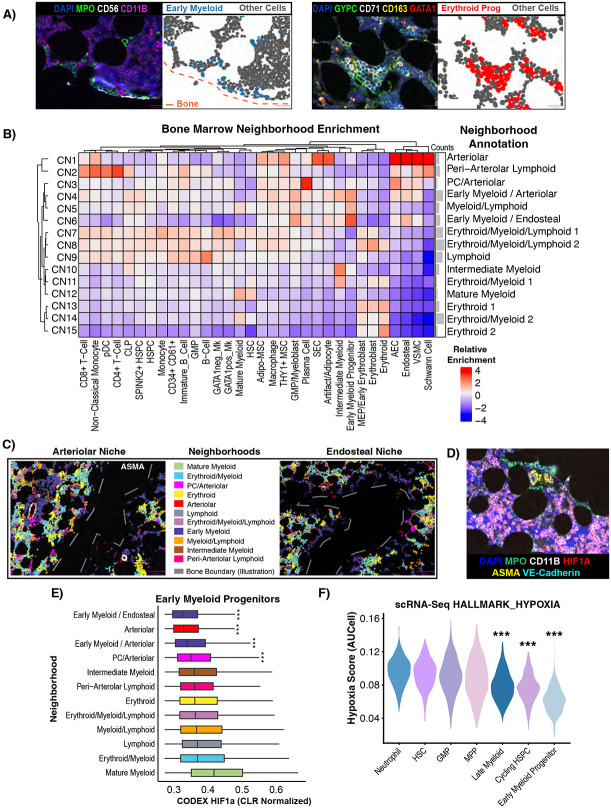
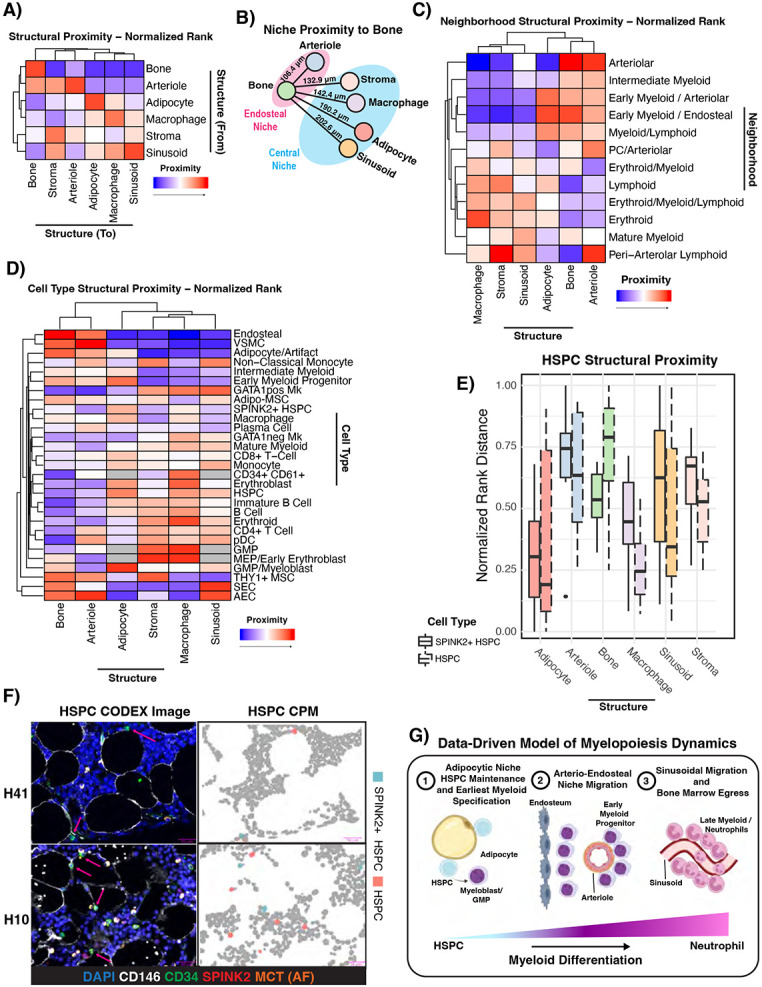
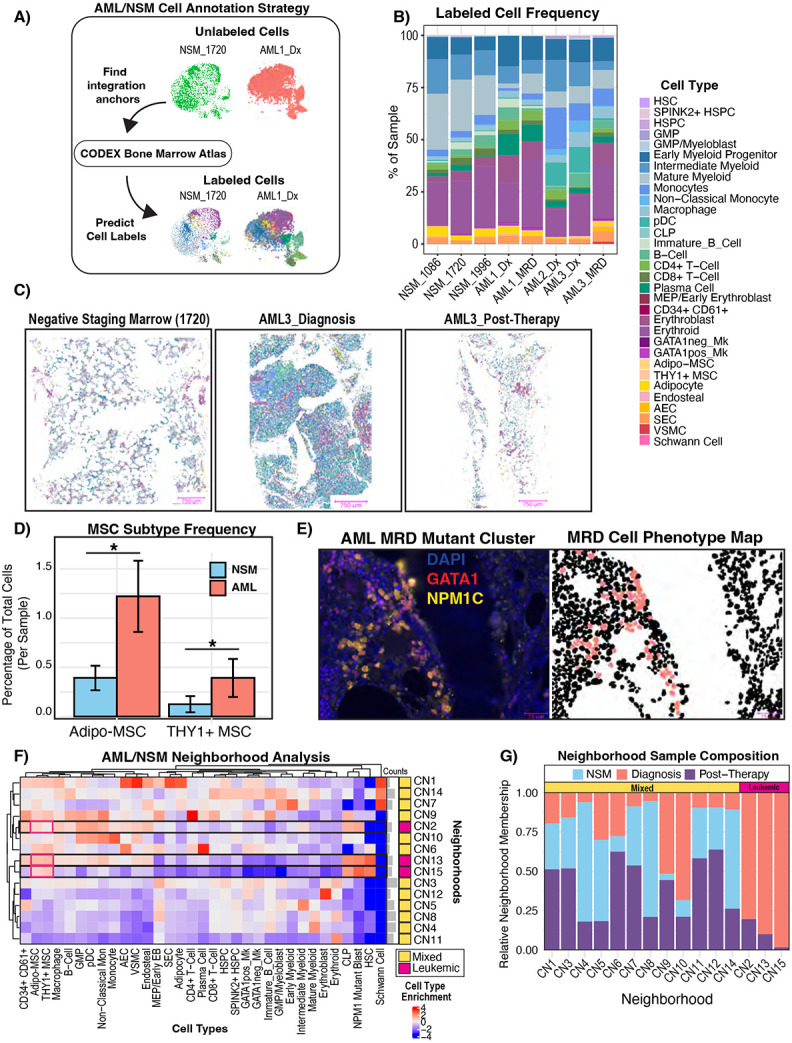
The bone marrow is the organ responsible for blood production. Diverse non-hematopoietic cells contribute essentially to hematopoiesis. However, these cells and their spatial organization remain largely uncharacterized as they have been technically challenging to study in humans. Here, we used fresh femoral head samples and performed single-cell RNA sequencing (scRNA-Seq) to profile 29,325 enriched non-hematopoietic bone marrow cells and discover nine transcriptionally distinct subtypes. We next employed CO-detection by inDEXing (CODEX) multiplexed imaging of 18 individuals, including both healthy and acute myeloid leukemia (AML) samples, to spatially profile over one million single cells with a novel 53-antibody panel. We discovered a relatively hyperoxygenated arterio-endosteal niche for early myelopoiesis, and an adipocytic, but not endosteal or perivascular, niche for early hematopoietic stem and progenitor cells. We used our atlas to predict cell type labels in new bone marrow images and used these predictions to uncover mesenchymal stromal cell (MSC) expansion and leukemic blast/MSC-enriched spatial neighborhoods in AML patient samples. Our work represents the first comprehensive, spatially-resolved multiomic atlas of human bone marrow and will serve as a reference for future investigation of cellular interactions that drive hematopoiesis.


Conflict of interest statement

Declaration of Interests The authors declare no competing interests.

Figures

Figure 1 –
Figure 1 –. A Single-Cell transcriptomic atlas of hematopoietic and non-hematopoietic cells of human bone marrow.
A) Schematic describing the sample collection and cell isolation strategy. Magnetic-activated cell sorting (MACS) separation of hematopoietic, stem/progenitor, and mesenchymal fractions were performed and then pooled into one scRNA-Seq reaction per patient. B) UMAP representation of 82,742 single-cell transcriptomes from bone marrow of 12 individuals. AEC, arterial endothelial cell. SEC, sinusoidal endothelial cell. VSMC, vascular smooth muscle cell. Ba, Basophil. Eo, Eosinophil. Ma, Mast Cell. RBC, red blood cell. pDC, plasmacytoid dendritic cell. CLP, common lymphoid progenitor. MEP, megakaryocyte erythroid progenitor. GMP, granulocyte monocyte progenitor. MPP, multipotent progenitor. HSPC, hematopoietic stem and progenitor cell. HSC, hematopoietic stem cell. Meg/E, megakaryocyte/erythroid. MSC, mesenchymal stromal cell. C) Bar plots showing the cell counts for each lineage captured (left) and the per sample cell lineage frequencies normalized by the total cells in each sample (right). D) Heatmap with normalized gene expression scaled by column (cell type) showing the gene expression of key cell type marker genes. Rows were clustered such that genes expressed in similar cell types cluster together. The top two most significant genes by adjusted p-value comparing each cell type to all other cell types were plotted. Selected marker genes for each lineage were labeled. EC, endothelial cell. M, vascular smooth muscle.
Figure 2 –
Figure 2 –. Defining the non-hematopoietic cellular composition of human bone marrow.
A) UMAP computed from 19,257 mesenchymal cells from 12 individuals showing different mesenchymal subsets, with RNAlo MSCs being excluded. B) Dot plot showing normalized expression of key mesenchymal marker genes in MSC subsets. Rows and columns were manually ordered. C) Dot plot showing the normalized expression of literature-derived marker genes for human MSCs including NT5E(CD73), THY1(CD90), and ENG(CD105). NGFR (CD271) and MCAM (CD146) have also been described as canonical MSC markers. D) CytoTRACE analysis projected onto the MSC UMAP showing the predicted differentiation score, where higher values imply the cell is more primitive. E) Boxplots showing the relative colony forming potential (number of colonies produced by each cell type divided by total colonies from each sample, each data point is one sample) of sorted Fibro-MSC (CD45− CD38− CD235ab− VECAD− PDPN+) , THY1+ MSC (CD45− CD38− CD235ab− VECAD− PDPN− LEPR+ CD90+), Adipo-MSC (CD45− CD38− CD235ab− VECAD− PDPN− LEPR+ CD90−), and osteolineage cells (CD45− CD38− CD235ab− VECAD− PDPN− CD56+). P-values were computed as Fibro-MSC vs. all by Dunnett’s Multiple Comparisons test. F) Line plot showing the population doublings over the course of cell culturing for eight passages, where all cells were passaged every 7 days. P-values are computed as Fibro-MSC vs other MSCs by two-way ANOVA. G) UMAP showing 3,874 endothelial cells from the 12 individuals. SEC – Sinusoidal Endothelial Cells, AEC – Arterial Endothelial Cells. H) Dot plot showing normalized expression of top differentially expressed genes by adjusted p-value between endothelial subsets, as well as CDH5, CD34, and KDR which were manually selected as pan-endothelial markers. I) MSCs from human bone marrow aspirate reported from De Jong et al., Nature Immunology, 2021 were reference mapped to our scRNA-Seq atlas and the cell type labels were predicted. J) Human fetal bone marrow mesenchymal cells from Jardine et al., Nature, 2021 were reference mapped to our scRNA-Seq atlas and the cell labels were predicted.
Figure 3 –
Figure 3 –. Cell-cell communication analysis reveals diverse signaling patterns between hematopoietic and non-hematopoietic cell types.
A) Dot plot showing the expression of manually curated supportive factors for hematopoiesis in mesenchymal and endothelial populations. RNAlo MSCs were removed from the analysis as in Figure 2. B) Chord diagrams showing significant interactions between source mesenchymal/endothelial cell types and target HSPC and precursor cell types. Absence of a node (either source or target) means that there were no significant interactions between that cell type and the targets. Thickness of the line corresponds to the strength of the predicted interaction. C) CellChat network analysis with cell types scored based on their outgoing and incoming contributions to the network, where strength is defined by edge weight in the network and the count refers to the number of cells in each group. D-E) Outgoing (ligand enriched) and incoming (receptor enriched) significant signaling predictions were scored for each annotated signaling pathway, and the strength of signaling (edge weights) for each cell type was scaled and plotted by pathway. The barplot on the right-hand side of each panel shows the total signaling strength (network edge weights for that group of L/R pairs) across all cell groups, illustrating whether a pathway is broadly activated or not. F) Non-negative matrix factorization (NMF) was implemented within CellChat to identify coherent modules of outgoing signaling and the contribution of each cell type to the pattern is scored and plotted. NMF-derived signaling patterns were manually annotated based on the pathways and cell types enriched in the pattern.
Figure 4 –
Figure 4 –. 54-plex CODEX imaging reveals the spatial cellular topography of human bone marrow.
A) Schematic depicting the CODEX experimental and computational workflow leading to cell type identification. B) Diagram showing the 54-plex CODEX panel (53 antibodies + DAPI) split by target cell population. C) Heatmap showing average centered-log-odds ratio normalized expression per cell type scaled and clustered by protein showing the marker protein expression is consistent with literature knowledge (Left). Cell types were annotated by unsupervised clustering and manual gating as described in Materials and Methods. Boxes were manually drawn to highlight coordinate marker expression. UMAP showing the 803,131 single cells in the CODEX atlas from 12 individuals colored by cell type (Right). Adipocytes were labeled with /Artifact because this population contained a mixture of true adipocytes and artifactual staining. HSPC – Hematopoietic Stem and Progenitor Cell. Meg/E-Megakaryocyte/Erythroid, Endo-Endothelial, M-Vascular Smooth Muscle, Sh-Schwann Cells. D) Stacked bar plot showing cell type frequencies normalized by total cells per sample. E) CODEX image (left) is paired with the cell phenotype map (CPM,right). An arteriolar structure and hematopoietic cells are shown using selected relevant fluorescent markers, which is juxtaposed with the same image with the cellular segmentation masks colored by cell type showing how CODEX allows single-cell mapping of the bone marrow microenvironment.
Figure 5 –
Figure 5 –. Neighborhood analysis reveals an oxygen-rich arteriolar/endosteal niche for GMP/early myeloid progenitor cells.
A) CODEX images juxtaposed with cell phenotype maps (CPMs) showing endosteal localization pattern of MPO+ early myeloid progenitors (CPM of EMPs) (left) and erythroblastic islands with CD163+ macrophages and GYPC+ CD71+ erythroid progenitors (CPM of EPs) (right). All other cells were colored grey. B) Neighborhood analysis performed by clustering the cell type frequency vectors of the 10 nearest neighbors of each cell, and a heatmap was generated showing the relative enrichment of each cell type normalized by neighborhood. Neighborhood names were manually assigned based on the relative enrichment of the cell types present. Downstream of this, neighborhoods with the same manual annotation (e.g. Erythroid 1 and Erythroid 2) are combined. C) Cell phenotype masks colored by neighborhood membership were plotted alongside ASMA fluorescent signal (left only). Arteriolar and endosteal niches for early myeloid progenitors were made the same color for the purpose of this visualization. Bone boundaries were manually annotated due to the bone typically detaching from the slide during the antigen retrieval process. D) Fluorescent CODEX image showing the endosteal MPO+ early myeloid progenitors not expressing HIF1a, in contrast to more central, mature myeloid elements. E) Boxplots showing the centered log ratio (CLR)-normalized HIF1a expression levels in early myeloid progenitors split by neighborhood membership, showing that HIF1a levels vary between neighborhoods in addition to cell type. F) Violin plots showing that the populations identified by scRNA-Seq which are analogous to early myeloid progenitors in CODEX data also have low GSEA Hallmark hypoxia gene set scores calculated by AUCell in the scRNA-Seq data.
Figure 6 –
Figure 6 –. Comprehensive structural analysis of bone marrow microenvironment uncovers adipocytic localization of Lin− HSPCs.
A) Hierarchically clustered heatmap showing the normalized rank proximity from each microenvironmental structure to each structure. Data is from all 12 samples. Each structure was ranked by its proximity to each other structure in each sample, and the rank was normalized such that a value of 0 means most proximal and 1 means least proximal. The color scale was adjusted such that 0 is red and 1 is blue. B) Data-driven illustration of structural proximity in normal bone marrow. Edge lengths are scaled to the median normalized rank proximity (where lower numbers mean more proximal) of each structure, and the physical median distance across 12 samples is labeled above each line. C-D) Hierarchically clustered heatmap showing the normalized rank proximity of each neighborhood and cell type to each type of microenvironmental structure. Data is from all 12 samples, except when a cell type or neighborhood was too rare to rank in a sample. Each cell type or neighborhood was ranked by its proximity to each structure in each sample, and the rank was normalized such that a value of 0 means most proximal and 1 means least proximal. The color scale was adjusted such that 0 is red and 1 is blue. Grey color means that there weren’t enough cells (<10 in at least half of samples) in the annotated region to include in the analysis for that cell type. Immunophenotypic HSCs, CLPs, and Schwann cells were excluded completely from the cell type analysis by this criterion. E) Boxplot showing the normalized rank proximity of Lin− HSPCs (dashed outline) and Lin− SPINK2+ HSPCs (solid outline) to each microenvironmental structure. F) Representative CODEX images and associated CPMs from two samples showing the peri-adipocytic localization of both HSPCs and SPINK2+ HSPCs. G) Cartoon schematic showing the revised model of human myelopoiesis, where adipocyte-adjacent HSPCs give rise to the earliest myeloid committed cells, which migrate to mature in an arterio-endosteal niche, and finish their maturation and egress in the sinusoidal/central niche.
Figure 7 –
Figure 7 –. Unsupervised single-cell mapping of AML reveals stromal expansion and MSC-enriched AML-specific neighborhoods.
A) Schematic showing our unsupervised label transfer computational approach. Reciprocal PCA (RPCA) integration was used to predict cell labels in NSM and AML samples based on their proteomic similarity to the annotated normal atlas presented in Figure 4. B) Bar plot showing the cell type frequencies in each sample. AML1_Dx: n= 9,334 cells, AML1_MRD: n= 68808 cells, AML2_Dx: n- 63412 cells, AML3_Dx: n= 37063 cells, AML3_MRD: n = 17,035 cells, NSM_1086: n =14,097 cells, NSM_1720: n = 118,643 cells, NSM_1996: n= 32,560 cells C) Cell phenotype maps (CPMs) shown for representative images of each sample. Masks are colored by cell type and share a legend with panel B. D) Bar plot showing per sample frequency of MSCs in AML (both diagnostic and MRD) vs NSM. MSC frequency was calculated as the proportion of cells in each sample which had the predicted label “Adipo-MSC” or “THY1+ MSC”. The distribution of MSC subtype frequencies in AML sample was compared to that of NSM samples using a two-sided t-test. E) CODEX image showing clustering of rare residual NPM1 mutant blasts which also stained positive for GATA1, juxtaposed with the CPM showing these mapped MRD cell (salmon color) locations. The blank region extending from top to bottom separating the two cellular regions is bone. F) Heatmap showing the neighborhood cell enrichments (artifacts removed, AML: n=175365, NSM: n = 152198). Cell type enrichment (fold change) was calculated as previously described and scaled by cell type frequency (by column) to highlight which neighborhoods most of each cell type was found in. G) Stacked bar plot showing the relative frequency of each sample type in each neighborhood. Frequencies were normalized by total cell number per sample type (AML_Diagnosis, AML_Post-Therapy, NSM) so that total cell count differences between the sample groups do not skew the results. The mixed neighborhoods were defined as any neighborhood which had cells from both AML and NSM samples, whereas AML-specific neighborhoods were defined by only being found in diagnostic or post-therapy AML samples.

References

    1. Fröbel J., Landspersky T., Percin G., Schreck C., Rahmig S., Ori A., Nowak D., Essers M., Waskow C., and Oostendorp R.A.J. (2021). The Hematopoietic Bone Marrow Niche Ecosystem. Front Cell Dev Biol 9, 705410. 10.3389/fcell.2021.705410. - DOI - PMC - PubMed
    1. Pinho S., and Frenette P.S. (2019). Haematopoietic stem cell activity and interactions with the niche. Nat Rev Mol Cell Biol 20, 303–320. 10.1038/s41580-019-0103-9. - DOI - PMC - PubMed
    1. Schofield R. (1978). The relationship between the spleen colony-forming cell and the haemopoietic stem cell. Blood Cells 4, 7–25. - PubMed
    1. Tikhonova A.N., Dolgalev I., Hu H., Sivaraj K.K., Hoxha E., Cuesta-Domínguez Á., Pinho S., Akhmetzyanova I., Gao J., Witkowski M., et al. (2019). The bone marrow microenvironment at single-cell resolution. Nature 569, 222–228. 10.1038/s41586-019-1104-8. - DOI - PMC - PubMed
    1. Comazzetto S., Shen B., and Morrison S.J. (2021). Niches that regulate stem cells and hematopoiesis in adult bone marrow. Dev Cell 56, 1848–1860. 10.1016/j.devcel.2021.05.018. - DOI - PMC - PubMed

Publication types