[Preprint]. 2025 May 16:2024.03.08.584053.
doi: 10.1101/2024.03.08.584053.

Cell Marker Accordion: interpretable single-cell and spatial omics annotation in health and disease

Affiliations

Cell Marker Accordion: interpretable single-cell and spatial omics annotation in health and disease

Emma Busarello et al. bioRxiv. .

Update in

Abstract

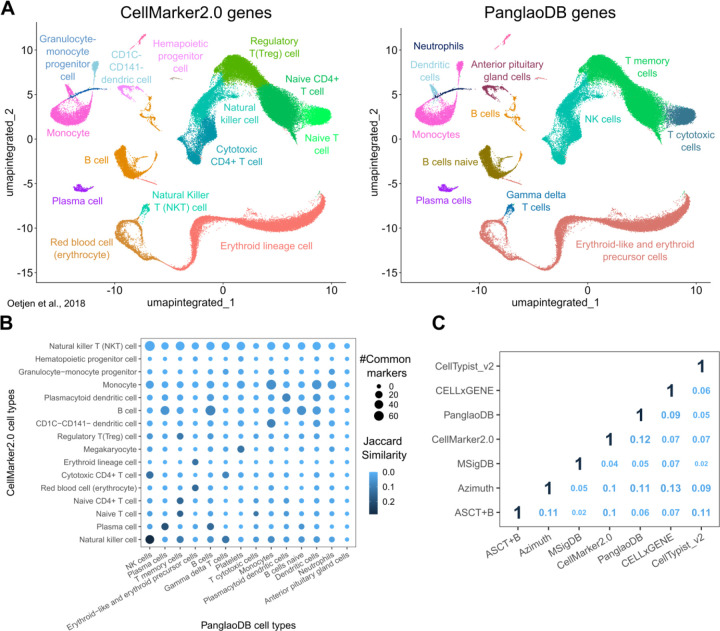
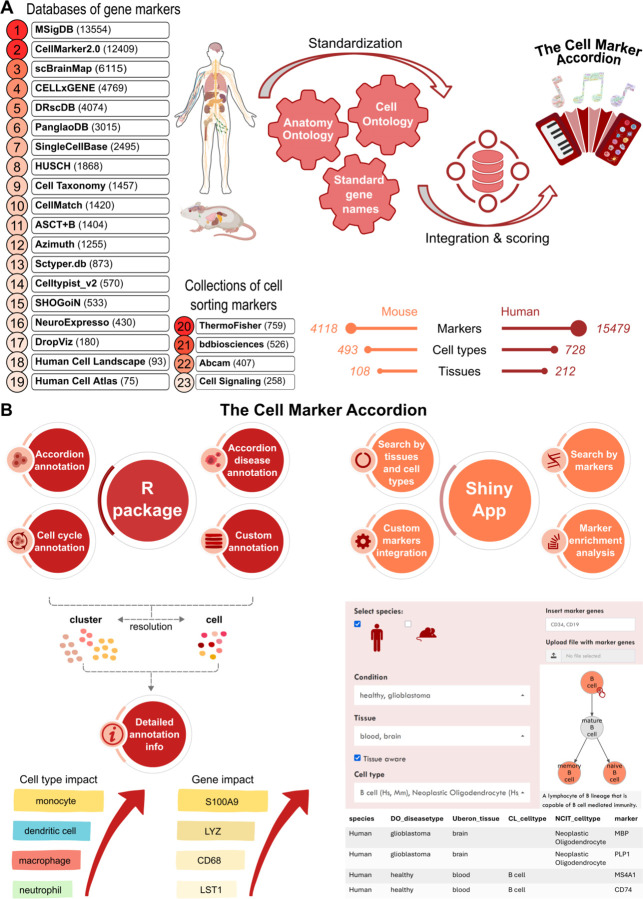
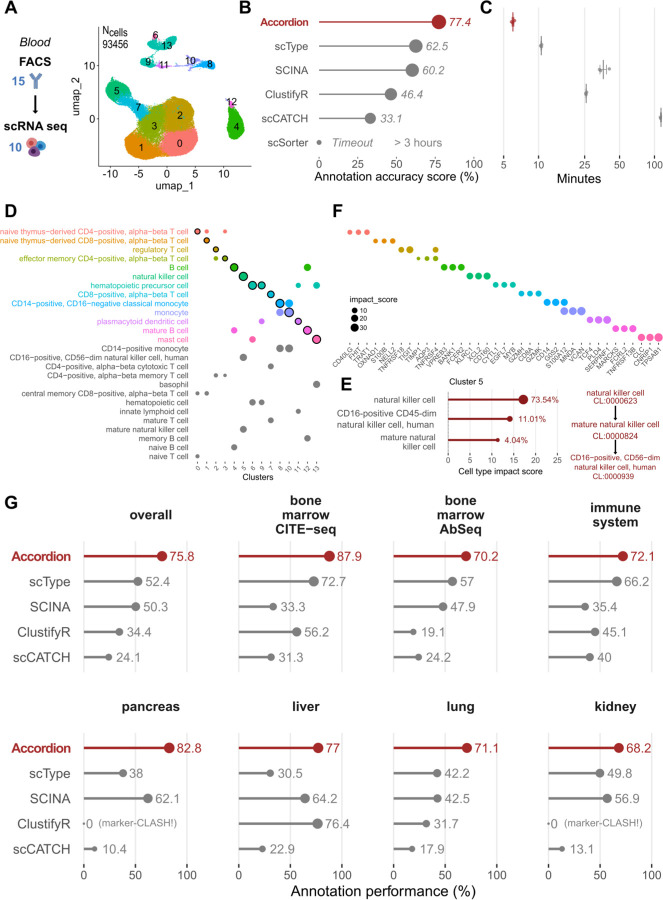
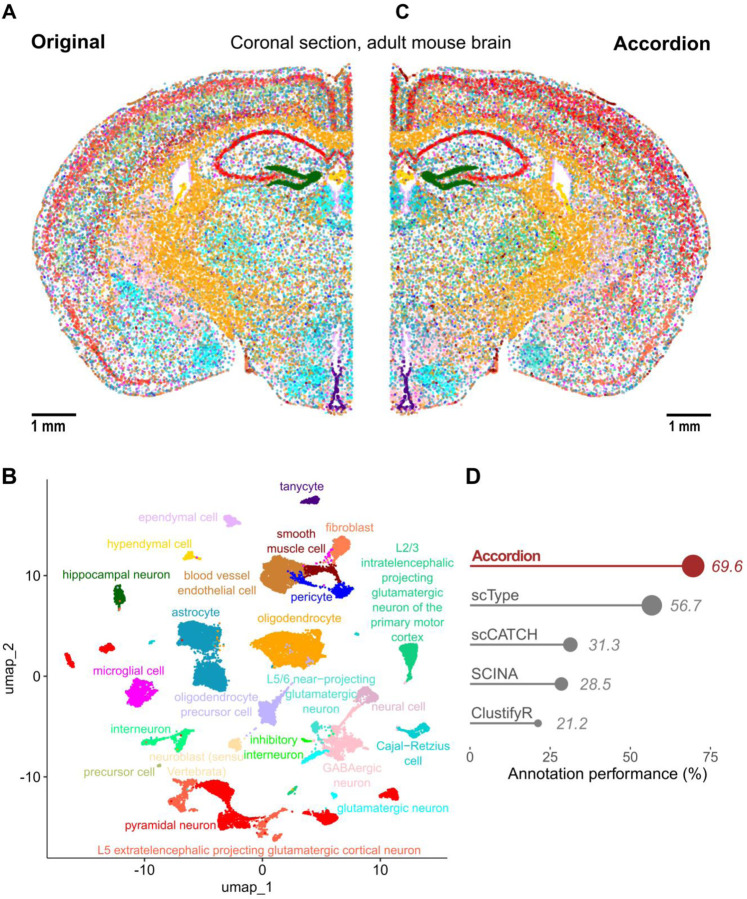
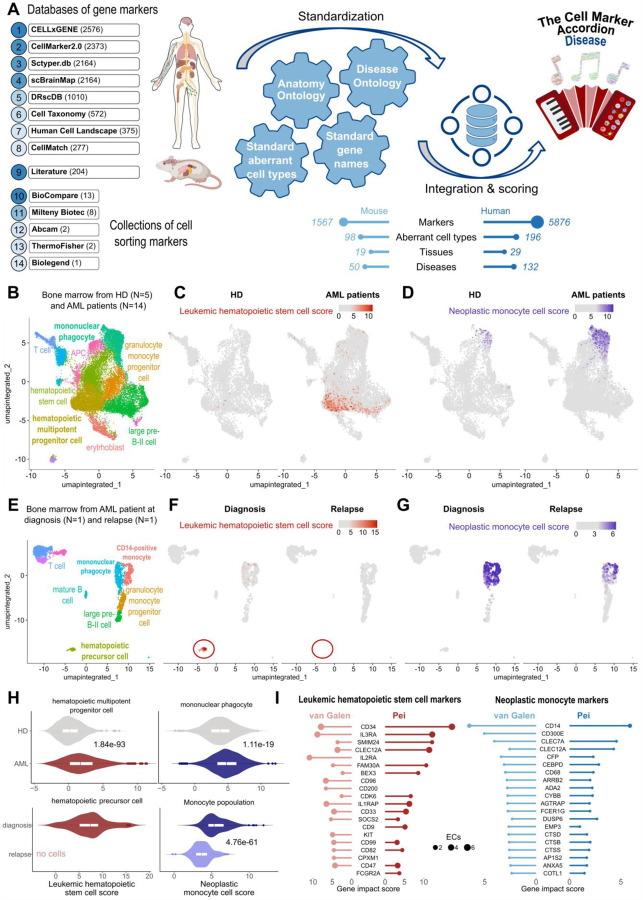
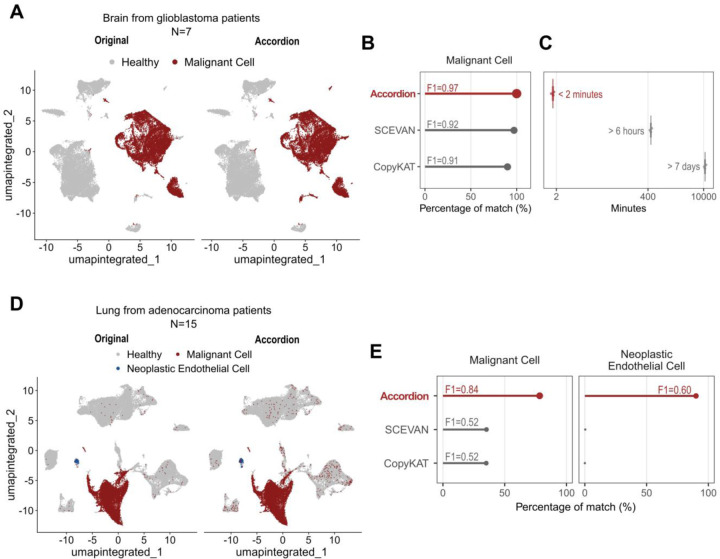
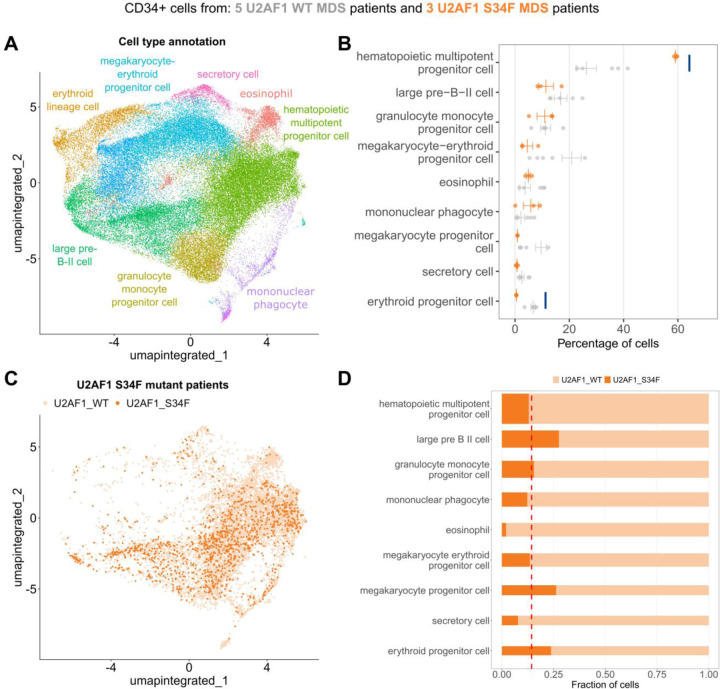
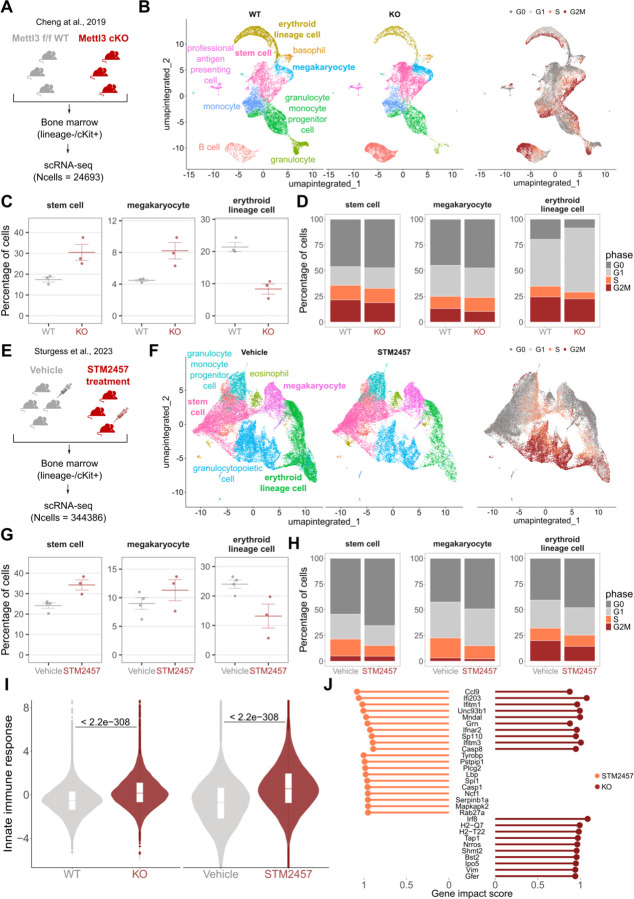
Single-cell technologies offer a unique opportunity to explore cellular heterogeneity in health and disease. However, reliable identification of cell types and states represents a bottleneck. Available databases and analysis tools employ dissimilar markers, leading to inconsistent annotations and poor interpretability. Furthermore, current tools focus mostly on physiological cell types, limiting their applicability to disease. We developed the Cell Marker Accordion, a user-friendly platform providing automatic annotation and unmatched biological interpretation of single-cell populations, based on consistency weighted markers. We validated our approach on multiple single-cell and spatial datasets from different human and murine tissues, improving annotation accuracy in all cases. Moreover, we show that the Cell Marker Accordion can identify disease-critical cells and pathological processes, extracting potential biomarkers in a wide variety of disease contexts. The breadth of these applications elevates the Cell Marker Accordion as a fast, flexible, faithful and standardized tool to annotate and interpret single-cell and spatial populations in studying physiology and disease.


Conflict of interest statement

Competing Interests S.H., consultancy, Forma Therapeutics. Other authors declare no competing financial interests.

Figures

Fig.1:
Fig.1:. Heterogeneity in marker gene databases leads to inconsistent single-cell annotations.
A Cell type identification by automatic annotation with ScType in a published bone marrow dataset, using markers from CellMarker2.0 (left) and PanglaoDB (right) as input. B Overlap between marker genes from CellMarker2.0 (y-axis) and PanglaoDB (x-axis). The dot color represents the Jaccard similarity index, and the dot size indicates the number of common markers in each cell type pair. C Comparison of cell type markers among seven published databases. The numbers indicate the average Jaccard similarity index between each database pair, calculated using all common cell types.
Fig.2:
Fig.2:. The Cell Marker Accordion: a user-friendly platform for annotating and interpreting single-cell populations.
A Workflow for building the Cell Marker Accordion database. Sources are ranked according to their initial number of markers. The resulting numbers of human and murine markers, cell types and tissues are reported. Mouse and human illustrations created in BioRender. Tebaldi, T. (2025) https://BioRender.com/x09w717. B Overview of the main functionalities of the Cell Marker Accordion R package and Shiny app.
Fig.3:
Fig.3:. The Cell Marker Accordion improves the annotation of cell types in multiple tissues from complex single-cell multiomics.
Annotation of single-cell datasets and interpretation of the results with the Cell Marker Accordion, and performance comparison with other marker-based annotation tools. A Dataset of PBMC FACS sorted cells separately profiled with single-cell RNA-seq. 15 surface antibodies were used to sort 10 different cell types, used as the ground truth. Populations identified by the Accordion are color-coded in the UMAP, with cluster numbers. B The Cell Marker Accordion annotation performance, measured as the similarity between the identified cell types and the ground truth (see Methods), is compared against other annotation tools. C Comparison of running times across annotation tools (time axis is log scaled). D Cell Marker Accordion interpretation of results: top three cell types achieving the highest impact score for each cell cluster (the winning cell type is highlighted). E Cell type annotation for cluster 5. Left: top three cell types, ordered according to their impact score, with corresponding percentages of cells in the cluster. Right: Cell Ontology tree of the top three cell types. F Top three marker genes with the highest impact score for each cell type, color-coded as E. G Comparison of annotation performances between the Cell Marker Accordion and other tools in multiple single-cell datasets from different tissues.
Fig.4:
Fig.4:. The Cell Marker Accordion improves the annotation of brain cell types in spatial transcriptomics.
A Spatial map and original annotation of a coronal section of an adult mouse brain, analyzed by MERFISH, based on a panel of 1122 genes. Each dot corresponds to a cell, colored by cell type. Scale bar: 1 mm. B UMAP plot based on the transcriptional profile of each cell, with colors based on the annotation of the Cell Marker Accordion. C Spatial map with cells colored according to cell types as annotated by the Cell Marker Accordion. Scale bar: 1 mm. D Comparison across tools of annotation performances, measured as the similarity between predictions and ground truth.
Fig.5:
Fig.5:. The Cell Marker Accordion identifies disease-critical cell types in acute myeloid leukemia patients.
A Workflow for building the Cell Marker Accordion Disease database. The resulting number of human and murine markers for aberrant cell types associated with various diseases from multiple tissues is reported. Mouse and human illustrations created in BioRender. Tebaldi, T. (2025) https://BioRender.com/x09w717. B Cell Marker Accordion annotation of human bone marrow cells from healthy donors (HD) and acute myeloid leukemia (AML) patients. C-D Identification of leukemic hematopoietic stem cells (LHSCs) (C) and neoplastic monocytes (D). Cells are colored according to the Cell Marker Accordion scores. E Annotation of human bone marrow cells from AML patients at diagnosis and relapse after venetoclax treatment . F-G Identification of LHSCs (F) and neoplastic monocytes (G) in AML patients at diagnosis and relapse. H Distribution of LHSC scores in hematopoietic progenitors (left) and neoplastic monocyte scores in monocyte populations (right) comparing AML patients with healthy donors (top) and AML patients at diagnosis and at time of relapse after venetoclax treatment (bottom). One-tailed Wilcoxon Rank Sum test was used, P-values are displayed. I Comparison of marker genes with the highest impact in defining LHSCs and neoplastic monocytes in the two leukemia datasets, for hematopoietic progenitor cells and monocytes, respectively.
Fig.6:
Fig.6:. The Cell Marker Accordion improves the identification of malignant cells in solid tumors.
A Identification of malignant cells in glioblastoma patients. Left: original annotation. Right: Cell Marker Accordion annotation. B Comparison of annotation performances in identifying glioblastoma malignant cells, measured as the percentage of cells corresponding to the ground truth and the relative F1 scores. C Comparison of annotation running times among tools. D Identification of malignant and neoplastic endothelial cells in lung adenocarcinoma. Left: original annotation. Right: Cell Marker Accordion annotation. E Comparison of annotation performances in identifying malignant cells (left panel) and endothelial cells with a neoplastic gene expression signature (right panel).
Fig.7:
Fig.7:. The Cell Marker Accordion identifies cell type alterations in splicing factor mutant cells from patients with myelodysplastic syndromes.
A Cell Marker Accordion cell type annotation of MDS patients with and without U2AF1 S34F mutation. B Changes in the abundance of hematopoietic cell types among conditions. Orange bars represent patients with U2AF1 S34F mutations, and grey bars represent patients without splicing factor mutations. Data are presented as mean values +/− SEM (U2AF1 WT, n=5, U2AF1 S34F, n=3). Compositional analysis was performed with the scCODA python package based on Bayesian models. Credible and significant results are highlighted as blue bars, using an FDR threshold of 0.1. C Color-code representation of U2AF1 WT and S34F cells in S34F mutant patients. D Fraction of mutant (dark orange) and WT cells (light orange) within each cell type. The height of the bar is proportional to the average number of cells in each population. The dashed line represents the average number of mutant cells across all cell types in U2AF1 S34F patients.
Fig.8:
Fig.8:. The Cell Marker Accordion identifies activation of innate immunity pathways in mice bone marrow.
A Schematic diagram of the single-cell experimental design of Cheng et al., 2019 dataset, comparing bone marrow from Mettl3 KO and WT mice. B Accordion cell types annotation of WT and KO mice and identification of cell cycle phase, based on lists of phase-specific markers. C Changes in the abundance of specific hematopoietic cell types upon Mettl3 KO. The increase in stem cells and megakaryocytes, with the parallel decrease of erythroid lineages, is consistent with literature. D Cell type-specific variations in cell cycle between WT and Mettl3 KO bone marrows. E Schematic diagram of the Mettl3 inhibition experimental design of Sturgess et al., 2023 dataset. F Accordion cell types annotation of mice treated with STM2457 METTL3 inhibitor and vehicle-treated mice, and identification of cell cycle phase. G Changes in the abundance of specific cell types between STM2457 and vehicle mice, consistent with changes observed in panel C. H Cell type-specific variations of the cell cycle between STM2457 and vehicle mice. I Significant increase of the “innate immune response” signature in Mettl3 KO and STM2457 treated cells, consistent with innate immunity activation observed in Gao et al., 2020 . J Genes involved in “innate immune response” pathways and showing the highest impact score in Mettl3 KO or STM2457 treated cells. One-tailed Wilcoxon Rank Sum test was used for panel I. P-values are displayed.

Similar articles

References

    1. Monga I., Kaur K. & Dhanda S. K. Revisiting hematopoiesis: applications of the bulk and single-cell transcriptomics dissecting transcriptional heterogeneity in hematopoietic stem cells. Brief Funct Genomics 21, 159–176 (2022). - PubMed
    1. Wilson N. K. & Göttgens B. Single-Cell Sequencing in Normal and Malignant Hematopoiesis. Hemasphere 2, e34 (2018). - PMC - PubMed
    1. Tian Y. et al. Single-cell transcriptomic profiling reveals the tumor heterogeneity of small-cell lung cancer. Signal Transduction and Targeted Therapy 2022 7:1 7, 1–16 (2022). - PMC - PubMed
    1. Walker B. L., Cang Z., Ren H., Bourgain-Chang E. & Nie Q. Deciphering tissue structure and function using spatial transcriptomics. Communications Biology 2022 5:1 5, 1–10 (2022). - PMC - PubMed
    1. Bressan D., Battistoni G. & Hannon G. J. The dawn of spatial omics. Science 381, eabq4964 (2023). - PMC - PubMed

Publication types