[Preprint]. 2024 Mar 12:2024.03.07.583787.
doi: 10.1101/2024.03.07.583787.

An engineered human cardiac tissue model reveals contributions of systemic lupus erythematosus autoantibodies to myocardial injury

Affiliations

An engineered human cardiac tissue model reveals contributions of systemic lupus erythematosus autoantibodies to myocardial injury

Sharon Fleischer et al. bioRxiv. .

Update in

Abstract

Systemic lupus erythematosus (SLE) is a highly heterogenous autoimmune disease that affects multiple organs, including the heart. The mechanisms by which myocardial injury develops in SLE, however, remain poorly understood. Here we engineered human cardiac tissues and cultured them with IgG fractions containing autoantibodies from SLE patients with and without myocardial involvement. We observed unique binding patterns of IgG from two patient subgroups: (i) patients with severe myocardial inflammation exhibited enhanced binding to apoptotic cells within cardiac tissues subjected to stress, and (ii) patients with systolic dysfunction exhibited enhanced binding to the surfaces of viable cardiomyocytes. Functional assays and RNA sequencing (RNA-seq) revealed that IgGs from patients with systolic dysfunction exerted direct effects on engineered tissues in the absence of immune cells, altering tissue cellular composition, respiration and calcium handling. Autoantibody target characterization by phage immunoprecipitation sequencing (PhIP-seq) confirmed distinctive IgG profiles between patient subgroups. By coupling IgG profiling with cell surface protein analyses, we identified four pathogenic autoantibody candidates that may directly alter the function of cells within the myocardium. Taken together, these observations provide insights into the cellular processes of myocardial injury in SLE that have the potential to improve patient risk stratification and inform the development of novel therapeutic strategies.

Keywords: Autoantibodies; autoimmune disease; cardiac tissue engineering; myocardial inflammation; systemic lupus erythematosus.


Figures

Extended Data Figure 1:
Extended Data Figure 1:. Characterization of engineered cardiac tissues cultured in different media formulations.
(a, b) Representative brightfield (a) and immunofluorescence (b) images of engineered cardiac tissues cultured in standard RPMI-B27 (B27) medium (top) and metabolic maturation (MM) medium (bottom). (c, d) Measurements of calcium handling (c) and contractility (d) of engineered cardiac tissues cultured in B27 medium and MM. (e) Quantification of LDH release into supernatant from engineered cardiac tissues during electrical stimulation at 2 Hz and 6 Hz. Data are the mean ± s.e.m. Individual values are indicated by dots. B27, RPMI-1640 with B27 supplement. MM, metabolic maturation medium. LDH, lactate dehydrogenase. Scale bars in (a) are 500 μm; scale bars in (b) are 200 μm (left) and 10 μm (right).
Extended Data Figure 2:
Extended Data Figure 2:. Indirect immunostaining of engineered cardiac tissues following treatment with patient IgG.
Immunofluorescence images of engineered cardiac tissues treated with IgG isolated from each patient in the Myo− (left) and Myo+ (middle and right) groups, followed by staining with anti-human IgG to visualize patient-specific IgG binding (yellow). Patient samples from the Myo+ group are subclassified as low MFI (middle) and high MFI (right) based on quantification of human IgG staining.
Extended Data Figure 3:
Extended Data Figure 3:. Quantitative analysis of IgG binding to engineered cardiac tissues and individual cells.
(a) Summary of Pearson correlation coefficients of clinical 18F-FDG uptake quantified as SUVs compared with corresponding patient IgG binding levels to engineered tissues in vitro (MFI, second row) and with other clinical data collected as part of the cohort. (b) Example flow cytometry gating strategy used to identify viable cardiomyocytes, i.e., those that are double negative for propidium iodide and Apotracker Green (FITC). These are the cells in Q4. (c) Log-linear correlation between SUVs and MFI.
Extended Data Figure 4:
Extended Data Figure 4:. Functional analysis of engineered cardiac tissue.
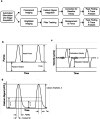
(a) Schematic overview of the automated imaging and analysis pipeline for the engineered cardiac tissues. (b–d) Representative traces of engineered cardiac tissue force generation (b), velocity (c), and calcium signal (d). Metrics used to quantify these traces are depicted on each plot.
Extended Data Figure 5:
Extended Data Figure 5:. Dose-response effect of patient IgG on hiPSC-cardiomyocyte calcium handling.
(a,b) IgG from Myo+SD+ patients demonstrate a clear dose-response effect in hiPSC-derived cardiomyocytes calcium handling measurements of tau (a) and FWHM (b). Data are the mean ± s.e.m. Individual values are indicated by dots; n = 18–24 independent hiPSC-cardiomyocyte samples per group (n = 3 technical replicates for each patient IgG sample); ordinary one-way ANOVA with Tukey’s test for multiple comparisons; * p < 0.05, ** p < 0.005, *** p < 0.001, **** p < 0.0001.
Extended Data Figure 6:
Extended Data Figure 6:. Transcriptomics of engineered cardiac tissues treated with patient IgG.
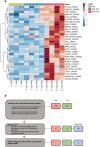
(a) Volcano plot of DEGs between engineered cardiac tissues treated with SLE patient IgG and those treated with healthy control patient IgG. (b) Hierarchical clustering of overall transcriptomics of engineered cardiac tissues treated with IgG from each individual patient.
Extended Data Figure 7:
Extended Data Figure 7:. Gene expression measured by RNA-Seq for selected genes.
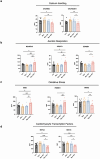
Selected genes for calcium handling (a), Aerobic respiration (b), oxidative stress (c), and cardiomyocyte transcription factors (d). n = 3 technical replicates for each patient IgG sample; ordinary one-way ANOVA with Tukey’s test for multiple comparisons; * p < 0.05, ** p < 0.005, *** p < 0.001, **** p < 0.0001.
Extended Data Figure 8:
Extended Data Figure 8:. CIBERSORTx analysis of cardiomyocytes-specific gene expression profiles.
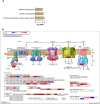
(a) KEGG, pathway analysis of cardiomyocytes-specific DEGs between the Myo+SD+ and the Myo− subgroups. (b) Schematic of KEGG oxidative phosphorylation pathway. Colored boxes indicate differentially expressed genes between the Myo+SD+ and the Myo− subgroups.
Extended Data Figure 9:
Extended Data Figure 9:. PhIP-Seq analysis of patient-specific antigen targets.
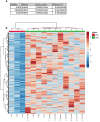
(a) Table summarizing Pearson’s R quantified by correlation between different SSA peptides measured by PhIP-Seq and clinical laboratory measurements of patient SSA antibodies. (b) Hierarchical clustering of peptides increased in SLE compared to healthy controls. Each column represents a patient (green; SLE patients, red; healthy controls). Each row represents a peptide identified by PhIP-Seq.
Extended Data Figure 10:
Extended Data Figure 10:. PhIP-Seq analysis of Myo+SD+ epitope targets and cell surface characterization.
(a) Hierarchical clustering of peptides increased in Myo+SD+ patients compared to Myo− and Myo+SD− patients. Each column represents a patient (yellow: Myo− patients; green: Myo+SD− patients; purple: Myo+SD+ patients). Each row represents an identified epitope. 76 epitopes from 65 proteins. (b) Schematic of surface protein analysis pipeline and quantification of identified proteins.
Figure 1:
Figure 1:
Overview of the experimental design.
Figure 2:
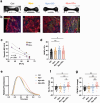
Figure 2:. Distinct patient IgG reactivity with engineered cardiac tissues and hiPSC-cardiomyocytes corresponded with specific clinical outcomes.
(a) Overview of tissue formation, maturation, and treatment with purified patient-derived IgG. (b) Indirect immunofluorescence staining of human IgG (yellow) bound to engineered cardiac tissues (scale bar: 500 μm). (c) Log-linear correlation between clinical measurements of myocardial inflammation (18F-FDG uptake quantified as SUVs) and IgG binding levels to engineered cardiac tissues (MFI). Each dot represents a patient (n = 9). Correlation strength measured by Pearson’s r. (d,e) Immunofluorescence staining of engineered cardiac tissues showing strong IgG binding to condensed nuclei (d, scale bar: 20 μm, bottom panels are higher magnification of region of interest in top panels, top panel is confocal maximum intensity projection, bottom panel is single confocal plane) and apoptotic blebs on the cell surface (e, scale bar: 20 μm, bottom panels are higher magnification of region of interest in top panels, both panels are single confocal planes). (f) Linear correlation between patient EF and corresponding IgG binding levels to the cell surface of viable hiPSC-derived cardiomyocytes (MFI). Each dot represents a patient (n = 9). Correlation strength measured by Pearson’s r. (g) Quantification of patient IgG binding to viable hiPSC-cardiomyocytes based on clinical subgroupings. Data are the mean ± s.e.m; individual values are indicated by dots; n = 9–15 independent staining experiments per group (n = 3 technical replicates for each patient IgG sample); one-way ANOVA with Tukey’s test for multiple comparisons; **** p < 0.001.
Figure 3:
Figure 3:. IgG from SLE patients with myocardial inflammation and systolic dysfunction (Myo+SD+) altered engineered cardiac tissue function and composition.
(a) Brightfield images of engineered cardiac tissue following treatment with patient IgG showing overall tissue morphology (scale bar: 500 μm). (b) Representative immunofluorescence images of engineered cardiac tissue stained to show cardiomyocytes (α-actinin, red) and fibroblasts (vimentin, yellow) following treatment with IgG from patients in each subgroup (scale bar: 50 μm). (c) Linear correlation between patient ejection fraction (EF) and vimentin staining intensity of tissues treated with the corresponding patient IgG. Each dot represents a patient (n = 11). Correlation strength measured by Pearson’s r. (d) Quantification of the percentage of Ki67+ cardiac fibroblasts following treatment with patient IgG. Data are the mean ± s.e.m; individual values are indicated by dots; n= 33–48 independent staining experiments per group (n = 11–12 technical replicates for each patient IgG sample); ordinary one-way ANOVA with Dunnett’s test for multiple comparisons; * p < 0.05, *** p < 0.001. (e) Representative traces of calcium flux in engineered cardiac tissues following treatment with patient IgG. (f, g) Quantification of the parameters tau (f) and FWHM (g) extracted from engineered cardiac tissue calcium transients following treatment with patient IgG. Data are the mean ± s.e.m; individual values are indicated by dots; n = 15–22 independent engineered tissues per group (n = 5–6 technical replicates for each patient IgG sample); ordinary one-way ANOVA with Tukey’s test for multiple comparisons; * p < 0.05, ** p < 0.005, *** p < 0.001. MFI, mean fluorescent intensity; CFs, cardiac fibroblasts; FWHM, full width half max.
Figure 4:
Figure 4:. IgG isolated from SLE patients with myocardial inflammation and systolic dysfunction (Myo+SD+) led to differential tissue transcriptomics and impaired mitochondrial function.
(a) Volcano plots depicting the differential expression between tissues cultured with IgG from the different clinical groups. Genes that are significantly upregulated (FDR < 0.05) are shown in red and genes that are significantly downregulated (FDR < 0.05) are shown in blue. (b) Venn diagram describing the number of DEGs between tissues treated with IgG from Myo+SD+ and either SLE patients with no myocardial inflammation (Myo−) or patients with myocardial inflammation and no systolic dysfunction (Myo+SD−). (c) PCA plot of global gene expression profiles for tissues treated with IgG from different patients. Each point represents the average expression of n=3 independent tissues treated with IgG from the same patient. Numbers refer to patient IDs within each clinical group. (d) KEGG, GO biological process (GO:BP), and GO cellular compartment (GO:CC) pathway analysis of DEGs between the Myo+SD+ and the Myo+SD− groups. (e) Mitochondrial abundance in hiPSC-cardiomyocytes treated with patient IgG from the different groups as measured by MitoTracker fluorescence normalized to the number of nuclei. n = 67–87 fields of view from (n = 6 independent technical replicates for each patient IgG sample; n = 10–16 fields of view per replicate); ordinary one-way ANOVA with Tukey’s test for multiple comparisons; **** p < 0.0001. (f, g) Characterization of mitochondrial performance by Seahorse metabolic flux assay. Data are the mean ± s.e.m; individual values are indicated by dots. n = 8–16 independent assays per group (n = 3–4 technical replicates for each patient IgG sample); ordinary one-way ANOVA with Tukey’s test for multiple comparisons; * p < 0.05, ** p < 0.01. (h) Changes in mitochondrial membrane potential measured by the JC-10 probe. Increasing 520/590 ratios indicate increasing membrane depolarization and mitochondrial dysfunction. Data are the mean ± s.e.m; individual values are indicated by dots. n = 16–24 independent assays per group (n = 5–6 technical replicates for each patient IgG sample); ordinary one-way ANOVA with Tukey’s test for multiple comparisons; * p < 0.05, **** p < 0.0001. (i) ROS accumulation as measured by CellRox fluorescence normalized to the number of nuclei. Data are the mean ± s.e.m; individual values are indicated by dots. n = 65–86 fields of view from (n = 6 independent technical replicates for each patient IgG sample; n = 10–16 fields of view per replicate); ordinary one-way ANOVA with Tukey’s test for multiple comparisons; * p < 0.05, **** p < 0.0001. DEGs, differentially expressed genes; PCA, principal component analysis; OCR, oxygen consumption rate.
Figure 5:
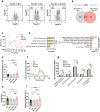
Figure 5:. Identification of unique and potentially pathogenic autoantibody populations in Myo+SD+ patient serum.
(a) PCA plot of differential antigen targets. (b) Venn diagram describing the number of antigen targets in each patient subgroup (c) Venn diagrams describing the number of cardiomyocyte and cardiac fibroblast surface proteins and their overlap. (d) Heatmap of potential pathogenic autoantibodies targeting cardiac cell surface antigens. (e) Linear correlation between patient EF and corresponding read counts of LMO7.

References

    1. Guglin M., Smith C. & Rao R. The spectrum of lupus myocarditis: from asymptomatic forms to cardiogenic shock. Heart Fail Rev 26, 553–560 (2021). - PubMed
    1. Appenzeller S., Pineau C.A. & Clarke A.E. Acute lupus myocarditis: Clinical features and outcome. Lupus 20, 981–988 (2011). - PubMed
    1. Thomas G., et al. Lupus Myocarditis: Initial Presentation and Longterm Outcomes in a Multicentric Series of 29 Patients. J Rheumatol 44, 24–32 (2017). - PubMed
    1. Bartels C.M., et al. Mortality and cardiovascular burden of systemic lupus erythematosus in a US population-based cohort. J Rheumatol 41, 680–687 (2014). - PMC - PubMed
    1. Hak A.E., Karlson E.W., Feskanich D., Stampfer M.J. & Costenbader K.H. Systemic lupus erythematosus and the risk of cardiovascular disease: results from the nurses’ health study. Arthritis Rheum 61, 1396–1402 (2009). - PMC - PubMed

Publication types