[Preprint]. 2024 Oct 9:2024.03.17.585262.
doi: 10.1101/2024.03.17.585262.

An integrative systems-biology approach defines mechanisms of Alzheimer's disease neurodegeneration

Affiliations

An integrative systems-biology approach defines mechanisms of Alzheimer's disease neurodegeneration

Matthew J Leventhal et al. bioRxiv. .

Update in

Abstract

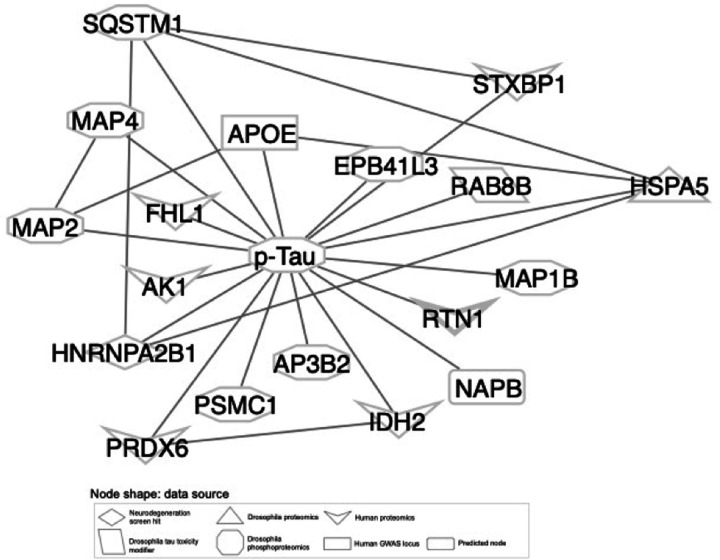
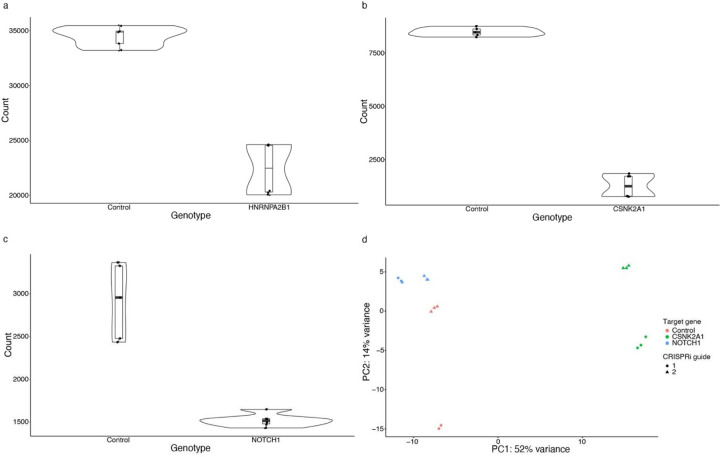
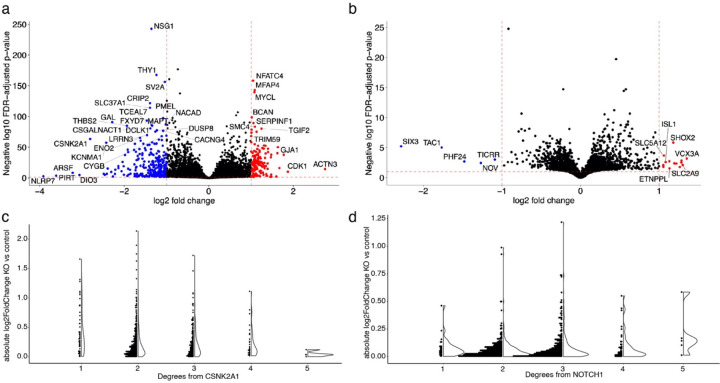
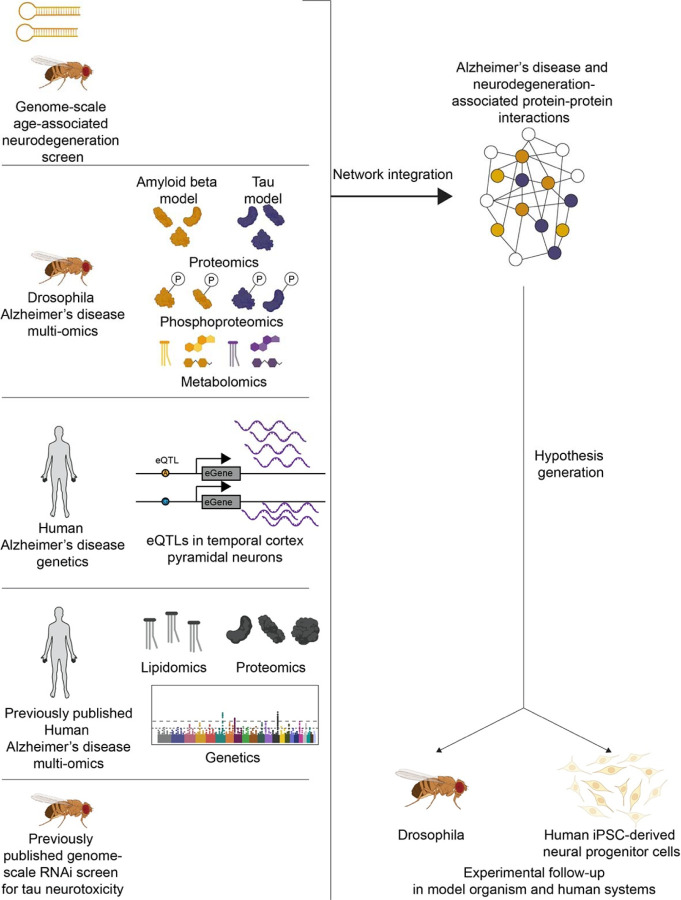
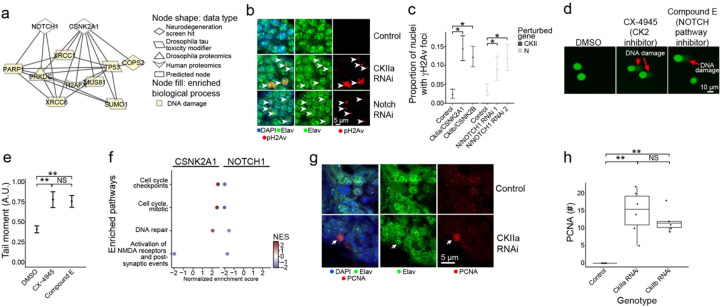
Despite years of intense investigation, the mechanisms underlying neuronal death in Alzheimer's disease, the most common neurodegenerative disorder, remain incompletely understood. To define relevant pathways, we integrated the results of an unbiased, genome-scale forward genetic screen for age-associated neurodegeneration in Drosophila with human and Drosophila Alzheimer's disease-associated multi-omics. We measured proteomics, phosphoproteomics, and metabolomics in Drosophila models of Alzheimer's disease and identified Alzheimer's disease human genetic variants that modify expression in disease-vulnerable neurons. We used a network optimization approach to integrate these data with previously published Alzheimer's disease multi-omic data. We computationally predicted and experimentally demonstrated how HNRNPA2B1 and MEPCE enhance tau-mediated neurotoxicity. Furthermore, we demonstrated that the screen hits CSNK2A1 and NOTCH1 regulate DNA damage in Drosophila and human iPSC-derived neural progenitor cells. Our work identifies candidate pathways that could be targeted to ameliorate neurodegeneration in Alzheimer's disease.


Conflict of interest statement

Competing interests The authors declare no competing financial interests.

Figures

Extended Data Fig. 1
related to Fig. 2: Neurodegeneration screen hits have significant changes in gene expression with respect to age across multiple brain tissues. Heatmap depicts significant linear mixed model regression coefficients between the expression of neurodegeneration screen hits and patient age in human RNA-seq in the Genotype-Tissue Expression project (GTEx) for each brain tissue. Each row is an age-associated neurodegeneration gene while each column indicates the brain tissue in GTEx, grouped by hierarchical clustering. Blue indicates a negative association and red indicates a positive association between gene expression in age as measured by the model regression coefficient. The gene with a positive regression coefficient is HES6.
Extended Data Fig. 2
related to Fig. 2: The average expression of age-associated neurodegeneration genes declines in Alzheimer’s disease-associated excitatory neurons. UMAP projections depict excitatory neurons from Mathys et al. 2019. In the left plot, cells are shaded by whether they belong to clusters overrepresented by cells from control or Alzheimer’s disease patients. The right UMAP shows the average expression of age-associated neurodegeneration genes in this group of excitatory neurons.
Extended Data Fig. 3
related to Fig. 3. a) Boxplots depict the normalized counts of cell type marker genes in the brain in the temporal cortex laser capture microdissected neurons. Boxes are colored by the general cell type represented by the marker gene. Each point represents one bulk RNA-seq sample. b) Heatmap showing significant Pearson correlations between the RNA-seq expression of temporal cortex pyramidal neuron eGenes and Gene Set Variation Analysis signatures for REACTOME pathways. The gene names on the rows are annotated for the regression coefficient representing the association between gene expression and the presence of the associated Alzheimer’s disease eQTL. The legend for these regression coefficients is labeled as “Regression Coefficient”. Columns are clustered with hierarchical clustering.
Extended Data Fig. 4
related to Fig. 3. Volcano plots depicting negative log10 FDR-adjusted p-values and log2 fold changes between case and control in a) proteomics from Aβ1–42 transgenic flies (amyloid β), b) proteomics from tauR406W transgenic flies, c) phosphoproteomics from Aβ1–42 transgenic flies, d) phosphoproteomics from tauR406W transgenic flies, e) metabolomics from Aβ1–42 transgenic flies, and f) metabolomics from tauR406W transgenic flies Blue dots indicate significantly downregulated omics and red dots indicate significantly upregulated omics. The horizontal red dashed line indicates the FDR cut-off at 0.1. g) Dot plot indicating GO terms overrepresented in neurodegeneration screen hits that are differentially abundant in proteomics from Aβ1–42 transgenic flies.
Extended Data Fig. 5
related to Fig. 5: pTau and its first neighbors in the network solution. Nodes are shaped by the data source from which they were contributed.
Extended Data Fig. 6
related to Figs. 5 and 6: Knockdown efficiency and principal component analysis of the NGN2 RNA-seq data. Violin plots depict library-corrected RNA-seq counts in NGN2 neuronal progenitor cells for controls and a) HNRNPA2B1, b) CSNK2A1 or c) NOTCH1 knockdown. d) Principal Component Analysis plot of individual control, NOTCH1 and CSNK2A1 RNA-seq replicates from expression data. Colors indicate the knockdown for each replicate and the shape indicates whether the knockdown was performed with the first or second guide RNA. For control, we used non-targeting guide RNAs.
Extended Data Fig. 7
related to Fig. 6: RNA-seq analysis after knockdown of NOTCH1 and CSNK2A1. Volcano plot depicts differential expression analysis by DeSeq2 of bulk RNA-seq after a) CSNK2A1 CRISPRi knockdown and b) NOTCH1 CRISPRi knockdown in NGN2 iPSC-derived neural progenitor cells. Each dot represents a single gene. The horizontal dashed line indicates the negative log10 Benjamini-Hochberg FDR-adjusted p-value cut-off of 0.1 and the vertical dashed lines indicate the log2 fold change cut-offs of 1 and −1. Red dots indicate significantly upregulated genes (log2 fold change greater than 1) and blue dots indicate significantly downregulated genes (log2 fold change less than −1). c) Dot and volcano plots show the absolute value of the log2 fold change of nodes in the network after CSNK2A1 knockout compared to controls relative to the degree of separation from CSNK2A1. d) Dot and volcano plots show the absolute value of the log2 fold change of nodes in the network after NOTCH1 knockout compared to controls relative to the degree of separation from NOTCH1.
Fig. 1:
Fig. 1:
Overview of analytical framework for multi-omic integration to study the biological processes underlying neurodegeneration. We performed a forward genetic screen for age-associated neurodegeneration in Drosophila. We measured proteomics, phosphoproteomics and metabolomics in amyloid β (gold) and tau (purple) models of Alzheimer’s disease and performed an eQTL meta-analysis of previous Alzheimer’s disease studies. We used a network integration model to integrate these new data with previously published human proteomics, human genetics, human lipidomics, and Drosophila modifiers of tau-mediated neurotoxicity. We tested hypotheses generated from this network model in Drosophila and human iPSC-derived neural progenitor cells. Icons created with Biorender.com.
Fig. 2:
Fig. 2:
a) Geometric mean expression in transcripts per million (TPM) of neurodegeneration screen hits (neurodegeneration genes, orange) and all protein-coding genes in the Genotype-Tissue Expression (GTEx) shows that the expression of neurodegeneration screen hits declines with age in human brain tissues (all protein-coding genes: p=2.91*10−4, neurodegeneration screen hits: p=1.14*10−5). There is a significant difference in the slopes of the trends between age and gene expression for neurodegeneration screen hits and all protein-coding genes (all protein-coding genes: R=0.12, neurodegeneration screen hits: R=0.15, p=7.38*10−6). Regression lines indicate the relationship between age and TPM with a 95% confidence interval (standard error of the mean). The mixed effects regression analysis controlled for post-mortem interval, sex, ethnicity, and tissue of origin. b) Gene set enrichment plot showing that the set of age-associated neurodegeneration genes has reduced expression with respect to age. Vertical lines indicate rank of neurodegeneration screen hits by their association between gene expression and age determined by mixed-effects regression analysis coefficients. c) Proportion of genes that have significant associations between gene expression and age relative to the set of all protein-coding genes (blue) or the set of age-associated neurodegeneration genes (orange). Error bars indicate 95% binomial confidence intervals of the estimated proportion of genes with a significant association with age. Asterisk indicates tissues with an FDR-adjusted one-tailed hypergeometric test p-value less than 0.01. d) Proportion of protein-coding genes (blue) and age-associated neurodegeneration genes (orange) that are differentially expressed between Alzheimer’s disease (AD) and control in excitatory neurons in single-nucleus RNA-seq. Error bars indicate 95% binomial confidence intervals.
Fig. 3:
Fig. 3:
Multi-omic changes in human Alzheimer’s disease patients and model systems. a) Schematic depicting the identification of eGenes from laser-capture microdissection of temporal cortex pyramidal neuron-enriched populations from 75 individuals including 42 human Alzheimer’s disease (AD) and 33 healthy control patients and identification of eGenes. Brain cartoon created with Biorender.com. b) The eQTL associated with the eGene HLA-DRB1 is highlighted in red and overlaps with DNA binding motifs of MEF2B, CUX1 and ATF2 derived from ENCODE ChIP-seq and FIMO-detected motifs. Grey horizontal bars indicate ChIP-seq binding regions and the black horizontal bars indicate where the DNA-binding motif is located. c) Dot plots showing the negative log10 FDR-adjusted p-values for enriched GO terms in proteins that are significantly upregulated or significantly downregulated in both Drosophila models of tau and amyloid β, only differentially abundant in Drosophila models of amyloid β (Amyloid β only), or only differentially abundant in Drosophila models of tau (Tau only). d) Heat maps depict the log2 fold changes between Aβ1–42 transgenic flies (Amyloid β) or tauR406W (Tau) transgenic flies with controls for d) proteins or e) phosphoproteins that were hits in the age-associated neurodegeneration screen. An asterisk indicates whether the comparison was significant at an FDR threshold of 0.1. The columns of all heatmaps were clustered by hierarchical clustering.
Fig. 4:
Fig. 4:
Network integration of Alzheimer’s disease multi-omics and novel genetic screening data identifies subnetworks characterized by hallmarks of neurodegeneration and processes previously not implicated in Alzheimer’s disease. a) Network integration of human and Drosophila multi-omics for Alzheimer’s Disease highlights subnetworks enriched for proteins belonging to known gene ontologies. Each subnetwork is represented by a pie chart, which indicates the proportion of nodes represented by a given data type. Edge width is determined by the number of interactions between nodes within or with another subnetwork and colored by one of the involved subnetworks. Each pie chart is labeled by the enriched biological process by hypergeometric test (FDR-adjusted p-value less than 0.1). b) A subnetwork enriched for postsynaptic activity. Nodes belonging to the annotated process are highlighted in yellow. Also in this subnetwork are metabolites associated with postsynaptic activity such as acetylcholine. c) Phosphorylated tau, APOE, and APP-processing proteins interact with each other and are in a subnetwork enriched for NOTCH signaling-associated genes. Members of the NOTCH signaling pathway are highlighted in yellow.
Fig. 5:
Fig. 5:
Network integration of Alzheimer’s disease multi-omics and novel genetic screening data reveals biological processes associated with tau-mediated neurotoxicity. a) The neurodegeneration modifier HNRNPA2B1 and the eGene MEPCE interact with each other and have protein-protein interactions with modifiers of tau neurotoxicity. The interaction between HNRNPA2B1 and MEPCE is found in the subnetwork in Figure 4 that is enriched for insulin signaling. b) Knockdown of the Drosophila orthologs of HNRNPA2B1 (Hrb98DE) and MEPCE (CG1293) shows enhancement of the rough eye phenotype in flies expressing wild type human tau. c) Quantification of rough eye severity. The scale reflects the extent of morphological disruption after human tau retinal expression (Methods). Statistical significance was measured using a one-way ANOVA with Tukey’s post-hoc correction and is indicated with an asterisk. Error bars are the standard error of the mean. Two independent RNAi constructs were used to knock down each gene. n=8. Control is GMR-GAL4/+. Flies are one day old. d) Volcano plot depicting differential expression analysis by DeSeq2 of bulk RNA-seq after HNRNPA2B1 CRISPRi knockdown in NGN2 neural progenitor cells (Benjamini-Hochberg FDR<0.1, absolute log2 fold change > 1). Each dot represents a single gene. The horizontal dashed line indicates the negative log10 FDR-adjusted p-value significance cut-off of 0.1 and the vertical dashed lines indicate the log2 fold change cut-offs of 1 and −1. Red dots indicate genes that are significantly upregulated and blue dots indicate genes that are significantly downregulated. e) Dot plot of the enriched pathways identified by gene set enrichment analysis of the RNA-seq data. The 10 pathways with the highest negative log10 FDR-adjusted p-value are plotted. The size of the dot indicates the proportion of genes that are part of the enriched pathway. The color of the dot represents the normalized enrichment score (NES), where blue indicates downregulation and red indicates upregulation. The x-position of the dot indicates the negative log10 FDR-adjusted p-value and the y-position is the corresponding, enriched pathway.
Fig. 6:
Fig. 6:
Network analysis implicates neurodegeneration genes as regulators of the AD-associated biological process of DNA damage repair. a) NOTCH1 and CSNK2A1 interact with a diversity of AD-specific omics that are involved in DNA damage repair processes. Nodes involved in DNA damage are highlighted in yellow. b) Knockdown of Drosophila orthologs for NOTCH1 and CSNK2A1 lead to increased DNA damage in neurons of the adult fly brain as measured by increased numbers of foci positive for the DNA double-strand break marker pH2Av (red, arrowheads). pH2Av is the Drosophila ortholog of mammalian pH2AX. Neurons are identified by elav immunostaining (green). Nuclei are identified with DAPI immunostaining (blue). The scale bar represents 5 μm. c) Percent of nuclei containing pH2Av foci in control flies, Drosophila knockdowns of orthologs of CSNK2A1 (CKIIa and CKIIb) and NOTCH1 (N). Asterisks indicate significance of a one-way binomial test after Benjamini-Hochberg FDR correction p<0.01. Error bars are 95% binomial confidence intervals. n=6. Controls are elav-GAL4/+; UAS-Dcr-2/+ (CKII knockdown) or elav-GAL4/+ (N knockdown). Flies are 10 days old. d) Inhibition of Casein Kinase 2 (CK2) by CX-4945, and the inhibition of NOTCH cleavage by Compound E enhances DNA damage in human iPSC-derived neural progenitor cells measured by the COMET assay. e) Quantification of the tail moments from panel A in arbitrary units. Asterisks indicate p<0.01 by ANOVA with Tukey’s Post-Hoc correction. Error bars indicate standard error of the mean. f) Dot plots showing the normalized enrichment scores (NES) of selected, significantly enriched REACTOME pathways after CSNK2A1 and NOTCH1 knockdown in NGN2 neural progenitor cells. Red and blue dots indicate positive and negative NES, respectively, reflecting upregulation or downregulation of pathways. Pathways were selected to show shared changes in pathways related to cell cycle, DNA repair and postsynaptic activity. g) Representative immunofluorescence images of mature neurons in Drosophila brains show inappropriate cell cycle re-entry in postmitotic neurons as indicated by PCNA expression (red, arrow) following CKIIa knockdown. The neuronal marker elav identifies neurons (shown in green). PCNA, elav (neurons) and DAPI are represented in red, green, and blue respectively. h) Quantification of PCNA expression in control brains and brains of Drosophila with knockdown of orthologs of CSNK2A1 (CKIIa and CKIIb). Asterisks indicate p<0.01 by ANOVA with Tukey’s Post-Hoc correction. n=6. Control is elav-GAL4/+; UAS-Dcr-2/+. Flies are 10 days old.

References

    1. Wilson R. S. et al. The natural history of cognitive decline in Alzheimer’s disease. Psychol. Aging 27, 1008–1017 (2012). - PMC - PubMed
    1. Goedert M. & Spillantini M. G. A Century of Alzheimer’s Disease. Science 314, 777–780 (2006). - PubMed
    1. Lee V. M.-Y., Goedert M. & Trojanowski J. Q. Neurodegenerative Tauopathies. Annu. Rev. Neurosci 24, 1121–1159 (2001). - PubMed
    1. Selkoe D. J. & Hardy J. The amyloid hypothesis of Alzheimer’s disease at 25 years. EMBO Mol Med 8, 595–608 (2016). - PMC - PubMed
    1. Hutton M. et al. Association of missense and 5Q-splice-site mutations in tau with the inherited dementia FTDP-17. Nature 393, 702–705 (1998). - PubMed

Publication types

Grants and funding