[Preprint]. 2024 Mar 13:2024.03.12.584469.
doi: 10.1101/2024.03.12.584469.

Functional genetics reveals modulators of anti-microtubule drug sensitivity

Affiliations

Functional genetics reveals modulators of anti-microtubule drug sensitivity

Kuan-Chung Su et al. bioRxiv. .

Update in

Abstract

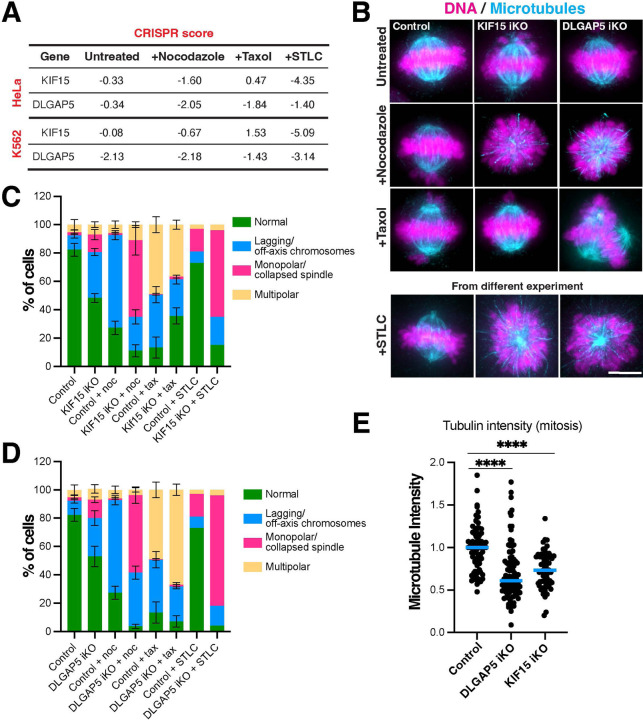
Microtubules play essential roles in diverse cellular processes and are important pharmacological targets for treating human disease. Here, we sought to identify cellular factors that modulate the sensitivity of cells to anti-microtubule drugs. We conducted a genome-wide CRISPR/Cas9-based functional genetics screen in human cells treated with the microtubule-destabilizing drug nocodazole or the microtubule-stabilizing drug taxol. We further conducted a focused secondary screen to test drug sensitivity for ~1400 gene targets across two distinct human cell lines and to additionally test sensitivity to the Kif11-inhibitor, STLC. These screens defined gene targets whose loss enhances or suppresses sensitivity to anti-microtubule drugs. In addition to gene targets whose loss sensitized cells to multiple compounds, we observed cases of differential sensitivity to specific compounds and differing requirements between cell lines. Our downstream molecular analysis further revealed additional roles for established microtubule-associated proteins and identified new players in microtubule function.

Keywords: Microtubule; dynamic instability; mitosis; nocodazole; taxol.


Figures

Figure 1:
Figure 1:. Large-scale functional genetics screens reveal modulators of anti-microtubule drug sensitivity.
(A) Schematic showing the workflow for the pooled CRISPR screen. (B) Schematic showing the effects of microtubule drugs (nocodazole and taxol) on microtubule dynamics.(C) Curve illustrating the CRISPR score of fitness conferring and growth enhancer genes upon treatment with either nocodazole or taxol. (D) Scatter plot showing the CRISPR scores in untreated versus nocodazole treated cell pools. (E) Scatter plot showing the CRISPR scores in untreated versus taxol treated cell pools. (F) Table showing the CRISPR scores of selected inducible knockouts (iKO) in high concentration of nocodazole or taxol. (G) Expected versus observed fractions of hits on between the end of chromosome 1 and KIF2C, or between KIF2C and the centromere. Expected fractions were calculated by assuming an even distribution of hits across the chromosome 1 length. (H) Scatter plot illustrating the differential CRISPR scores across all gene targets in the secondary screen. The differential was calculated between nocodazole and untreated and taxol and untreated HeLa cell pools. (I) Scatter plot illustrating the differential CRISPR scores across all gene targets in the secondary screen. The differential was calculated between nocodazole and untreated and taxol and untreated K562 cell pools.
Figure 2:
Figure 2:. Analysis of KIF15 and DLGAP5 inducible knock-outs
(A) Table showing the secondary screen CRISPR score of KIF15 and DLGAP5 inducible knockouts (iKOs) in HeLa and K562 cells. (B) Representative Z-projected widefield immunofluorescence images of mitotic metaphase cells from KIF15 and DLGAP5 iKO HeLa cell lines treated with either nocodazole, taxol or STLC. Microtubules (DM1α), DNA (DAPI). Scale bar: 9 μm. (C) Percent of mitotic cells with chromosome misalignment defects after iKO of KIF15 for 4 d, treated with either nocodazole, taxol or STLC, quantified from B. n = approximately 300 cells per condition, across three experimental replicates. (D) Percent of mitotic cells with chromosome misalignment defects after iKO of DLGAP5 for 4 d, treated with either nocodazole, taxol or STLC, quantified from B. n = approximately 300 cells per condition, across three experimental replicates. (E) Quantification of total spindle tubulin immunofluorescence in KIF15 iKO and DLGAP5 iKO HeLa cells. n = 71, 60, 96 across three experimental replicates. Statistical tests performed: Welch’s t test (**** = < 0.0001).
Figure 3:
Figure 3:. Analysis of : HMMR and SAMHD1 inducible knock-outs
(A) Table showing the secondary screen CRISPR score of HMMR and SAMHD1 inducible knockouts (iKOs) in HeLa and K562 cells. (B) Representative Z-projected widefield immunofluorescence images of mitotic metaphase cells from HMMR and SAMHD1 iKO HeLa cell lines treated with either nocodazole, taxol or STLC. Microtubules (DM1α), DNA (DAPI). Scale bar: 9 μm. (C) Percent of mitotic cells with chromosome misalignment defects after iKO of HMMR for 4 d, treated with either nocodazole, taxol or STLC, quantified from B. n = approximately 300 cells per condition, across three experimental replicates. (D) Percent of mitotic cells with chromosome misalignment defects after iKO of SAMHD1 for 4 d, treated with either nocodazole, taxol or STLC, quantified from B. n = approximately 300 cells per condition, across three experimental replicates. (E) Quantification of total spindle tubulin immunofluorescence in the HMMR and SAMHD1 iKO HeLa cells. n = 61, 69, 62 across three experimental replicates. Statistical tests performed: Welch’s t test (**** = < 0.0001).
Figure 4:
Figure 4:. Analysis of HN1 and HN1L double knock-out cells
(A) Table showing the primary and secondary screen CRISPR score of HN1 and HN1L inducible knockouts (iKOs) in K562 cells. (B) Representative confocal immunofluorescence images of mitotic metaphase and interphase HeLa cells showing the localization of GFP-tagged HN1 and HN1L proteins. (C) Percent of mitotic cells with chromosome misalignment defects after iKO of HN1 and HN1L for 4 d, treated with either nocodazole, taxol or STLC, quantified from D. n = approximately 300 cells per condition, across three experimental replicates. (D) Representative Z-projected widefield immunofluorescence images of mitotic metaphase cells from HN1/HN1L double iKO HeLa cell line treated with either nocodazole, taxol or STLC. Microtubules (DM1α), DNA (DAPI). Scale bar: 9 μm. (E) Quantification of total spindle tubulin immunofluorescence in the HN1 and HN1L iKO HeLa cells. n = 60, 62 across three experimental replicates. (F) Quantification of total spindle EB1 immunofluorescence in the HN1 and HN1L iKO HeLa cells. n = 94, 105 across three experimental replicates. (H) Live confocal immunofluorescence images of td-Tomato EB3 tagged HN1 and HN1L iKO HeLa cells. (G) EB3 speed quantification in HN1 and HN1L iKO HeLa cells. n = 108, 103 kymographs, n = 40, 42 cells across three experimental replicates. Statistical tests performed: Welch’s t test (**** = < 0.0001).
Figure 5:
Figure 5:. Analysis of CARNMT1 knock-out cells
(A) Table showing the secondary screen CRISPR score of CARNMT1 iKO in HeLa and K562 cells. (B) Representative confocal immunofluorescence images of mitotic metaphase and interphase HeLa cells showing the localization of GFP-tagged CARNMT1. (C) Representative Z-projected widefield immunofluorescence images of mitotic metaphase cells from CARNMT1 iKO K562 cell line treated with either nocodazole, taxol or STLC. Microtubules (DM1α), DNA (DAPI). Scale bar: 9 μm. (D) Percent of mitotic cells with chromosome misalignment defects after iKO of CARNMT1 for 4 d, treated with either nocodazole, taxol or STLC, quantified from C. n = approximately 300 cells per condition, across three experimental replicates. (E) Quantification of total spindle tubulin immunofluorescence in the CARNMT1 iKO K562 cells. n = 58, 64 across three experimental replicates. (F) Quantification of total spindle tubulin immunofluorescence in the CARNMT1 iKO K562 cells treated with nocodazole. n = 62, 63 across three experimental replicates. (G) Quantification of total spindle tubulin immunofluorescence in the CARNMT1 iKO K562 cells treated with taxol. n = 62, 61 across three experimental replicates. Statistical tests performed: Welch’s t test (**** = < 0.0001).

References

    1. Adelmann C.H., Wang T., Sabatini D.M., and Lander E.S.. 2019. Genome-Wide CRISPR/Cas9 Screening for Identification of Cancer Genes in Cell Lines. Methods Mol Biol. 1907:125–136. - PubMed
    1. Akhmanova A., and Steinmetz M.O.. 2008. Tracking the ends: a dynamic protein network controls the fate of microtubule tips. Nat Rev Mol Cell Biol. 9:309–322. - PubMed
    1. Akhmanova A., and Steinmetz M.O.. 2015. Control of microtubule organization and dynamics: two ends in the limelight. Nat Rev Mol Cell Biol. 16:711–726. - PubMed
    1. Arnal I., and Wade R.H.. 1995. How does taxol stabilize microtubules? Curr Biol. 5:900–908. - PubMed
    1. Ashoti A., Limone F., van Kranenburg M., Alemany A., Baak M., Vivie J., Piccioni F., Dijkers P.F., Creyghton M., Eggan K., and Geijsen N.. 2022. Considerations and practical implications of performing a phenotypic CRISPR/Cas survival screen. PLoS One. 17:e0263262. - PMC - PubMed

Publication types