[Preprint]. 2024 May 25:2024.03.17.585422.
doi: 10.1101/2024.03.17.585422.

Molecular Mechanisms of Genotype-Dependent Lifespan Variation Mediated by Caloric Restriction: Insight from Wild Yeast Isolates

Affiliations

Molecular Mechanisms of Genotype-Dependent Lifespan Variation Mediated by Caloric Restriction: Insight from Wild Yeast Isolates

Samantha McLean et al. bioRxiv. .

Update in

Abstract

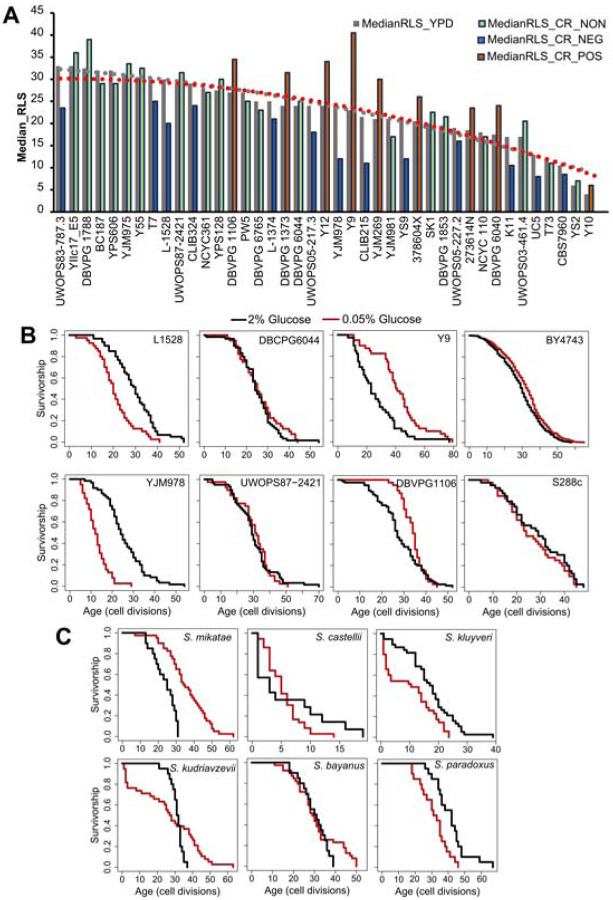
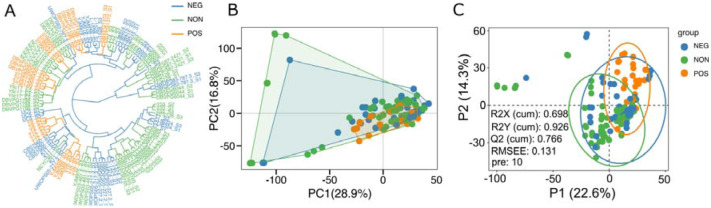
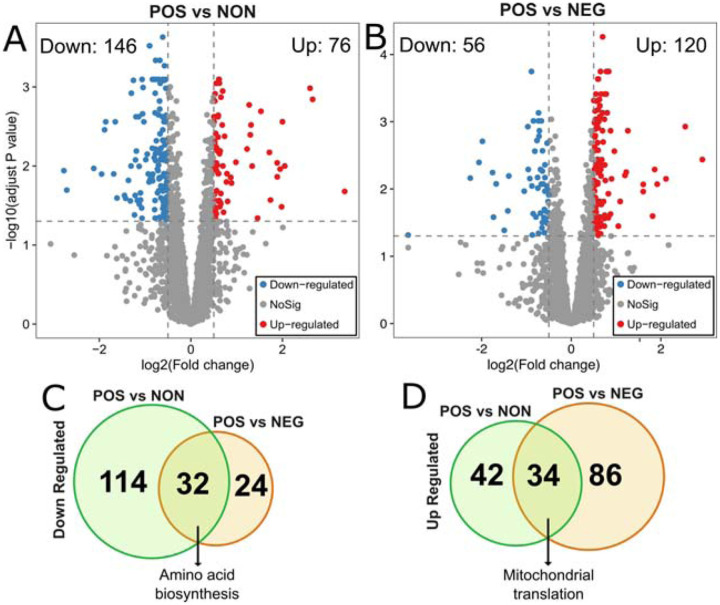
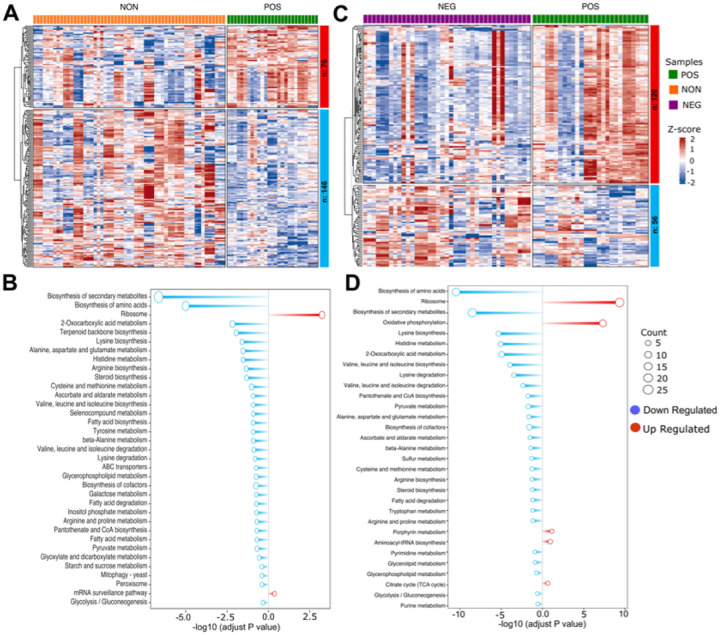
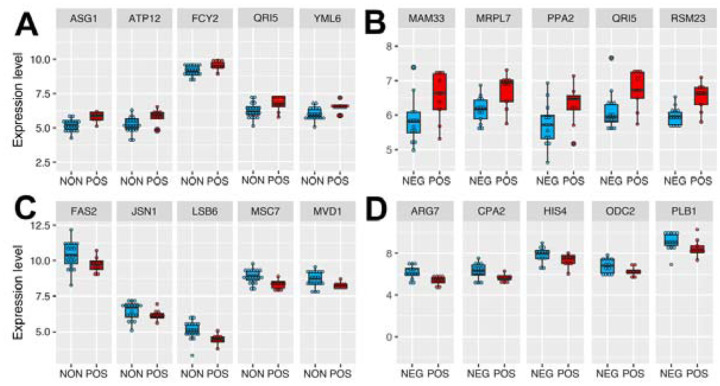
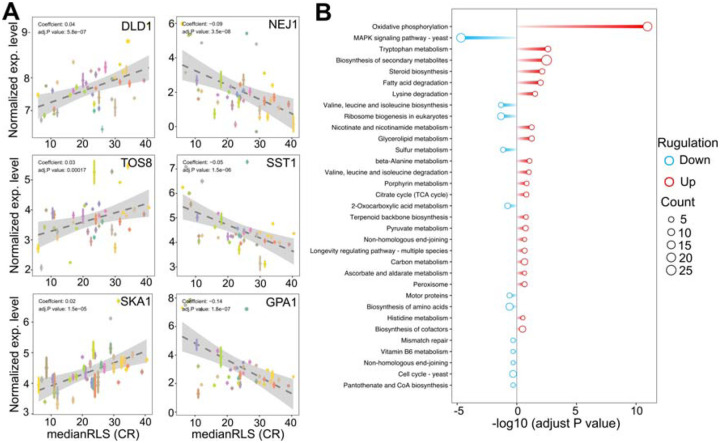
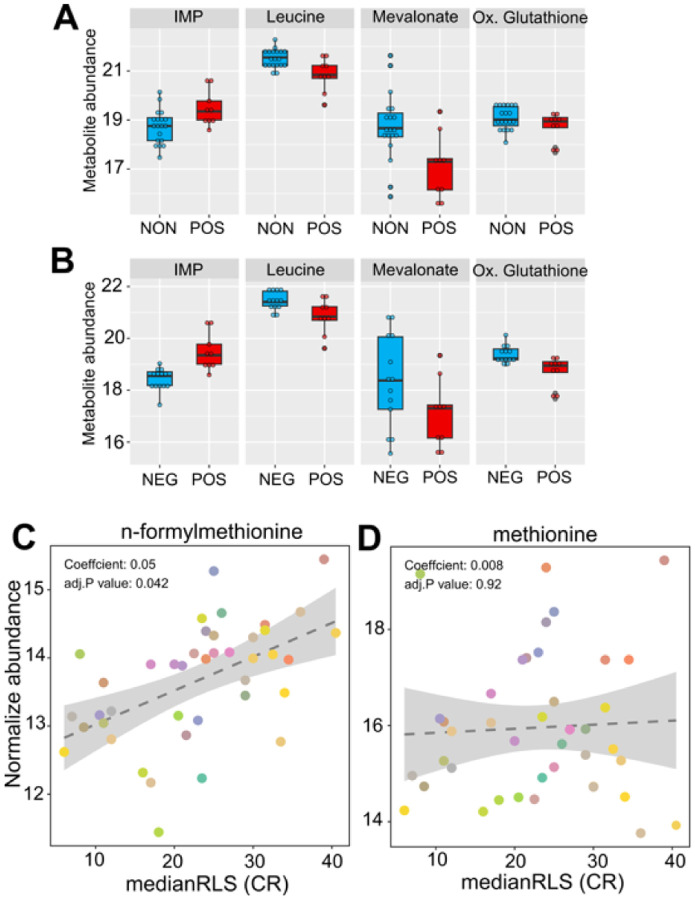
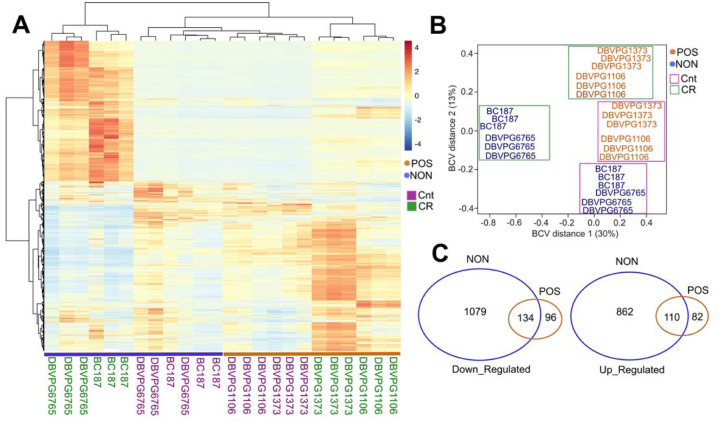
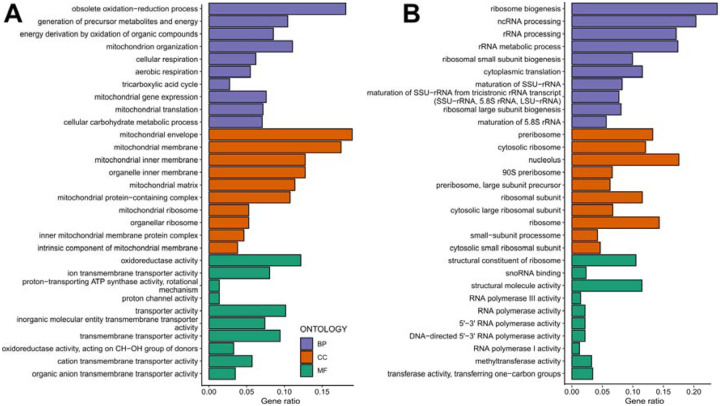
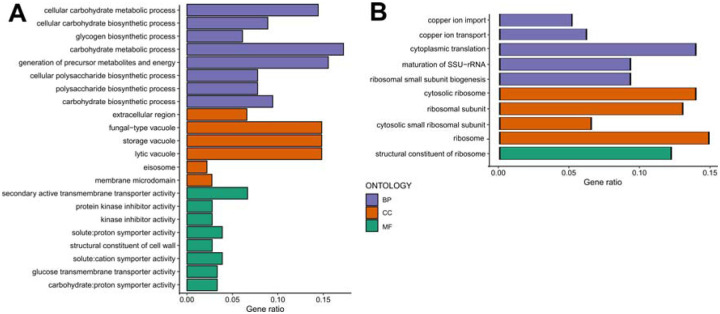
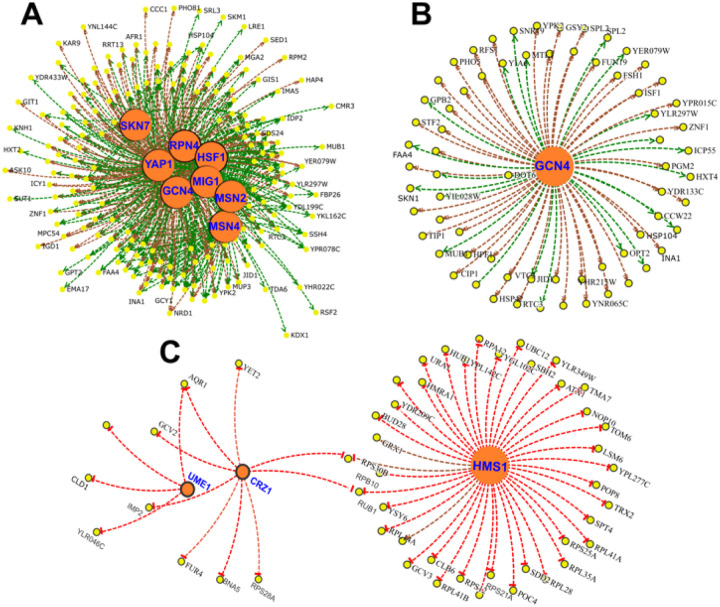
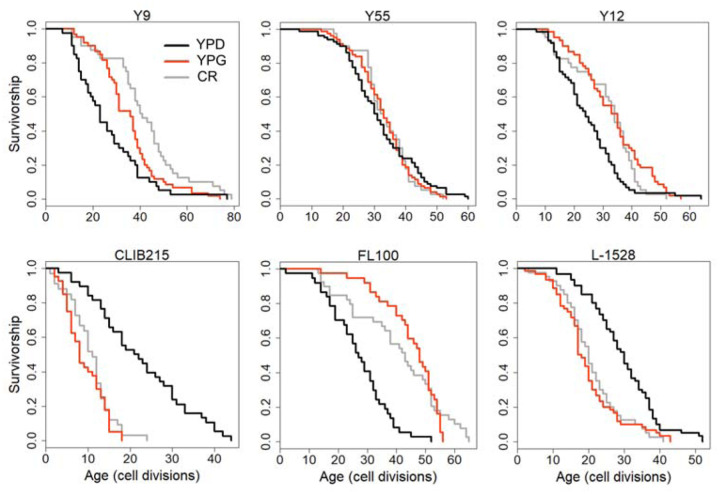
Caloric restriction (CR) is known to extend lifespan across different species and holds great promise for preventing human age-onset pathologies. However, two major challenges exist. First, despite extensive research, the mechanisms of lifespan extension in response to CR remain elusive. Second, genetic differences causing variations in response to CR and genetic factors contributing to variability of CR response on lifespan are largely unknown. Here, we took advantage of natural genetic variation across 46 diploid wild yeast isolates of Saccharomyces species and the lifespan variation under CR conditions to uncover the molecular factors associated with CR response types. We identified genes and metabolic pathways differentially regulated in CR-responsive versus non-responsive strains. Our analysis revealed that altered mitochondrial function and activation of GCN4-mediated environmental stress response are inevitably linked to lifespan variation in response to CR and a unique mitochondrial metabolite might be utilized as a predictive marker for CR response rate. In sum, our data suggests that the effects of CR on longevity may not be universal, even among the closely related species or strains of a single species. Since mitochondrial-mediated signaling pathways are evolutionarily conserved, the dissection of related genetic pathways will be relevant to understanding the mechanism by which CR elicits its longevity effect.

Keywords: Caloric restriction; genotype variation; lifespan; metabolism; yeast.


Conflict of interest statement

Conflict of interest The authors declare that the research was conducted in the absence of any commercial or financial relationships that could be construed as a potential conflict of interest.

Figures

Figure. 1:
Figure. 1:. Intra- and interspecies distribution of median RLS distribution.
(A) Cells were grown in yeast peptone dextrose (YPD). Dashed lines represent the average median RLS of YPD (2% glucose gray) and YPD-CR (0.05% glucose). The bar graph depicts the media RLS of each strain analyzed under YPD (gray) and YPD-CR. Bar colors indicate CR response types based on the statistical significance of median RLS changes under CR conditions compared to the YPD. Blue is for negatively responding strains (NEG), green is for non-responding strains (NON), and orange bars represent positively responding strains (POS). (B) Examples of lifespan curves for the selected strains of S. cerevisiae. (C) Lifespan curves for six Saccharomyces species. The black curve shows the lifespan under YPD conditions, and the red curve shows the lifespan under YPD CR conditions. The raw data and statistical significance can be found in Supplementary File 1.
Figure 2:
Figure 2:. Sample clusters.
(A) Dendrogram plot of sample cluster. Clustering is generated by hierarchical clustering using the Ward D2 method. The color represents three groups, as shown in Figure 1; Orange represents the positively responding (POS) group. Green represents the non-responding (NON) group. Blue represents the negatively responding (NEG) group. (B) Principal component analysis of gene expression across three groups. The first two principal components (PCs) and their variance explanation percentages are shown. Each repetition is treated as a point. (C) Partial least squares discriminant analysis (PLS-DA) based on the gene expression data across wild isolates of three phenotypic groups is shown. The scatter plot of the first two partial least squares (PLS) components and their variance explanation percentages are shown. The model parameters are also shown in the figure, including the explanatory degree of the model to independent variables (R2X), the explanatory degree of the model to dependent variables (R2Y), the predictive ability of the model (Q2Y), the root mean square error (RMSEE) and the number of PLS components used when calculating these parameters (pre). Each sample is treated as a point. Each phenotypic group is represented by different colors.
Figure 3:
Figure 3:. Differentially expressed genes in POS group compared to the NON and NEG groups.
The volcano plots depicting differentially expressed genes (DEGs) resulted in positively responding (POS) versus (A) non-responding (NON) groups and (B) negativelu-responding (NEG) groups. Red dots represent genes expressed at higher levels, while blue dots represent genes with lower expression levels in the POS group for each comparison. Gray dots represent genes that do not show significant differential expression between both groups. The gray line represents the cutoff of significant differential expression (adjust P value < 0.05 and log2 (Fold change) >0.5). The Y-axis denotes −log10 (adjusted P value) while the X-axis shows log2 (Fold change). Venn diagram shows the number of unique and common DEGs from each comparison (C) for down-regulated and (D) for up-regulated DEGs. The complete list of DEGs with p values can be found in Supplementary File 2.
Figure 4:
Figure 4:. Gene enrichment analysis of different expressed genes.
(A) Heatmap depicting differentially expressed genes (DEGs) in positively responding (POS) versus non-responding (NON) groups. Each column represents an individual strain, and each row represents a single gene expression change between the POS and NON groups. The color intensity indicates the level of gene expression, and the expression value is scaled (Z-score). Red indicates higher expression, and blue indicates lower expression. (B) Bar plot depicting gene enrichment analysis of DEGs. The Y-axis shows each significantly enriched KEGG pathway while the X-axis denotes −log10 (adjusted P value). Red bars represent pathways expressed at higher levels in the POS group, while blue bars represent pathways with higher expression levels enriched in the NON group. Point size represents the number of genes in this pathway. (C and D) Similar analyses were also done for POS and NEG groups. The complete list of DEGs with p values can be found in Supplementary File 2.
Figure 5:
Figure 5:. Top differentially expressed genes in responding strains from each comparison.
The box plot depicts the top genes significantly up-regulated in the positively responding (POS) group compared to the (A) non-responding (NON) and (B) negatively responding (NEG) groups. (C and D) The lower panels contain examples of significantly down-regulated genes in the POS group resulting from each comparison. The Y-axis denotes gene expression level, and the X-axis shows two groups. Expression values across samples can be found in Supplementary File 2.
Figure 6:
Figure 6:. Selected genes whose expression under high glucose condition correlates with median replicative lifespan (RLS) under CR condition.
(A) DLD1, TOS8, and SKA1 gene expression levels, determined under high glucose condition correlate positively, and NEJ1, SST1, and GPA1 correlate negatively with median RLS under CR conditions. The Y-axis denotes the expression level, and the X-axis represents the lifespan. Each color point represents an individual strain. Error bars represent standard error (SE). The gray area represents a 95% confidence interval. The regression coefficient and adjusted P values are included in the figure. The complete list of significantly correlating genes, regression slopes, and p values can be found in. Supplementary File 2. (B) Bar plot depicting gene enrichment analysis of lifespan-correlated genes. The Y-axis shows each significantly enriched pathway of the KEGG database while the X-axis denotes −log10 (adjusted P value). Red bars represent pathways expressed at higher levels in higher lifespan strains, while blue bars represent pathways with higher expression levels in lower lifespan strains. Point size represents the number of genes in this pathway. The complete list of genes with regression slopes, and p values can be found in Supplementary File 2.
Figure 7:
Figure 7:. High glucose metabolite abundance patterns are associated with median RLS under CR condition.
The box plot depicts the top metabolites significantly altered in the positively responding (POS) group, compared to the (A) non-responding (NON) and (B) negatively responding (NEG) groups. (C) Positive significant correlation of n-formylmethionine and (D) non-significant correlation of methionine with median RLS. The Y-axis denotes the abundance level of each metabolite identified under high glucose condition, and the X-axis represents the median RLS, determined under CR condition. Each color point represents an individual strain. The gray area represents a 95% confidence interval. The complete list of metabolites with normalized abundance or regression slopes, and p values can be found in Supplementary File 2.
Figure 8:
Figure 8:. CR mediates phenotype specific transcriptional changes in responding and non-responding strains.
(A) Heat map shows the differentially expressed genes (DEGs) and clusters for selected responsive (POS; orange) and non-responsive (NON; blue) strains under CR conditions in comparison to the matching control groups. (B) Calculation of distances between strains based on the biological coefficient of variation (BCV) of CR-mediated gene expression revealed two separate clusters for responding and non-responding strains. (C) Number of common and unique DEGs for each group. The left diagram shows down- and the right diagram shows up-regulated DEGs. The raw and normalized reads as well as DEGs with log2-fold change values along with statistical significance can be found in Supplementary File 3.
Figure 9:
Figure 9:. Gene ontology enrichment analyses mediated by CR in non-responding strains.
Gene ontology enrichment analyses for the response type-specific (A) up-regulated DEGs and (B) down-regulated DEGs for the non-responding strains. GO categories include Biological Process (BP-Purple), Cellular Component (CC-Orange), and Molecular Function (MF-Green). The raw values of enrichment analyses, statistical significance, and genes associated with each term can be found in Supplementary File 2.
Figure 10:
Figure 10:. Gene ontology enrichment analyses mediated by CR in responding strains.
Gene ontology enrichment analyses for the response type-specific (A) up-regulated DEGs and (B) down-regulated DEGs for the non-responding strains. GO categories include Biological Process (BP-Purple), Cellular Component (CC-Orange), and Molecular Function (MF-Green). The raw values of enrichment analyses, statistical significance, and genes associated with each term can be found in Supplementary File 2.
Figure 11.
Figure 11.. Gene regulatory network of DEGs altered under CR condition in responsive strains.
Transcription Factors (TFs) (A) associated with up-regulated DEGs and (B) subnetwork of GCN4 targets. (C) TF network for down regulated genes. Yellow nodes indicate gene targets that are altered in responsive strain under CR condition. Orange nodes indicate corresponding TFs. Green lines indicate gene activation and red lines represent transcriptional repression.
Figure 12:
Figure 12:. Examples of lifespan curves for the selected strains of S. cerevisiae analyzed under different metabolic conditions.
RLS assays were conducted under control YPD (2% glucose, black lines), YPD-CR (0.05% glucose, gray lines), and YPG (3% glycerol, red lines) medium conditions. The raw data and statistical significance can be found in Supplementary File 1.
Figure 13:
Figure 13:. RLS effect of mitochondrial DNA (mtDNA) elimination and GCN4 overexpression in selected responding strains.
RLS phenotypes of Y12 (left panels) and FL100 (right panels) strains (A) rho0 isolates under high glucose condition (gray lines) and CR condition (purple lines) along with the RLS phenotypes of control parental strains under high glucose (YPD: black lines) and CR conditions (red lines) are also shown (B) Lifespan curves for control (black) and GCN4 (green) overexpression. Lifespan data and the significance of lifespan changes can be found in Supplementary File 1.

Similar articles

References

    1. Anderson R. M. & Weindruch R. The caloric restriction paradigm: Implications for healthy human aging. American Journal of Human Biology 24, 101–106 (2012). - PMC - PubMed
    1. López-Lluch G. & Navas P. Calorie restriction as an intervention in ageing. Journal of Physiology 594, 2043–2060 (2016). - PMC - PubMed
    1. Hoshino S., Kobayashi M. & Higami Y. Mechanisms of the anti-aging and prolongevity effects of caloric restriction: evidence from studies of genetically modified animals. Aging 10, 2243–2251 (2018). - PMC - PubMed
    1. Sinclair D. A. Toward a unified theory of caloric restriction and longevity regulation. Mech Ageing Dev 126, 987–1002 (2005). - PubMed
    1. Ungvari Z., Parrado-Fernandez C., Csiszar A. & De Cabo R. Mechanisms underlying caloric restriction and lifespan regulation: Implications for vascular aging. Circulation Research vol. 102, 519–529 (2008). - PMC - PubMed

Publication types