[Preprint]. 2024 Dec 7:2024.03.15.585237.
doi: 10.1101/2024.03.15.585237.

A feedback-driven brain organoid platform enables automated maintenance and high-resolution neural activity monitoring

Affiliations

A feedback-driven brain organoid platform enables automated maintenance and high-resolution neural activity monitoring

Kateryna Voitiuk et al. bioRxiv. .

Abstract

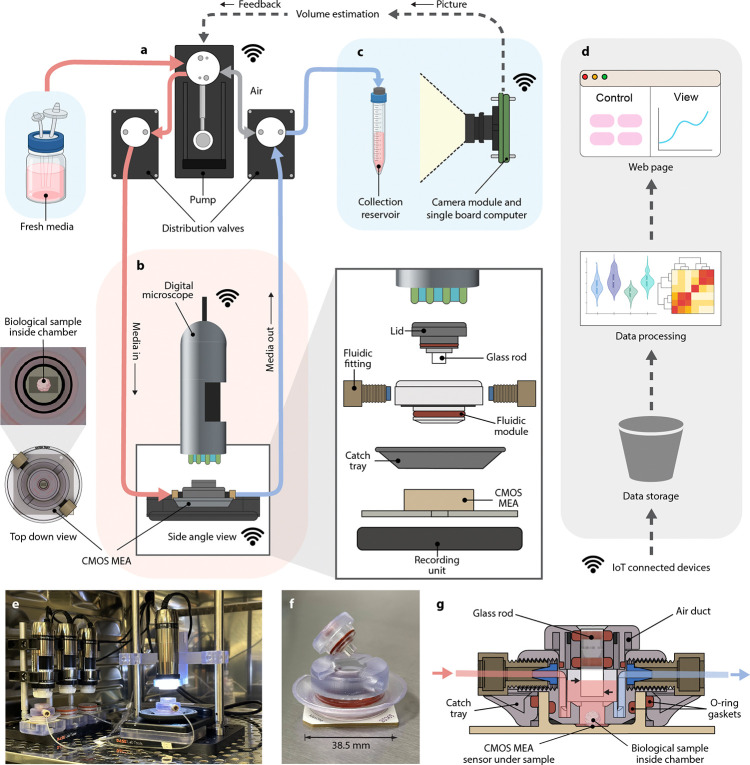
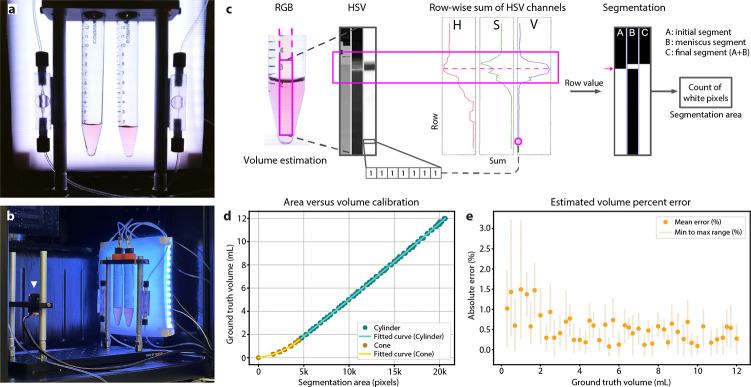
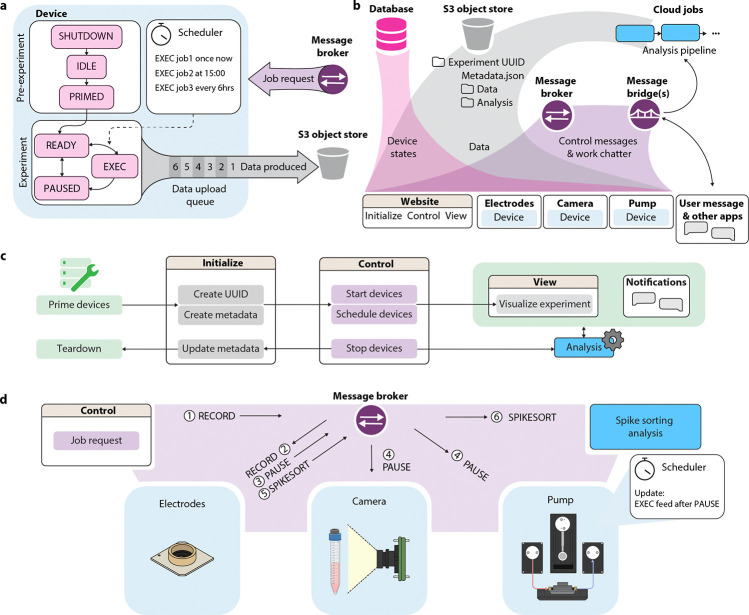
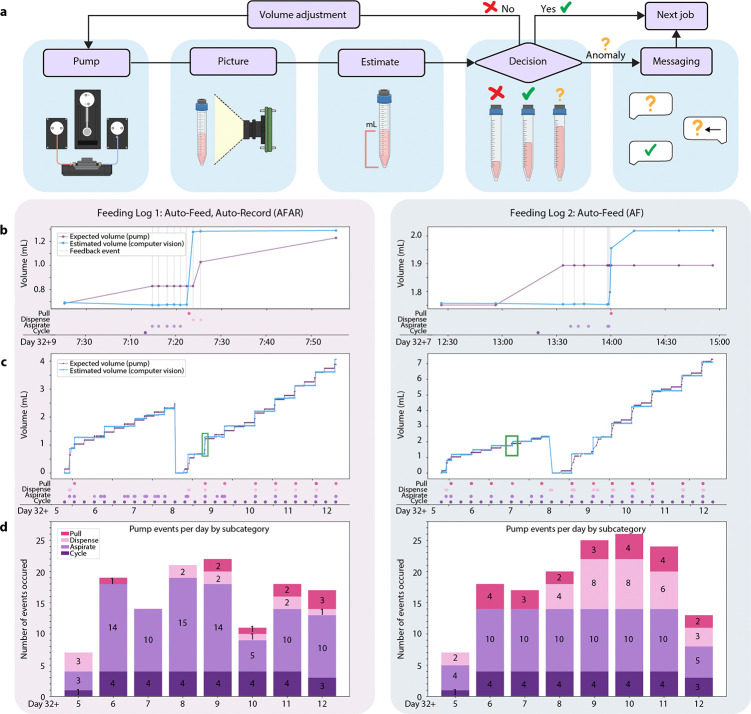
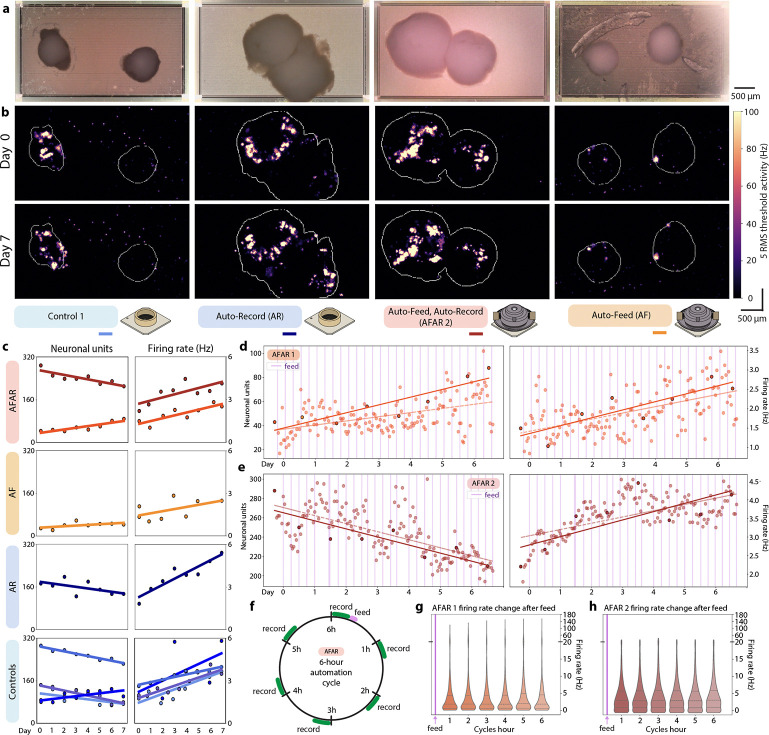
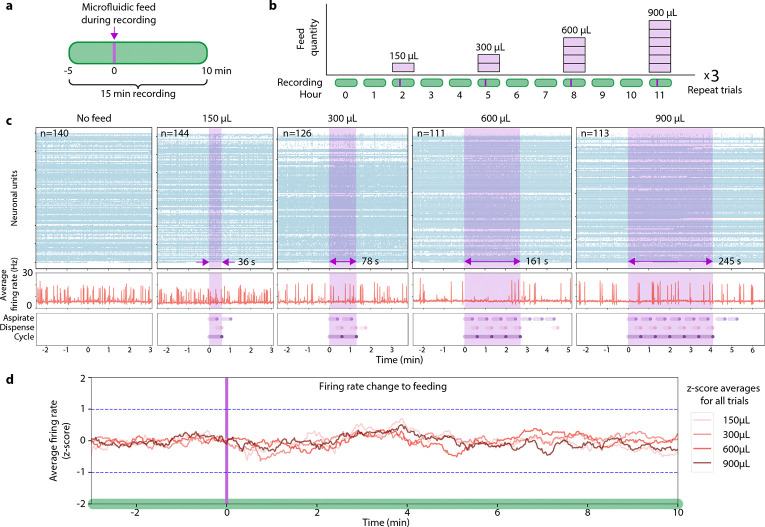
The analysis of tissue cultures, particularly brain organoids, requires a sophisticated integration and coordination of multiple technologies for monitoring and measuring. We have developed an automated research platform enabling independent devices to achieve collaborative objectives for feedback-driven cell culture studies. Our approach enables continuous, communicative, non-invasive interactions within an Internet of Things (IoT) architecture among various sensing and actuation devices, achieving precisely timed control of in vitro biological experiments. The framework integrates microfluidics, electrophysiology, and imaging devices to maintain cerebral cortex organoids while measuring their neuronal activity. The organoids are cultured in custom, 3D-printed chambers affixed to commercial microelectrode arrays. Periodic feeding is achieved using programmable microfluidic pumps. We developed a computer vision fluid volume estimator used as feedback to rectify deviations in microfluidic perfusion during media feeding/aspiration cycles. We validated the system with a set of 7-day studies of mouse cerebral cortex organoids, comparing manual and automated protocols. The automated protocols were validated in maintaining robust neural activity throughout the experiment. The automated system enabled hourly electrophysiology recordings for the 7-day studies. Median neural unit firing rates increased for every sample and dynamic patterns of organoid firing rates were revealed by high-frequency recordings. Surprisingly, feeding did not affect firing rate. Furthermore, performing media exchange during a recording showed no acute effects on firing rate, enabling the use of this automated platform for reagent screening studies.

Keywords: Brain Organoid; Electrophysiology; Internet of Things; Microfluidics; Neural Development; Stem Cells.


Conflict of interest statement

Competing interests K.V. and S.T.S. are co-founders and D.H., S.R.S, M.T. are advisory board members of Open Culture Science, Inc., a company that may be affected by the research reported in the enclosed paper. All other authors declare no competing interests.

Figures

Fig. 1
Fig. 1. Schematic diagram of the integrated feedback platform.
(a) A syringe pump and valve system dispense fresh media and aspirate conditioned media at user-defined intervals. The blue background represents 4°C refrigeration. (b) Microscopy and HD-MEA electrophysiology record morphology and functional dynamics of the biological sample. The red background represents 37°C incubation. Exploded view: the microfluidic culture chamber for media exchange couples with the HD-MEA. (c) A camera captures images of the aspirated conditioned media drawn from each culture and relays them through cloud-based data processing for volume estimation feedback to the syringe pump system. (d) Devices communicate over MQTT (Message Queuing Telemetry Transport) protocol and automatically upload data to the cloud, where it is stored, processed, and presented on a web page. (e) The experimental setup in the incubator shows two microfluidic culture chambers and two conventional membrane lids. (f-g) 3D printed microfluidic culture chamber and cross-section diagram. The media level, noted by the upper black arrow (559μL) and lower black arrow (354μL) on the glass rod, is the ideal operating range that keeps the rod immersed in media. The biological sample is adhered to the HD-MEA sensor at the bottom.
Fig. 2
Fig. 2. Computer vision for volume estimation.
(a) Example of a raw image captured by the camera module. (b) In-refrigerator volume estimation setup in Figure 1c. The CMOS camera module (the white triangle) images the conical tubes with a diffused LED backlight for even illumination. (c) Fluid segmentation: a rectangular pixel patch down the center of the conical tube; Row-wise summations of the HSV channels are used to detect the location of the meniscus. The initial liquid potion segmentation is added to the meniscus portion to yield the final segmentation. (d) Calibration graph with a fitted relationship of segmented pixel count to ground truth volume. (e) The absolute error percentage: orange dots represent the average error at selected volumes. The shaded bar represents the minimum to maximum error range.
Fig. 3
Fig. 3. Cloud-based device interactions.
(a) The device-class is a generalized state machine framework of all IoT devices. The device participates in experiments by taking in job requests (from experimenters or other devices), scheduling and executing the jobs, and producing data files that are queued and uploaded to cloud storage. (b) IoT infrastructure. Device states (pink) are saved in a database and displayed on the website user interface. Device-generated data (gray) is saved and organized in cloud storage, where it can be accessed by user interface or analysis cloud jobs. Devices send communications (purple) through a message broker and use message bridges to translate messages to analysis pipelines or text messaging applications. (c) User workflow. Devices are physically primed in accordance with experimental procedures such as sterilization. On the ‘Initialize’ webpage, an experiment is created with a unique ID (UUID) and descriptive notes (metadata). On the ‘Control’ webpage, devices are called to start working on the experiment and are given a job schedule. The ‘View’ webpage and notifications allow the user to monitor the ongoing experiment. (d) Example of inter-device communication: (1) A RECORD job request is made from the ‘Control’ panel. (2) The message broker delivers the record request to the electrophysiology recording unit. (3) The electrophysiology unit pauses all other devices to ensure a quality recording. (4) All devices receive a pause request. The pump reschedules a feed until after the pause. (5) Upon finishing the recording, the electrophysiology unit delivers a spike sorting request to commence data analysis.
Fig. 4
Fig. 4. Volume feedback.
(a) Volume estimation feedback loop. After the pump completes a microfluidic action, it requests a picture of the media collection reservoir from the camera module. The picture is passed to the cloud-based computer vision program to estimate the current volume. The results is compared with the expected volume, and a decision is made: within tolerance (green checkmark), a microfluidic volume adjustment action is needed (red “x”), or an anomaly is detected (yellow question mark). Once the estimated volume is within tolerance (green check mark), the feedback cycle ends and proceeds to the next job. If this cannot be achieved or an anomaly is detected, such as out-of-range volumes, an alert is sent to the user messaging service to request assistance. (b-d) On these graphs, the “Day” x-axis summarizes the timeline: organoids were plated on the HD-MEA on Day 32, automation started 5 days after plating and continued to day 12. Above this axis, dots mark the occurrence of microfluidic events. (b) Graphs of the Expected Volume and Estimated Volume for the automated AFAR 1 (left) and AF (right) during a period of feedback events. Event types are marked with dots below the graph. (c) The complete view of Expected and Estimated volume traces over the 7-day study. (d) Stacked histogram pump events per day organized by type.
Fig. 5
Fig. 5. Electrophysiology analysis of the 7-day cerebral cortex organoid study.
(a) Digital microscope images of example organoid conditions. (b) Boundaries of each organoid were outlined using image segmentation and overlaid with activity scans from the initial recording “Day 0” (top) and last recording “Day 7” (bottom). Experimental conditions are labeled underneath, with a color legend. (c) Total detected neural units (left column) and median firing rates per unit (right column) in daily 10-minute recordings, grouped by experimental condition. (d-e) Detected neural units (left) and median firing rates (right) in hourly resolution for AFAR 1 (d) and AFAR 2 (e) using their automated 10-minute recordings. Feeding events are noted as vertical violet lines. (f) The two AFAR samples had a 6-hour automation cycle that included one 143 μL feed (violet) and six 10-minute recordings (green). (g-h) Violin graph of all unit’s firing rates per recording for AFAR 1 (g) and AFAR 2 (h) organized into bins of the 6-hour automation cycle following each feeding event. The 6-hour feeding regimen did not induce cyclical changes for either sample.
Fig. 6
Fig. 6. Effect of feeding during recording.
(a) 15-minute recordings were collected hourly from a cerebral cortex organoid, with automated microfluidic feeding beginning at minute 5. (b) Feedings occurred every third hour of ascending fixed-volume cycles of 150 μL, 300 μL, 600 μL, and 900 μL, then repeated for three trials (36 hours). (c) Graphs of select recordings showcasing each of the five conditions. Top: spike raster of neuronal units (y axis) firing over time (x axis). Middle: average firing rate per neuronal unit computed by dividing the total spikes in a 100 ms bin by number of neuronal units. Bottom: microfluidic feeding actions performed by the pump. Each feeding “cycle” is composed of one “aspirate” action followed by one “dispense” action. No “pull” actions occurred in the graphs. Pink shading in the Top and Middle graphs represents the summed feeding duration, while the Bottom graph breaks down the specific pump actions performed. Additional actions triggered by feedback are outside the pink feeding window. (d) Firing rate dynamics in response to feeding events across ascending cycle conditions. Neural activity was analyzed using 90-second sliding windows (in 1-second steps) and normalized in two stages: first using contrast normalization (x=(am)/(a+m), where x is the norm, a is the firing rate of a neural unit in each window and m is the mean firing rate across all windows for that unit within its recording) to account for individual unit firing rate differences, followed by z-score normalization at each time window against the no-feed control recordings to account for natural baseline firing variability. Z-scores were averaged across units within each feed volume condition (150 μL to 900 μL) to evaluate the influence of progressively larger feed volumes.

Similar articles

References

    1. Kelley K.W., Paşca S.P.: Human brain organogenesis: Toward a cellular understanding of development and disease. Cell 185(1), 42–61 (2022) 10.1016/j.cell.2021.10.003. Accessed 2024-02-13 - DOI - PubMed
    1. Eiraku M., Watanabe K., Matsuo-Takasaki M., Kawada M., Yonemura S., Matsumura M., Wataya T., Nishiyama A., Muguruma K., Sasai Y.: Self-Organized Formation of Polarized Cortical Tissues from ESCs and Its Active Manipulation by Extrinsic Signals. Cell Stem Cell 3(5), 519–532 (2008) 10.1016/j.stem.2008.09.002. Publisher: Elsevier. Accessed 2020-04-14 - DOI - PubMed
    1. Lancaster M.A., Renner M., Martin C.-A., Wenzel D., Bicknell L.S., Hurles M.E., Homfray T., Penninger J.M., Jackson A.P., Knoblich J.A.: Cerebral organoids model human brain development and microcephaly. Nature 501(7467), 373–379 (2013) 10.1038/nature12517. Number: 7467 Publisher: Nature Publishing Group. Accessed 2021-02-04 - DOI - PMC - PubMed
    1. Pollen A.A., Bhaduri A., Andrews M.G., Nowakowski T.J., Meyerson O.S., Mostajo-Radji M.A., Lullo E.D., Alvarado B., Bedolli M., Dougherty M.L., Fiddes I.T., Kronenberg Z.N., Shuga J., Leyrat A.A., West J.A., Bershteyn M., Lowe C.B., Pavlovic B.J., Salama S.R., Haussler D., Eichler E.E., Kriegstein A.R.: Establishing Cerebral Organoids as Models of Human-Specific Brain Evolution. Cell 176(4), 743–75617 (2019) 10.1016/j.cell.2019.01.017. Publisher: Elsevier. Accessed 2021-02-03 - DOI - PMC - PubMed
    1. Giandomenico S.L., Mierau S.B., Gibbons G.M., Wenger L.M.D., Masullo L., Sit T., Sutcliffe M., Boulanger J., Tripodi M., Derivery E., Paulsen O., Lakatos A., Lancaster M.A.: Cerebral organoids at the air–liquid interface generate diverse nerve tracts with functional output. Nature Neuroscience 22(4), 669–679 (2019) 10.1038/s41593-019-0350-2. Accessed 2019-09-29 - DOI - PMC - PubMed

Publication types