[Preprint]. 2024 Mar 14:2024.03.13.584744.
doi: 10.1101/2024.03.13.584744.

Early intermediates in bacterial RNA polymerase promoter melting visualized by time-resolved cryo-electron microscopy

Affiliations

Early intermediates in bacterial RNA polymerase promoter melting visualized by time-resolved cryo-electron microscopy

Ruth M Saecker et al. bioRxiv. .

Update in

Abstract

During formation of the transcription-competent open complex (RPo) by bacterial RNA polymerases (RNAP), transient intermediates pile up before overcoming a rate-limiting step. Structural descriptions of these interconversions in real time are unavailable. To address this gap, time-resolved cryo-electron microscopy (cryo-EM) was used to capture four intermediates populated 120 or 500 milliseconds (ms) after mixing Escherichia coli σ70-RNAP and the λPR promoter. Cryo-EM snapshots revealed the upstream edge of the transcription bubble unpairs rapidly, followed by stepwise insertion of two conserved nontemplate strand (nt-strand) bases into RNAP pockets. As nt-strand "read-out" extends, the RNAP clamp closes, expelling an inhibitory σ70 domain from the active-site cleft. The template strand is fully unpaired by 120 ms but remains dynamic, indicating yet unknown conformational changes load it in subsequent steps. Because these events likely describe DNA opening at many bacterial promoters, this study provides needed insights into how DNA sequence regulates steps of RPo formation.


Conflict of interest statement

Competing interests. The authors declare there are no competing interests. The authors declare no conflict of interest

Figures

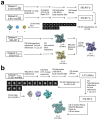
Extended Data Fig. 1 |
Extended Data Fig. 1 |. λPR promoter fragment and tr-Spotiton.
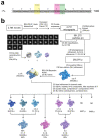
a. λPR promoter DNA construct (−85 to +20) used for cryo-EM studies. The sequence from −40 to +10 is magnified below. b. Schematic diagram illustrating the principle of the tr-Spotiton device. For more details see ref. .
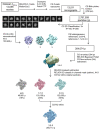
Extended Data Fig. 2 |
Extended Data Fig. 2 |. Cryo-EM processing pipeline for 120 ms datasets.
Cryo-EM processing pipelines for Eco RNAP mixed with λPR DNA using tr-Spotiton (t = 120 ms, 8 mM CHAPSO) a. Datasets 1120ms and 2120ms. b. Dataset 3120ms.
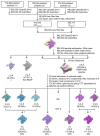
Extended Data Fig. 3 |
Extended Data Fig. 3 |. Cryo-EM processing pipeline for dataset 4400ms.
Cryo-EM processing pipeline for Eco RNAP mixed with λPR DNA using tr-Spotiton (t = 500 ms, 8 mM CHAPSO, dataset 4).
Extended Data Fig. 4 |
Extended Data Fig. 4 |. Cryo-EM processing pipeline for combined datasets.
Cryo-EM processing pipeline for combining polished particles from Spotiton datasets 1 - 3 (t = 120 ms; see Extended Data Fig. 2) and dataset 4 (t = 500 ms; see Extended Data Fig. 3).
Extended Data Fig. 5 |
Extended Data Fig. 5 |. Comparison of particle population distributions for 120 ms vs. 500 ms datasets.
Histogram plots showing the fraction of particles that contribute to each intermedate. The open bars show the mean particle fraction for the three 120 ms datasets (<123120ms>); the error bars denote the standard deviation for n=3. The gray bars denote the particle fraction for the single 500 ms dataset (4500ms).
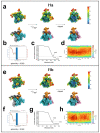
Extended Data Fig. 6 |
Extended Data Fig. 6 |. Cryo-EM of I1a and I1b.
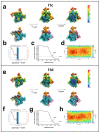
a.-d. Cryo-EM of I1a. a. Three views of the combined nominal 2.8 Å resolution cryo-EM map, filtered by local resolution . The bottom row is colored according to the subunit (αI, αII, light grey; αCTD, limon; β, cyan; β’, pink; σ70, orange; DNA t-strand, dark grey; DNA nt-strand, grey). The top row shows the same views but colored by local resolution . The right view is a cross-section through the middle view. b. Directional 3D FSC, determined with 3DFSC . c. Gold-standard FSC plot , calculated by comparing two half maps. The dotted line represents the 0.143 FSC cutoff. d. Angular distribution plot, calculated in cryoSPARC. Scale depicts number of particles assigned to a specific angular bin. e.-h. Cryo-EM of I1b. e. Three views of the combined nominal 3.0 A resolution cryo-EM map, filtered by local resolution . The bottom row is colored according to the subunit (αI, αII, light grey; αCTD, limon; β, cyan; α’, pink; σ70, orange; DNA t-strand, dark grey; DNA nt-strand, grey). The top row shows the same views but colored by local resolution . The right view is a cross-section through the middle view. f. Directional 3D FSC, determined with 3DFSC . g. Gold-standard FSC plot , calculated by comparing two half maps. The dotted line represents the 0.143 FSC cutoff. h. Angular distribution plot, calculated in cryoSPARC. Scale depicts number of particles assigned to a specific angular bin.
Extended Data Fig. 7 |
Extended Data Fig. 7 |. Cryo-EM of I1c and I1d.
a.-d. Cryo-EM of I1c. a. Three views of the combined nominal 3.0 Å resolution cryo-EM map, filtered by local resolution . The bottom row is colored according to the subunit (αI, αII, light grey; αCTD, limon; β, cyan; β’, pink; σ70, orange; DNA t-strand, dark grey; DNA nt-strand, grey). The top row shows the same views but colored by local resolution . The right view is a cross-section through the middle view. b. Directional 3D FSC, determined with 3DFSC . c. Gold-standard FSC plot , calculated by comparing two half maps. The dotted line represents the 0.143 FSC cutoff. d. Angular distribution plot, calculated in cryoSPARC. Scale depicts number of particles assigned to a specific angular bin. e.-h. Cryo-EM of I1d. e. Three views of the combined nominal 2.9 Å resolution cryo-EM map, filtered by local resolution . The bottom row is colored according to the subunit (αI, αII, light grey; αCTD, limon; β, cyan; β’, pink; σ70, orange; DNA t-strand, dark grey; DNA nt-strand, grey). The top row shows the same views but colored by local resolution . The right view is a cross-section through the middle view. f. Directional 3D FSC, determined with 3DFSC . g. Gold-standard FSC plot , calculated by comparing two half maps. The dotted line represents the 0.143 FSC cutoff. h. Angular distribution plot, calculated in cryoSPARC. Scale depicts number of particles assigned to a specific angular bin.
Extended Data Fig. 8 |
Extended Data Fig. 8 |. Cryo-EM processing pipeline for dataset 5500ms,FC8F.
Cryo-EM processing pipeline for Eco RNAP mixed with λPR DNA using tr-Spotiton (t = 500 ms, 1.5 mM FC8F).
Extended Data Fig. 9 |
Extended Data Fig. 9 |. Cryo-EM processing pipeline for 5°C dataset.
a. λPR promoter DNA construct used for 5°C cryo-EM studies. b. Cryo-EM processing pipeline for Eco RNAP and λPR DNA (−60 to +30) mixed manually and allowed to come to equilibrium at 5°C (See Methods).
Extended Data Fig. 10 |
Extended Data Fig. 10 |. Cryo-EM of RPC5°C, I1C5°C, and I1D5°C.
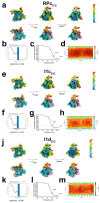
a.-d. Cryo-EM of RPC5°C. a. Three views of the combined nominal 3.1 Å resolution cryo-EM map, filtered by local resolution . The bottom row is colored according to the subunit (αI, αII, light grey; αCTD, limon; β, cyan; β’, pink; σ70, orange; DNA t-strand, dark grey; DNA nt-strand, grey). The top row shows the same views but colored by local resolution . The right view is a cross-section through the middle view. b. Directional 3D FSC, determined with 3DFSC . c. Gold-standard FSC plot , calculated by comparing two half maps. The dotted line represents the 0.143 FSC cutoff. d. Angular distribution plot, calculated in cryoSPARC. Scale depicts number of particles assigned to a specific angular bin. e.-h. CryoEM of I1C5°C. e. Three views of the combined nominal 3.4 A resolution cryo-EM map, filtered by local resolution . The bottom row is colored according to the subunit (αI, αII, light grey; αCTD, limon; β, cyan; β’, pink; σ70, orange; DNA t-strand, dark grey; DNA nt-strand, grey). The top row shows the same views but colored by local resolution . The right view is a cross-section through the middle view. f. Directional 3D FSC, determined with 3DFSC . g. Gold-standard FSC plot , calculated by comparing two half maps. The dotted line represents the 0.143 FSC cutoff. h. Angular distribution plot, calculated in cryoSPARC. Scale depicts number of particles assigned to a specific angular bin. j.-m. CryoEM of I1d5°C. j. Three views of the combined nominal 3.2 Å resolution cryo-EM map, filtered by local resolution . The bottom row is colored according to the subunit (αI, αII, light grey; αCTD, limon; β, cyan; β’, pink; σ70, orange; DNA t-strand, dark grey; DNA nt-strand, grey). The top row shows the same views but colored by local resolution . The right view is a cross-section through the middle view. k. Directional 3D FSC, determined with 3DFSC . l. Gold-standard FSC plot , calculated by comparing two half maps. The dotted line represents the 0.143 FSC cutoff. m. Angular distribution plot, calculated in cryoSPARC. Scale depicts number of particles assigned to a specific angular bin.
Extended Data Fig. 11 |
Extended Data Fig. 11 |. The σ70 W-dyad and the −12 bp in λPR intermediates.
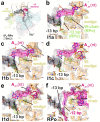
a. Top view of λPR-RPo (7MKD) . Eσ70 is shown as a transparent molecular surface. The DNA is shown as atomic spheres, color-coded as in Fig. 2a. b.-f. The boxed region in (a) is magnified, showing the region of the σ70 W-dyad and the −13 to −11 positions of the promoter. σ70 and DNA (color-coded as in Fig. 3) are shown in stick format; σ70 carbon atoms are colored orange but the W-dyad is highlighted in yellow. Transparent cryo-EM density (local-resolution filtered ) is superimposed. For reference, the positions of key RPo elements are shown in stick format and colored chartreuse (W-dyad in chair conformation and the −12 bp). For I1a, I1b, I1c, and I1d (b.- e.), the W-dyad is in the edge-on (wedge) conformation and the −12 bp is opened. Only in RPo is the W-dyad in the chair conformation and the −12 bp re-paired. b. I1a. c. I1b. d. I1c. e. I1d. f. RPo.
Extended Data Fig. 12 |
Extended Data Fig. 12 |. σ701.1 disulfide crosslinking, and a conformational change in the σ-finger.
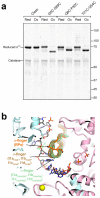
σ70 derivatives were analyzed by 10% SDS-polyacrylamide gel electrophoresis and visualized with Coomassie stain. Each σ70 derivative was analyzed under reducing (preventing formation of any disulfide bonds) or oxidizing (promoting the formation of disulfide bonds) conditions. Each Cys-pair mutant shows higher mobility under oxidizing conditions indicating formation of the relevant disulfide bond. Moreover, the difference in mobility between the reduced and oxidized condition correlates with the number of residues separating the two engineered Cys substitutions (I35C-S89C, 55 residues; Q8C-P32C, 25 residues; Y21C-Q54C, 34 residues). b. The λPR-RPo structure (7MKD) in the active-site region is shown; The RNAP is shown as a backbone cartoon (β, light cyan; β’, light pink; σ70, orange); t-strand DNA is shown in stick format (carbon atoms dark grey); the RNAP active-site Mg2+ is shown as a yellow sphere. The structures of I1a, I1b, I1c, and I1d from the CHAPSO (light green) and FC8F (brown) datasets were superimposed by the RNAP structural core and shown is the σ-finger from each.
Fig. 1 |
Fig. 1 |. Promoter melting Intermediates on the λPR Promoter.
a. (top) Minimal kinetic mechanism for the formation of RPo on λPR, using the nomenclature of Record & colleagues ,, with two kinetically significant intermediates, I1 and I2. In this scheme RNAP (R) binds the λPR promoter (P) and forms I1, an ensemble of rapidly equilibrating states . I1 converts to I2 in a rate-limiting step, which then converts rapidly to RPo. The intermediate RPc is only observed < 7°C. (bottom) Simulation of the time-course of the reaction under the conditions of the tr-Spotiton experiments (RT, [Eλ70] = 15 μM, [λPR-DNA] = 30 μM). See Methods for the kinetic parameters used to generate the simulation . For both 120 and 500 ms mixing times, only I1 (with no RPo) was expected. b. RNAP clamp conformational changes for intermediates determined in this work. The RPo structure (7MKD) was used as a reference to superimpose the intermediate structures via α-carbon atoms of the RNAP structural core, revealing a common RNAP structure (shown as a molecular surface) but with clamp conformational changes characterized as rigid body rotations about a rotation axis perpendicular to the page (denoted by the black dot). The clamp modules for RPc, I1b, and I1d are shown as backbone cartoons with cylindrical helices (λ70NCR is omitted for clarity). The angles of clamp opening for all the intermediates are shown relative to RPo (0°). c. Structural properties used to order the complexes in the RPo formation pathway. (top panel) Plotted in black (left scale) is the clamp opening angle [relative to λPR-RPo (7MKD) defined as 0°]. Plotted in orange (right scale) is the DNA-Eσ70 interface area (Å2) . (bottom panel) Plotted in black (left scale) is the root-mean-square deviation of α-carbon positions (Å) for each complex superimposed with RPo. Plotted in orange (right scale) is the most downstream Eσ70-DNA contact observed in each complex. Also see Extended Data Fig. 1 and Supplementary Video 1.
Fig. 2 |
Fig. 2 |. Transcription bubble nucleation.
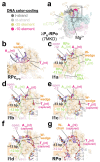
a. Top view of λPR-RPo (7MKD) . Eσ70 is shown as a transparent molecular surface. The DNA is shown as atomic spheres, color-coded as shown on the left. b. The boxed region in (a) is magnified (the β subunit is removed for clarity), showing the region of transcription bubble nucleation of RPC5°C. Protein is shown as a backbone worm with a transparent molecular surface. The side chains of the σ70 W-dyad (Eco σ W433/W434) are shown (W-wedge conformation). The duplex (closed) DNA is shown in cartoon format. c. As in (b) but showing I1a. The DNA is shown in stick format. The −12 bp is open due to steric clash with the W-wedge. A−11(nt) is flipped but not captured. For reference, the path of the DNA in RPo is shown in chartreuse, with the positions of key nucleotides shown in stick format [−12 bp, A−11(nt), T−7(nt)]. d. Magnified view of I1b. T−7(nt) is captured in its cognate σ70 pocket. e. Magnified view of I1c. f. Magnified view of I1d. A−11(nt) is captured but the W-dyad remains in the W-wedge conformation and the −12 bp remains open. g. Magnified view of RPo. The σ70 W-dyad has isomerized to the chair conformation, allowing repairing of the −12 bp. Also see Extended Data Figs. 2–11 and Supplementary Video 2.
Fig. 3 |
Fig. 3 |. Capture of T−7(nt) before A−11(nt).
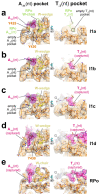
Each panel shows two views of the λPR-Eσ70 complexes. σ70 and DNA (color-coded as in Fig. 3) are shown in stick format; carbon atoms are colored orange but the W-dyad is highlighted in yellow. Transparent cryo-EM density (local-resolution filtered ) is superimposed. For reference, the positions of key RPo elements are shown in stick format and colored chartreuse [A−11(nt), T−7(nt), W-dyad in chair conformation]. (left) The σ702-A−11(nt) pocket, viewed from upstream. (right) The σ70-T−7(nt) pocket. a. I1a; (left) A−11(nt) is flipped but not captured [the σ702-A−11(nt) pocket is empty] and the W-dyad is in the wedge (edge-on) conformation, (right) The T−7(nt) pocket is empty. b. I1b; (left) A−11(nt) is flipped but not captured [the σ702-A−11(nt) pocket is empty] and the W-dyad is in the wedge (edge-on) conformation, (right) T−7(nt) is captured. c. I1c; (left) A−11(nt) is flipped but not captured [the σ702-A−11(nt) pocket is empty] and the W-dyad is in the wedge conformation, (right) T−7(nt) is captured. d. I1d; (left) A−11(nt) is captured but the W-dyad is still in the wedge conformation, (right) T−7(nt) is captured. e. RPo; (left) A−11(nt) is completely captured and the W-dyad is in the chair conformation, (right) T−7(nt) is captured. Also see Extended Data Fig. 11.
Fig. 4 |
Fig. 4 |. RNAP clamp closure partially unfolds and ejects σ701.1-
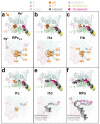
Each panel shows two views of the λPR-Eσ70 complexes (σ70NCR omitted for clarity), with color-coding shown at the top. (top) View into the RNAP active-site cleft. Eσ70 is shown as a backbone cartoon. Cryo-EM density for σ701.1 (orange) and the DNA are also shown. (bottom) View focusing on σ701.1 [viewed from the direction of the thick orange arrow in (a)]. Eσ70 is shown as a transparent molecular surface, but σ701.1 is shown as a backbone cartoon with cylindrical helices. DNA is shown in stick format. Transparent cryo-EM density (local-resolution filtered ) for σ701.1 (orange) and the DNA is also shown. a. RPc5°c. b. I1a. Closure of the clamp from the previous intermediate is denoted by the thick green arrow. c. I1b; σ701.1-H4 becomes largely disordered. d. I1c; cryo-EM density for σ701.1 is present but becomes mostly uninterpretable. e. I1d; σ701.1 is replaced by duplex DNA (+3 to +10) in the RNAP cleft. f. RPo. Also see Extended Data Figure 12.
Fig. 5 |
Fig. 5 |. σ701.1-H4 unfolding is necessary for RPo formation.
a. (top) Overall view of I1a. Eσ70 is shown as a transparent molecular surface but σ701.1 (orange) is shown as a backbone cartoon. (bottom) σ701.1 from boxed region above, colored as a rainbow ramp from the N-terminus (blue) to the C-terminus of H4 (red). Pairs of residues substituted with Cysteine (in the background of a Cysteine-less σ70 ) are shown as Ca spheres, with engineered disulfide bonds illustrated with thick lines. b. Synthesis of abortive products (ApUp*G, where * denotes α-[P32]) from λPR by Eσ70’s containing WT or mutant σ70’s as indicated. Oxidizing conditions (to form disulfide bonds, left) are compared with reducing conditions (right). c. Relative intensity of abortive products (normalized with respect to WT σ70) for mutant σ70’s under oxidizing and reducing conditions. Error bars denote the standard deviation of n=3 measurements. d. Ratio of abortive product intensity for oxidized/reduced conditions [error bars were calculated by error propagation from the standard deviations shown in (c)]. The I35C-S89C disulfide, crosslinking σ701.1-H4 to H3, is severely defective under oxidizing conditions. Also see Extended Data Fig. 12.
Fig. 6 |
Fig. 6 |. Schematic overview of initial steps of promoter opening at λPR.
The region of transcription bubble nucleation is shown for RPc, each I1 intermediate, and RPo. The RNAP active-site Mg2+ is shown as a yellow sphere. The σ702 domain, with its A−11(nt) and T−7(nt) pockets, and σ701.1, are shown in orange. In RPc to I1c, elements of σ701.1 are in the RNAP active-site cleft between elements of β (cyan) and P’ (pink). Closure of the clamp is denoted by the black arrows. The DNA is shown as a backbone worm (−10 element colored hot pink). Poorly-resolved regions of the DNA or σ701.1 are illustrated by dashed lines.

Similar articles

References

    1. Feklistov A., Sharon B. D., Darst S. A. & Gross C. A. Bacterial sigma factors: a historical, structural, and genomic perspective. Annual Review of Microbiology 68, 357–376 (2014). - PubMed
    1. Gruber T. M. & Gross C. A. Multiple sigma subunits and the partitioning of bacterial transcription space. Annual Review of Microbiology 57, 441–466 (2003). - PubMed
    1. Zhang G. et al. Crystal structure of Thermus aquaticus core RNA polymerase at 3.3 A resolution. Cell 98, 811–24 (1999). - PubMed
    1. Shultzaberger R. K., Chen Z., Lewis K. A. & Schneider T. D. Anatomy of Escherichia coli 70 promoters. Nucleic Acids Research 35, 771–788 (2007). - PMC - PubMed
    1. Ruff E. F. Jr, M. T. R. & Artsimovitch I. Initial events in bacterial transcription initiation. Biomolecules 5, 1035–1062 (2015). - PMC - PubMed

Publication types