

The diversity of endophytic fungi in Tartary buckwheat (Fagopyrum tataricum) and its correlation with flavonoids and phenotypic traits
- PMID: 38559356
- PMCID: PMC10979544
- DOI: 10.3389/fmicb.2024.1360988
The diversity of endophytic fungi in Tartary buckwheat (Fagopyrum tataricum) and its correlation with flavonoids and phenotypic traits
Abstract
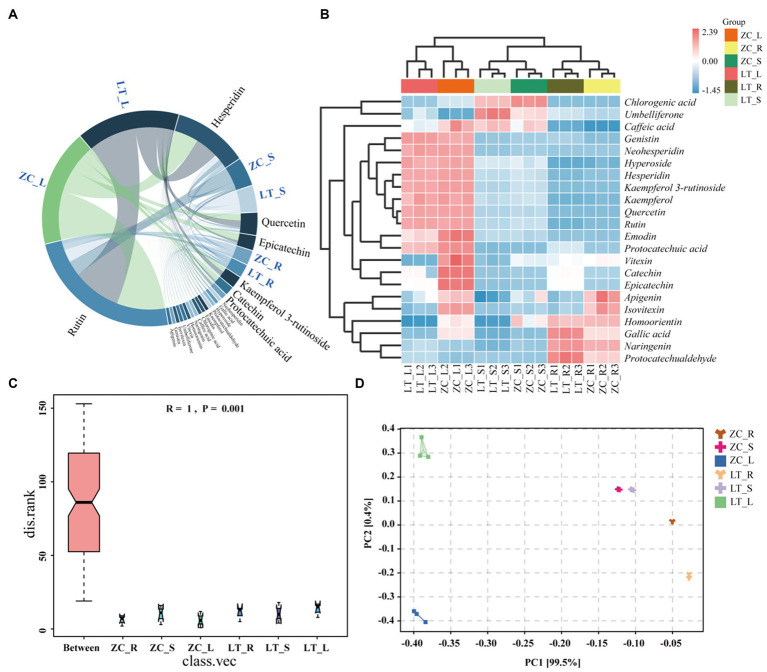
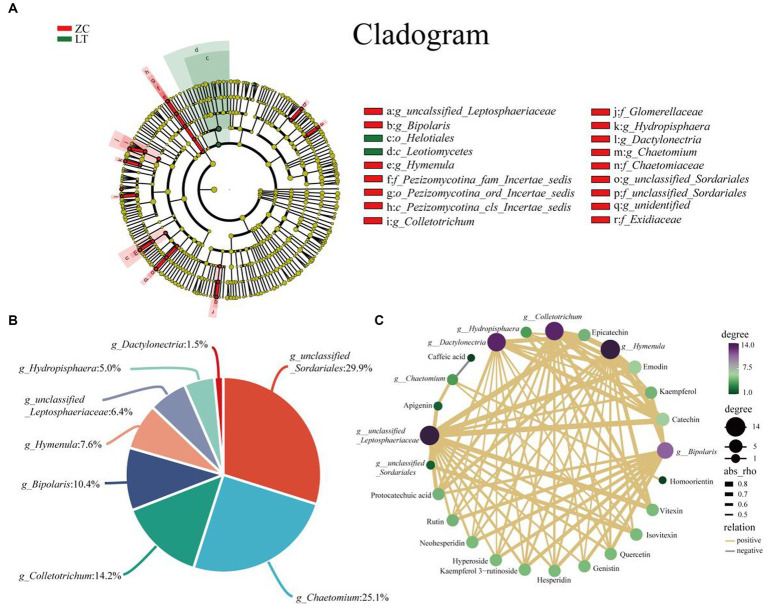
Tartary buckwheat (Fagopyrum tataricum) is a significant medicinal crop, with flavonoids serving as a crucial measure of its quality. Presently, the artificial cultivation of Tartary buckwheat yields low results, and the quality varies across different origins. Therefore, it is imperative to identify an effective method to enhance the yield and quality of buckwheat. Endophytic fungi reside within plants and form a mutually beneficial symbiotic relationship, aiding plants in nutrient absorption, promoting host growth, and improving secondary metabolites akin to the host. In this study, high-throughput sequencing technology was employed to assess the diversity of endophytic fungi in Tartary buckwheat. Subsequently, a correlation analysis was performed between fungi and metabolites, revealing potential increases in flavonoid content due to endophytic fungi such as Bipolaris, Hymenula, and Colletotrichum. Additionally, a correlation analysis between fungi and phenotypic traits unveiled the potential influence of endophytic fungi such as Bipolaris, Buckleyzyma, and Trichosporon on the phenotypic traits of Tartary buckwheat. Notably, the endophytic fungi of the Bipolaris genus exhibited the potential to elevate the content of Tartary buckwheat metabolites and enhance crop growth. Consequently, this study successfully identified the resources of endophytic fungi in Tartary buckwheat, explored potential functional endophytic fungi, and laid a scientific foundation for future implementation of biological fertilizers in improving the quality and growth of Tartary buckwheat.
Keywords: Tartary buckwheat; endophytic fungi; flavonoids; high-throughput sequencing; phenotypic traits.
Copyright © 2024 Chen, Ding, Zhou, Shang, Li, Li, Bu, Tang and Chen.
Conflict of interest statement
The authors declare that the research was conducted in the absence of any commercial or financial relationships that could be construed as a potential conflict of interest.
Figures


Similar articles
-
Transcriptome analysis reveals changes in lignin and flavonoid biosynthesis in Serendipita indica colonized Tartary buckwheat.Front Plant Sci. 2025 Jun 5;16:1595781. doi: 10.3389/fpls.2025.1595781. eCollection 2025. Front Plant Sci. 2025. PMID: 40538868 Free PMC article.
-
Serendipita indica-dominated synthetic microbial consortia enhanced tartary buckwheat growth and improved its tolerance to drought stress.Front Microbiol. 2025 Mar 19;16:1562341. doi: 10.3389/fmicb.2025.1562341. eCollection 2025. Front Microbiol. 2025. PMID: 40177481 Free PMC article.
-
Under the combined application of selenium and sulfur, sulfur does not interfere with selenite uptake in Tartary buckwheat.Food Chem. 2025 Oct 15;489:144895. doi: 10.1016/j.foodchem.2025.144895. Epub 2025 May 27. Food Chem. 2025. PMID: 40466541
-
An Overview of Buckwheat-A Superfood with Applicability in Human Health and Food Packaging.Plants (Basel). 2025 Jul 16;14(14):2200. doi: 10.3390/plants14142200. Plants (Basel). 2025. PMID: 40733437 Free PMC article. Review.
-
Systematic Review of Human and Animal Evidence on the Role of Buckwheat Consumption on Gastrointestinal Health.Nutrients. 2022 Dec 20;15(1):1. doi: 10.3390/nu15010001. Nutrients. 2022. PMID: 36615659 Free PMC article.
Cited by
-
Antagonistic effects of endophytic fungi from Camellia reticulata pedicels on yeasts: implications for antimicrobial mechanism of nectar.Front Plant Sci. 2024 Nov 15;15:1494855. doi: 10.3389/fpls.2024.1494855. eCollection 2024. Front Plant Sci. 2024. PMID: 39619852 Free PMC article.
-
Physiological Mechanism of EBR for Grain-Filling and Yield Formation of Tartary Buckwheat.Plants (Basel). 2024 Nov 28;13(23):3336. doi: 10.3390/plants13233336. Plants (Basel). 2024. PMID: 39683127 Free PMC article.
-
Mechanisms and Impact of Rhizosphere Microbial Metabolites on Crop Health, Traits, Functional Components: A Comprehensive Review.Molecules. 2024 Dec 15;29(24):5922. doi: 10.3390/molecules29245922. Molecules. 2024. PMID: 39770010 Free PMC article. Review.
-
Airborne Fungal Spore Diversity Assessment Using Culture-Dependent and Metabarcoding Approaches in Bat-Inhabited Natural and Anthropogenic Roosts in Portugal.J Fungi (Basel). 2025 May 6;11(5):360. doi: 10.3390/jof11050360. J Fungi (Basel). 2025. PMID: 40422694 Free PMC article.
-
Exploring Plant Growth-Promoting Traits of Endophytic Fungi Isolated from Ligusticum chuanxiong Hort and Their Interaction in Plant Growth and Development.J Fungi (Basel). 2024 Oct 12;10(10):713. doi: 10.3390/jof10100713. J Fungi (Basel). 2024. PMID: 39452665 Free PMC article.
References
-
- Abdolmaleki A. K., Pirdashti H., Yaghoubian Y., Abbasian A., Shiade S. R. G. (2022). Endophytic fungi improve growth and yield of wheat (Triticum aestivum L.) under limited light conditions. Gesunde Pflanz. 75, 1517–1529. doi: 10.1007/s10343-022-00816-x - DOI
-
- Aguirre-Hernández E., González-Trujano M. E., Martínez A. L., Moreno J., Kite G., Terrazas T., et al. (2009). HPLC/MS analysis and anxiolytic-like effect of quercetin and kaempferol flavonoids from Tilia americana var. mexicana. J. Ethnopharmacol. 127, 91–97. doi: 10.1016/j.jep.2009.09.044, PMID: - DOI - PubMed
-
- Airin A. A., Arafat M. I., Begum R. A., Islam M. R., Seraj Z. I. (2023). Plant growth-promoting endophytic fungi of the wild halophytic rice Oryza coarctata. Ann. Microbiol. 73:36. doi: 10.1186/s13213-023-01738-3 - DOI
-
- Akhoon B. A., Gupta S. K., Dhar M. K. (2023). Dissecting the genome, secretome, and effectome repertoires of Monilinia spp.: The causal agent of brown rot disease: A comparative analysis. Postharvest Biol. Technol. 195:112120. doi: 10.1016/j.postharvbio.2022.112120 - DOI
LinkOut - more resources
Full Text Sources