. 2024 Feb 14;9(3):303-318.
doi: 10.1016/j.jacbts.2023.11.008. eCollection 2024 Mar.

Small Molecule Activators of Mitochondrial Fusion Prevent Congenital Heart Defects Induced by Maternal Diabetes

Affiliations

Small Molecule Activators of Mitochondrial Fusion Prevent Congenital Heart Defects Induced by Maternal Diabetes

Guanglei Wang et al. JACC Basic Transl Sci. .

Abstract

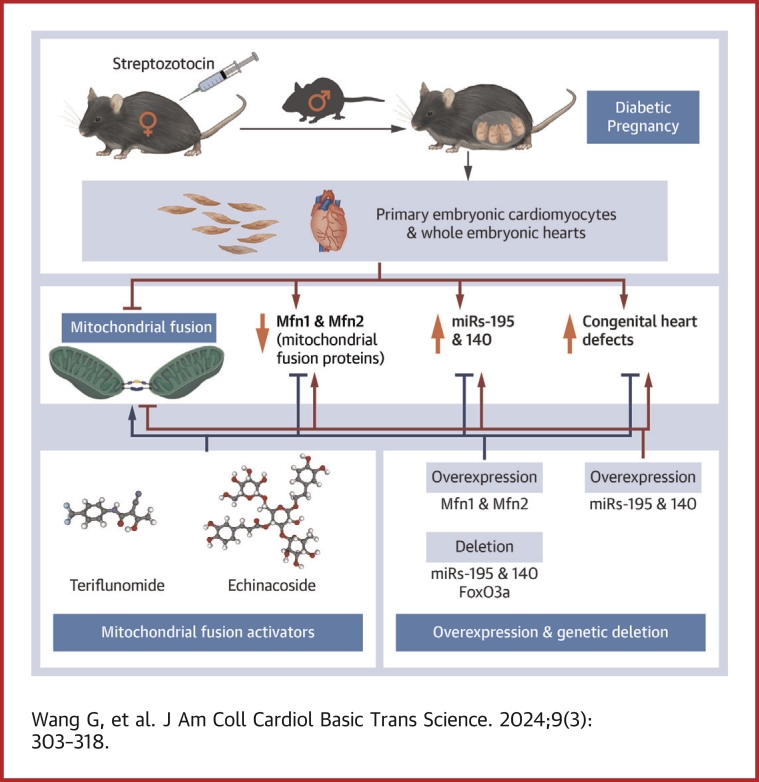
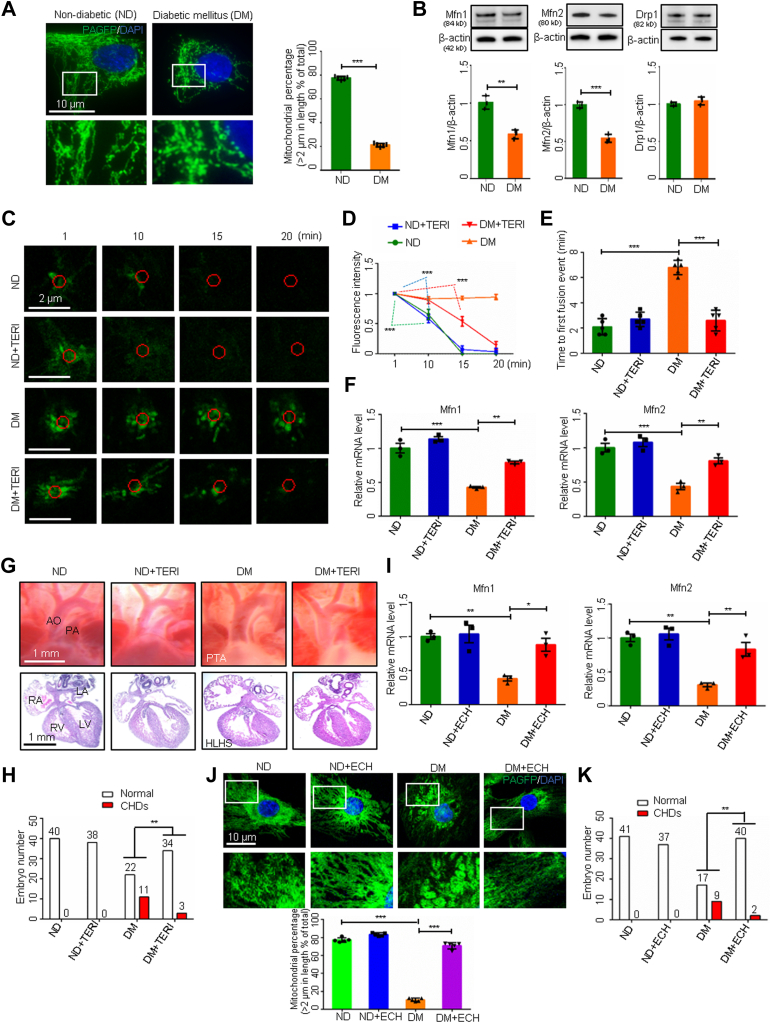
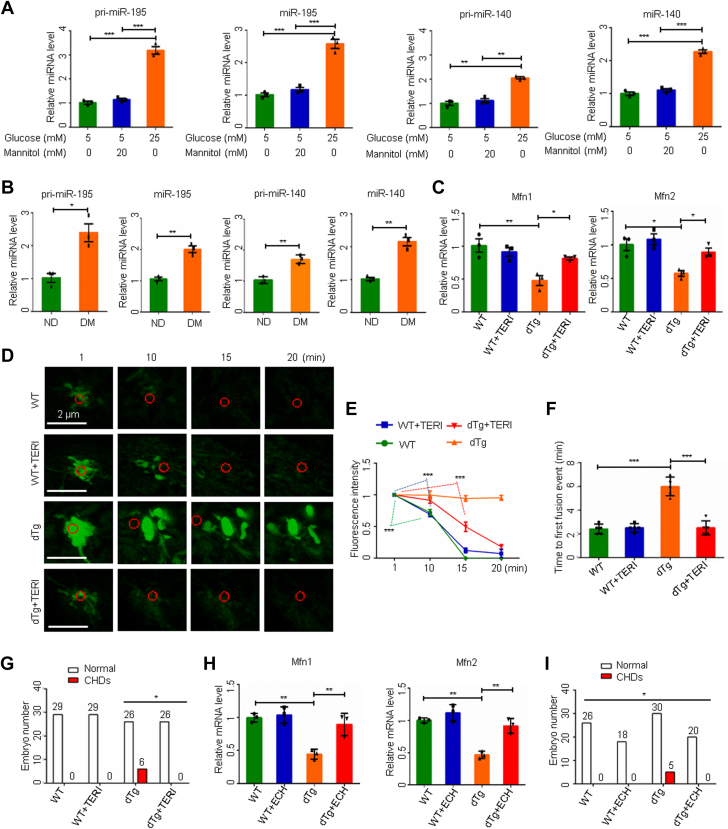
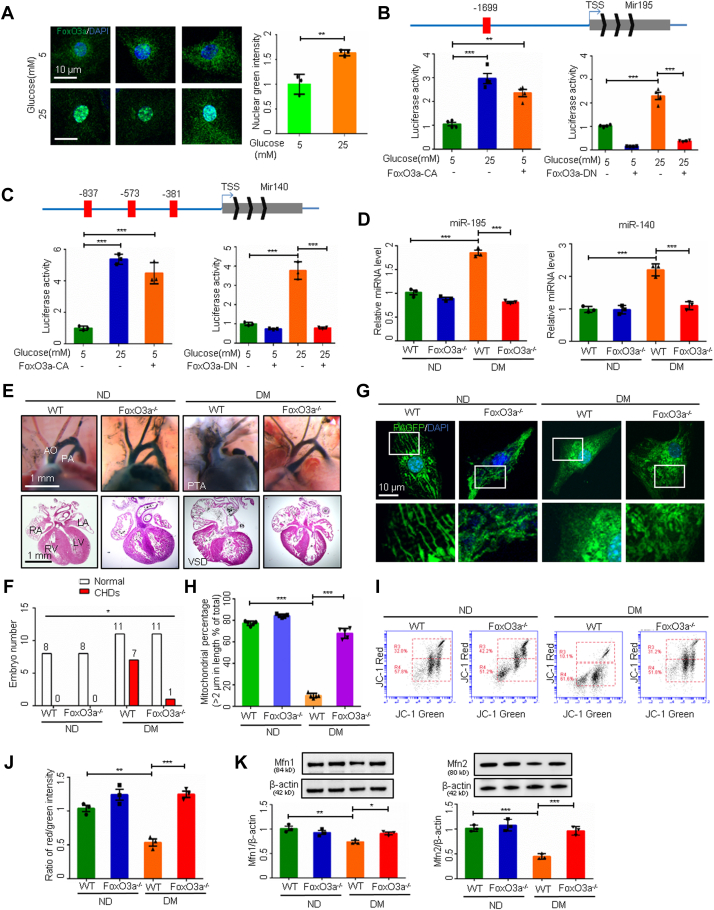
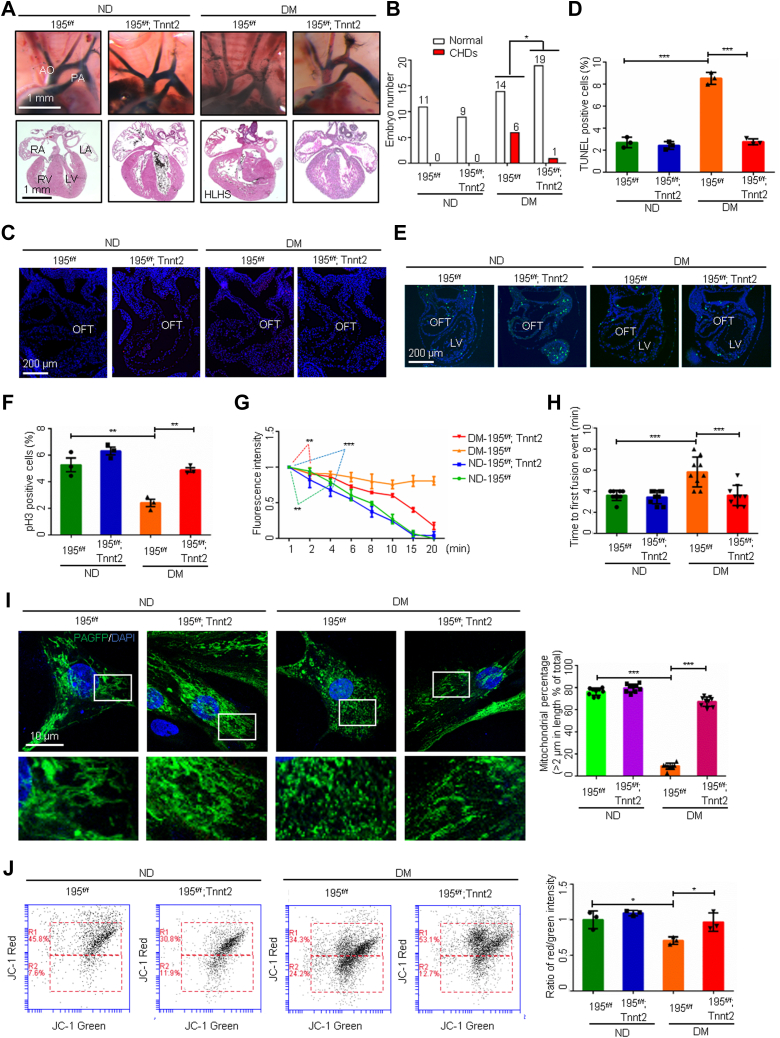
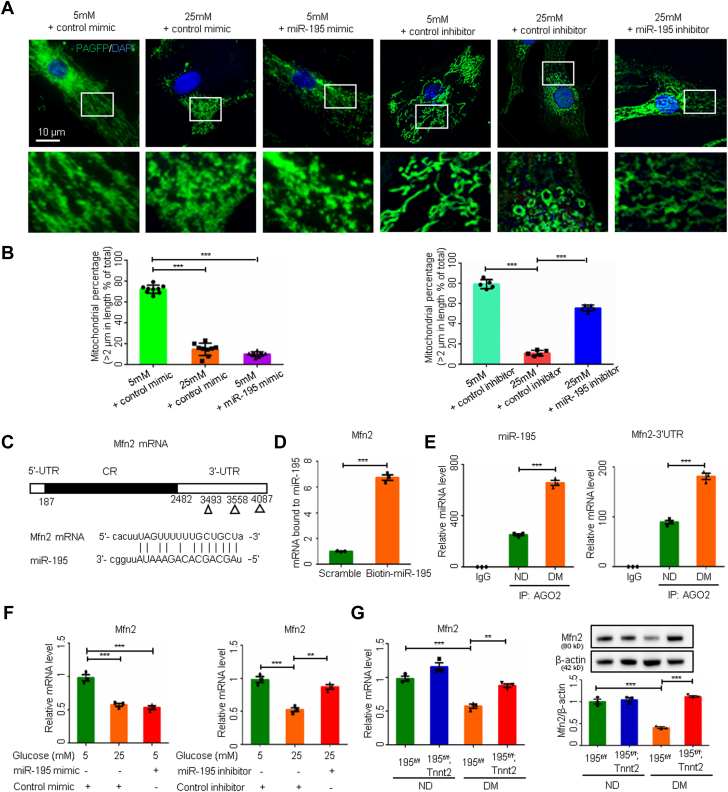
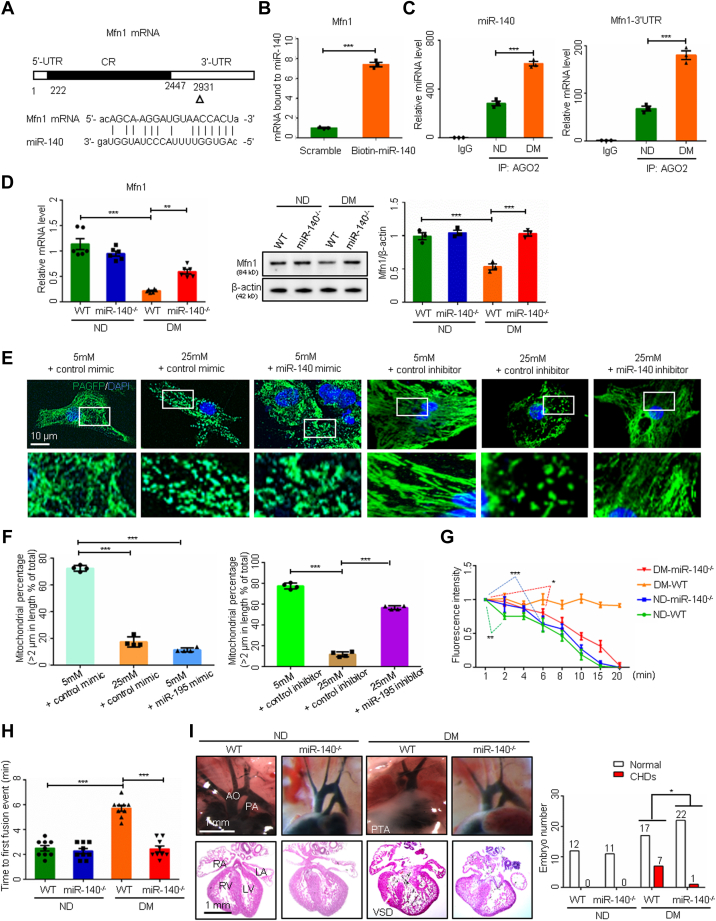
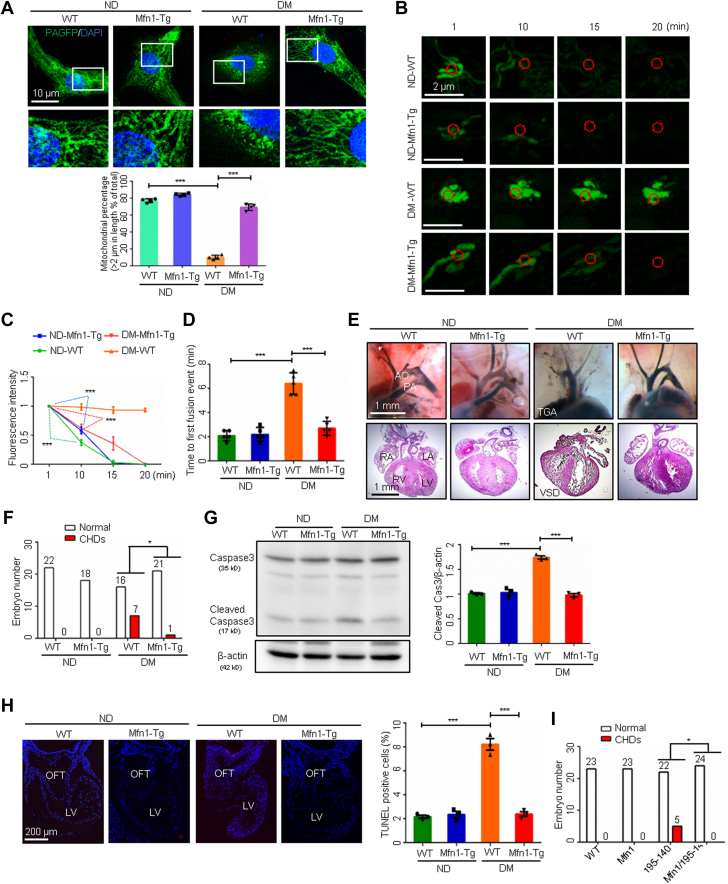
Most congenital heart defect (CHD) cases are attributed to nongenetic factors; however, the mechanisms underlying nongenetic factor-induced CHDs are elusive. Maternal diabetes is one of the nongenetic factors, and this study aimed to determine whether impaired mitochondrial fusion contributes to maternal diabetes-induced CHDs and if mitochondrial fusion activators, teriflunomide and echinacoside, could reduce CHD incidence in diabetic pregnancy. We demonstrated maternal diabetes-activated FoxO3a increases miR-140 and miR-195, which in turn represses Mfn1 and Mfn2, leading to mitochondrial fusion defects and CHDs. Two mitochondrial fusion activators are effective in preventing CHDs in diabetic pregnancy.

Keywords: congenital heart defect; maternal diabetes; microRNA; mitochondrial fusion; mitofusin 1; mitofusin 2.


Conflict of interest statement

This work was financially supported by National Institutes of Health grants R01DK083243, R01DK101972, R01DK103024, R01HL131737, R01HL134368, R01HL139060, R01HL153141, and R01HL151108. The authors have reported that they have no relationships relevant to the contents of this paper to disclose.

Figures

None
Graphical abstract
Figure 1
Figure 1
Mitochondrial Fusion Activators Ameliorate Maternal Diabetes–Induced CHDs (A and J) Primary cardiomyocytes transfected with mitochondrial matrix-targeted photoactive green fluorescent protein (mito-PAGFP) and percentage of mitochondria (>2 μm) per area in cells (n = 5). (B) Protein levels in embryonic day 12.5 (E12.5) hearts (n = 3). (C) mito-PAGFP in primary cardiomyocytes. Red circles: photoactivated regions. (D) Mito-PAGFP intensity (n = 3). (E) Time to first fusion event (n = 5). (F and I) Messenger RNA levels in E12.5 hearts (n = 3). (G) Heart vessels (upper) and sections (lower). (H and K) Numbers of embryos. Data are presented as mean ± SD in A, B, D, E, F, I, and J. Student’s t-test in A and B. One-way analysis of variance with Tukey’s post hoc test in D, E, F, I, and J. Chi-square test in H and K. ∗P < 0.05, ∗∗P < 0.01, ∗∗∗P < 0.001. AO = aorta; CHD = congenital heart defect; ECH = echinacoside; HLHS = hypoplastic left heart syndrome; LA/RA = left/right atrium; LV/RV = left/right ventricle; PA = pulmonary artery; PTA = persistent truncus arteriosus; TERI = teriflunomide.
Figure 2
Figure 2
Mitochondrial Fusion Activators Reduce CHDs Induced by miR-195/140 Transgenic Overexpression MicroRNA (miRNA) levels in primary cardiomyocytes (n = 3) (A) and in embryonic day 12.5 (E12.5) hearts (B) (n = 3). (C and H) mRNA levels in E12.5 hearts (n = 3). (D) Time-lapse images of mitochondrial matrix-targeted photoactive green fluorescent protein (mito-PAGFP) in primary cardiomyocytes. (E) mito-PAGFP fluorescence intensity (n = 3). (F) Time to first mitochondrial fusion event (n = 5). (G and I) Numbers of E17.5 embryos. Data are presented as mean ± SD in A, B, C, E, F, and H. One-way analysis of variance with Tukey’s post hoc test in A, C, E, F, and H. Student’s t-test in (B). Chi-square test in G and I. ∗P < 0.05, ∗∗P < 0.01, ∗∗∗P < 0.001. dTg = miR-195 and miR-140 double transgenic; WT = wild-type; other abbreviations as in Figure 1.
Figure 3
Figure 3
FoxO3a Upregulates miR-140/195 and Represses Mitochondrial Fusion (A) FoxO3a immunostaining in primary cardiomyocytes and quantification of fluorescence intensity in nuclei (n = 3). FoxO3a binding sites on the Mir195 (B) and Mir140 (C) promoters and promoter-driven luciferase reporter activity in H9C2 cells (n = 3). (D) MicroRNA (miRNA) levels in embryonic day 12.5 (E12.5) hearts (n = 3). (E) E17.5 heart vessels (upper) and sections (lower). (F) Numbers of E17.5 embryos. (G) Representative images of primary cardiomyocytes. (H) Percentage of mitochondria (>2 μm) per area in cells (n = 5). (I and J) Flow cytometry analysis and ratios of fluorescence intensity (red/green) in primary cardiomyocytes (n = 3). (K) Protein levels (n = 3). Data are presented as mean ± SD in A, B, C, D, H, J, and K. Student’s t-test in A. One-way analysis of variance with Tukey’s post hoc test in B, C, D, H, J, and K. Chi-square test in F. ∗P < 0.05, ∗∗P < 0.01, ∗∗∗P < 0.001. DM = diabetes mellitus; ND = nondiabetic; TSS = transcription start site; VSD = ventricular septum defect; other abbreviations as in Figures 1 and 2.
Figure 4
Figure 4
miR-195 Deletion Restores Mitochondrial Fusion (A) Images of embryonic day 17.5 (E17.5) heart vessels (upper) and sections (lower). (B) Numbers of E17.5 embryos. TUNEL-positive cells in E9.5 hearts (C) and the quantification (D) (n = 3). p-H3-positive cells in E9.5 hearts (E) and the quantification (F) (n = 3). (G) Mitochondrial matrix-targeted photoactive green fluorescent protein (mito-PAGFP) intensity in primary cardiomyocytes (n = 3). (H) Time to first mitochondrial fusion event (n = 9). (I) Representative images of primary cardiomyocytes and percentage of mitochondria (>2 μm) per area in cells (n = 9). (J) Flow cytometry analysis and ratios of fluorescence intensity (red/green) in primary cardiomyocytes (n = 3). Data are presented as mean ± SD in D, F, G, H, I, and J. Chi-square test in (B). One-way analysis of variance with Tukey’s post hoc test in D, F, G, H, I, and J. ∗P < 0.05, ∗∗P < 0.01, ∗∗∗P < 0.001. OFT = outflow tract; other abbreviations as in Figure 1, Figure 2, Figure 3.
Figure 5
Figure 5
Inhibition of miR-195 Improves Mitochondrial Fusion by Upregulating Mfn2 (A) Representative images of primary cardiomyocytes. (B) Percentage of mitochondria (>2 μm) per area in cells (n = 9 or 5). (C) miR-195 binding site on Mfn2 mRNA. (D) Mfn2 mRNA level bound to biotin-labeled miR-195 (n = 3). (E) miR-195 and Mfn2 mRNA in RNA co-immunoprecipitation (IP) in embryonic day 12.5 (E12.5) hearts (n = 3). (F) Mfn2 mRNA in primary cardiomyocytes (n = 3). (G) Mfn2 mRNA and protein levels (n = 3). Data are presented as mean ± SD in B, D, E, F, and G. One-way analysis of variance with Tukey’s post hoc test in B, F, and G. Student’s t-test in D and E. ∗P < 0.05, ∗∗P < 0.01, ∗∗∗P < 0.001. IgG = immunoglobulin G; IP = immunoprecipitation; UTR = untranslated region; other abbreviations as in Figure 1, Figure 2, Figure 3.
Figure 6
Figure 6
miR-140 Deficiency Restores Mfn1 Expression and Mitochondrial Fusion (A) The miR-140 binding site on Mfn1 mRNA. (B) Mfn1 mRNA bond to biotin-labeled miR-140 (n = 3). (C) miR-140 and Mfn1 mRNA levels in RNA immunoprecipitation (n = 3). (D) Mfn1 mRNA and protein levels (n = 3). (E) Representative images of primary cardiomyocytes. (F) Percentage of mitochondria (>2 μm) per area in cells (n = 4). (G) Mitochondrial matrix-targeted photoactivable green fluorescent protein intensity in primary cardiomyocytes (n = 3). (H) Time to first mitochondrial fusion event (n = 9). (I) Images of embryonic day 17.5 heart vessels (upper) and sections (lower). Data are presented as mean ± SD in B, C, D, F, G, and H. Student’s t-test in B and C. One-way analysis of variance with Tukey’s post hoc test in D, F, G, and H. Chi-square test in I. ∗P < 0.05, ∗∗P < 0.01, ∗∗∗P < 0.001. Abbreviations as in Figure 1, Figure 2, Figure 3, Figure 4, Figure 5.
Figure 7
Figure 7
Restoring Mfn1 Expression Abrogates the Teratogenicity of Maternal Diabetes (A) Representative images of primary cardiomyocytes and percentage of mitochondria (>2 μm) per area in cells (n = 4). (B) Time-lapse images of mitochondrial matrix-targeted photoactivable green fluorescent protein (mito-PAGFP) in primary cardiomyocytes. (C) mito-PAGFP intensity in primary cardiomyocytes (n = 3). (D) Time to first mitochondrial fusion event (n = 5). (E) Embryonic day 17.5 (E17.5) heart vessels (upper) and sections (lower). (F and I) Numbers of E17.5 embryos. (G) Cleaved caspase-3 levels (n = 3). (H) TUNEL-positive cells in E9.5 hearts and the quantification (n = 3). Data are presented as mean ± SD in A, C, D, G, and H. One-way analysis of variance with Tukey’s post hoc test in A, C, D, G, and H. Chi-square test in F and I. ∗P < 0.05, ∗∗P < 0.01, ∗∗∗P < 0.001. TGA = transposition of the great arteries; other abbreviations as in Figure 1, Figure 2, Figure 3, Figure 4, Figure 5.

Similar articles

Cited by

References

    1. Mathews T.J., Driscoll A.K. Trends in infant mortality in the United States, 2005-2014. NCHS Data Brief. 2017;(279):1–8. - PubMed
    1. Virani S.S., Alonso A., Benjamin E.J., et al. Heart disease and stroke statistics-2020 update: a report from the American Heart Association. Circulation. 2020;141:e139–e596. - PubMed
    1. Botto L.D., Mulinare J., Erickson J.D. Occurrence of congenital heart defects in relation to maternal mulitivitamin use. Am J Epidemiol. 2000;151:878–884. - PubMed
    1. Oyen N., Olsen S.F., Basit S., et al. Association between maternal folic acid supplementation and congenital heart defects in offspring in birth cohorts from Denmark and Norway. J Am Heart Assoc. 2019;8 - PMC - PubMed
    1. Jenkins K.J., Correa A., Feinstein J.A., et al. Noninherited risk factors and congenital cardiovascular defects: current knowledge: a scientific statement from the American Heart Association Council on Cardiovascular Disease in the Young: endorsed by the American Academy of Pediatrics. Circulation. 2007;115:2995–3014. - PubMed