

Primate Model Carrying LMNA Mutation Develops Dilated Cardiomyopathy
- PMID: 38559624
- PMCID: PMC10978409
- DOI: 10.1016/j.jacbts.2023.11.002
Primate Model Carrying LMNA Mutation Develops Dilated Cardiomyopathy
Abstract
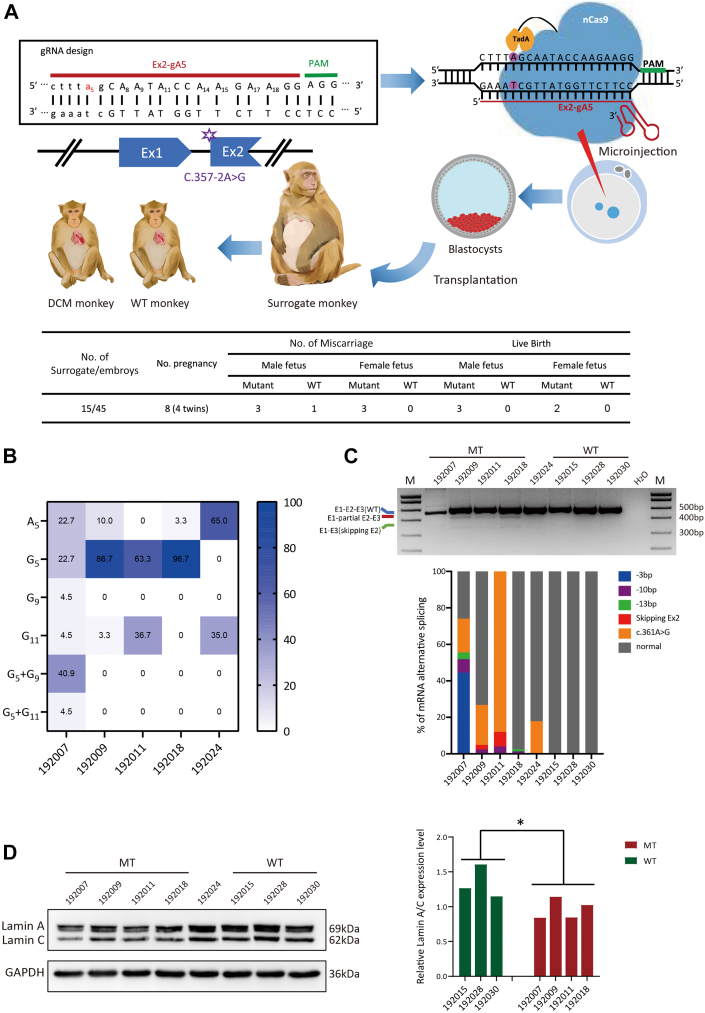
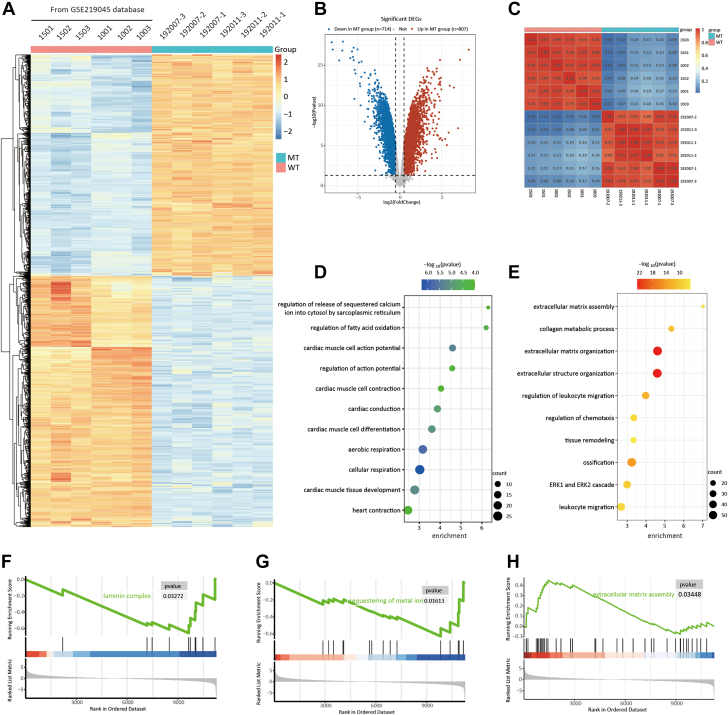
To solve the clinical transformation dilemma of lamin A/C (LMNA)-mutated dilated cardiomyopathy (LMD), we developed an LMNA-mutated primate model based on the similarity between the phenotype of primates and humans. We screened out patients with LMD and compared the clinical data of LMD with TTN-mutated and mutation-free dilated cardiomyopathy to obtain the unique phenotype. After establishment of the LMNA c.357-2A>G primate model, primates were continuously observed for 48 months, and echocardiographic, electrophysiological, histologic, and transcriptional data were recorded. The LMD primate model was found to highly simulate the phenotype of clinical LMD. In addition, the LMD primate model shared a similar natural history with humans.
Keywords: CRISPR-mediated adenine base editing; dilated cardiomyopathy; lamin A/ C; primate model.
© 2024 The Authors.
Conflict of interest statement
This work was supported by the National Natural Science Fund for Distinguished Young Scholars of China (82125004), the National Key Research and Development Program of China (2021YFA0805700), the National Natural Science Foundation of China (U2102204), and the Natural Science Foundation of Yunnan Province (grant numbers 202001BC070001 and 202102AA100053). The authors have reported that they have no relationships relevant to the contents of this paper to disclose.
Figures


Similar articles
-
Investigating LMNA-Related Dilated Cardiomyopathy Using Human Induced Pluripotent Stem Cell-Derived Cardiomyocytes.Int J Mol Sci. 2021 Jul 23;22(15):7874. doi: 10.3390/ijms22157874. Int J Mol Sci. 2021. PMID: 34360639 Free PMC article.
-
The LMNA mutation p.Arg321Ter associated with dilated cardiomyopathy leads to reduced expression and a skewed ratio of lamin A and lamin C proteins.Exp Cell Res. 2013 Nov 15;319(19):3010-9. doi: 10.1016/j.yexcr.2013.08.024. Epub 2013 Aug 31. Exp Cell Res. 2013. PMID: 24001739
-
A novel deletion mutation accompanied by a point mutation in Lamin A/C gene: Screened from a dilated cardiomyopathy family.Perfusion. 2023 May;38(4):826-836. doi: 10.1177/02676591221090587. Epub 2022 May 5. Perfusion. 2023. PMID: 35514053
-
Mutations in the LMNA gene encoding lamin A/C.Hum Mutat. 2000 Dec;16(6):451-9. doi: 10.1002/1098-1004(200012)16:6<451::AID-HUMU1>3.0.CO;2-9. Hum Mutat. 2000. PMID: 11102973 Review.
-
Lamin A/C Cardiomyopathy: Implications for Treatment.Curr Cardiol Rep. 2019 Nov 26;21(12):160. doi: 10.1007/s11886-019-1224-7. Curr Cardiol Rep. 2019. PMID: 31773301 Review.
Cited by
-
A Valuable Genetically Engineered Nonhuman Primate Model of Dilated Cardiomyopathy.JACC Basic Transl Sci. 2024 Mar 28;9(3):396-398. doi: 10.1016/j.jacbts.2024.01.004. eCollection 2024 Mar. JACC Basic Transl Sci. 2024. PMID: 38559618 Free PMC article.
-
When Off-Target Is the Target: Treating Noncardiomyocytes in Cardiac Laminopathy.JACC Basic Transl Sci. 2024 Nov 25;9(11):1326-1328. doi: 10.1016/j.jacbts.2024.09.012. eCollection 2024 Nov. JACC Basic Transl Sci. 2024. PMID: 39619143 Free PMC article.
-
The Pathogenic Mechanisms of and Novel Therapies for Lamin A/C-Related Dilated Cardiomyopathy Based on Patient-Specific Pluripotent Stem Cell Platforms and Animal Models.Pharmaceuticals (Basel). 2024 Aug 5;17(8):1030. doi: 10.3390/ph17081030. Pharmaceuticals (Basel). 2024. PMID: 39204134 Free PMC article. Review.
References
-
- Jefferies J.L., Towbin J.A. Dilated cardiomyopathy. Lancet. 2010;375:752–762. - PubMed
-
- Captur G., Arbustini E., Bonne G., et al. Lamin and the heart. Heart. 2018;104:468–479. - PubMed
-
- Kayvanpour E., Sedaghat-Hamedani F., Amr A., et al. Genotype-phenotype associations in dilated cardiomyopathy: meta-analysis on more than 8000 individuals. Clin Res Cardiol. 2017;106:127–139. - PubMed
LinkOut - more resources
Full Text Sources
Research Materials
Miscellaneous
