. 2024 Jan 10;9(3):342-360.
doi: 10.1016/j.jacbts.2023.11.003. eCollection 2024 Mar.

Reducing Abdominal Aortic Aneurysm Progression by Blocking Neutrophil Extracellular Traps Depends on Thrombus Formation

Affiliations

Reducing Abdominal Aortic Aneurysm Progression by Blocking Neutrophil Extracellular Traps Depends on Thrombus Formation

Nahla Ibrahim et al. JACC Basic Transl Sci. .

Abstract

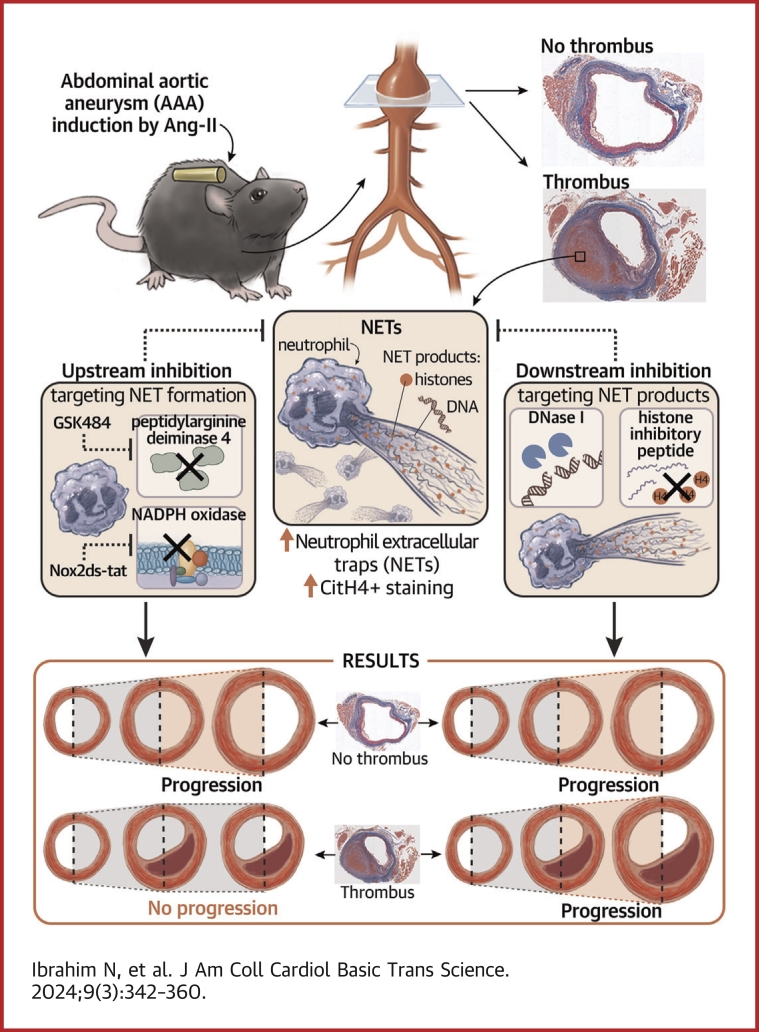
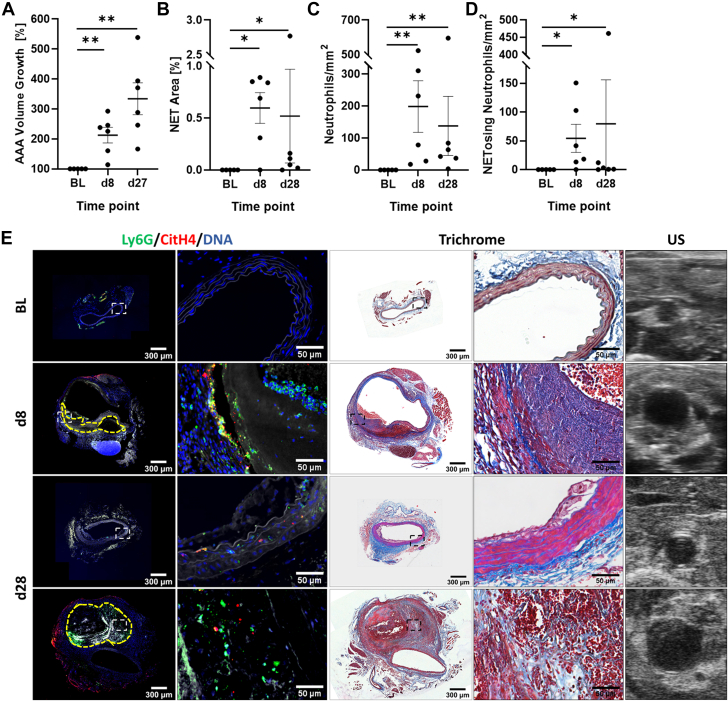
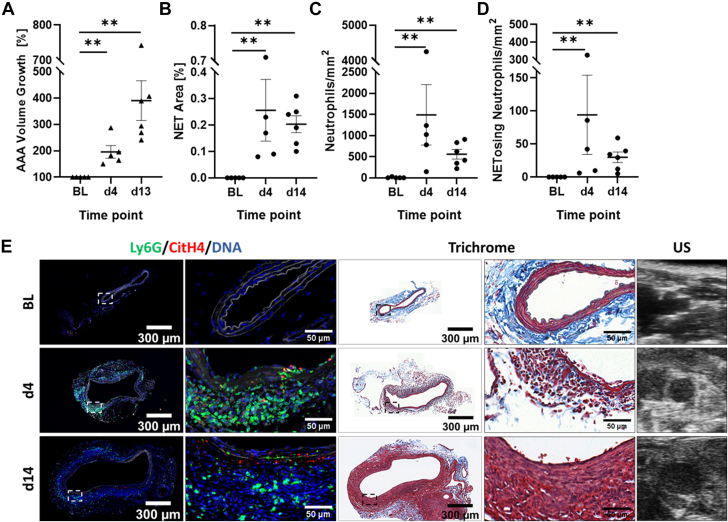
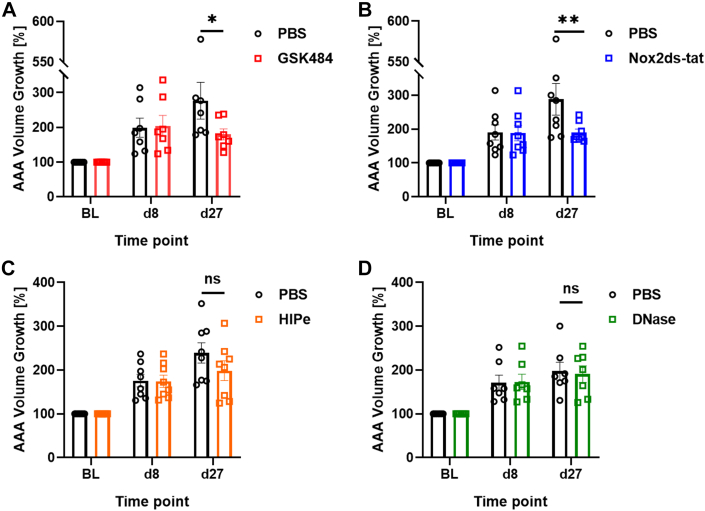
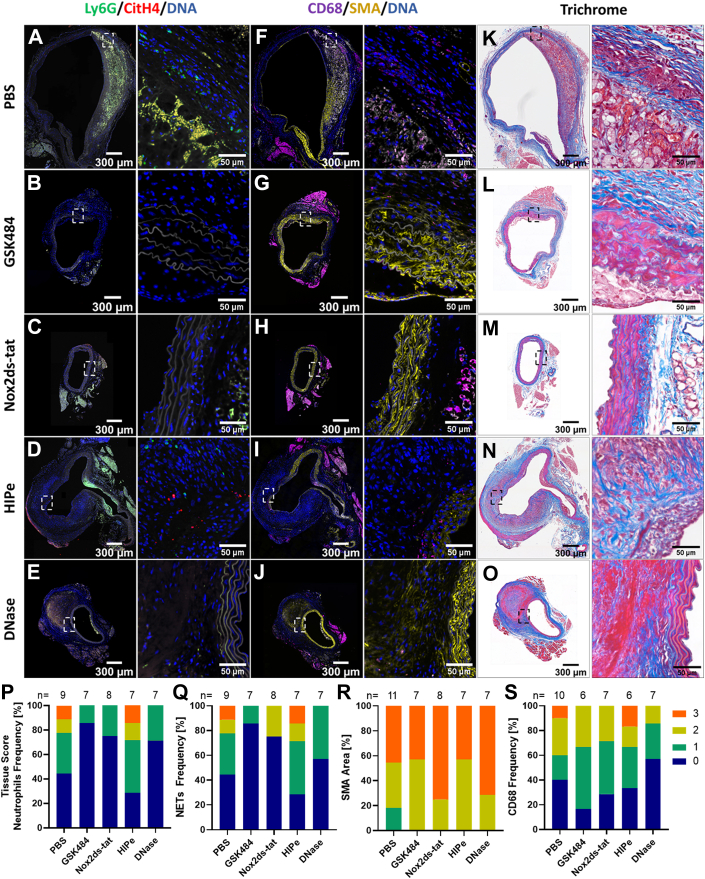
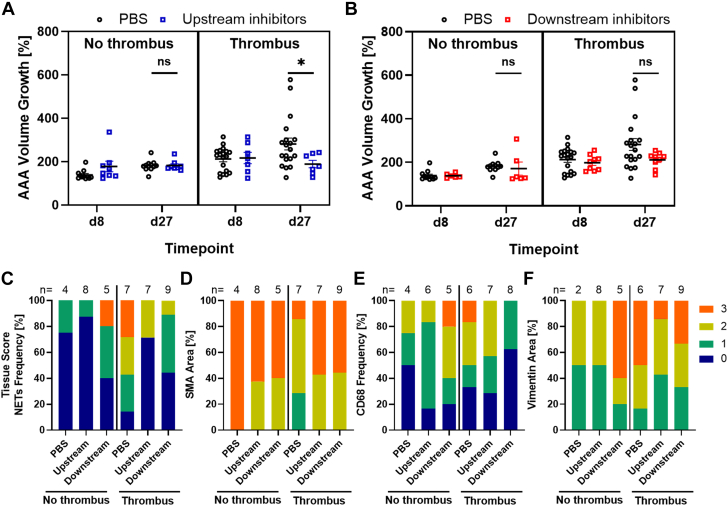
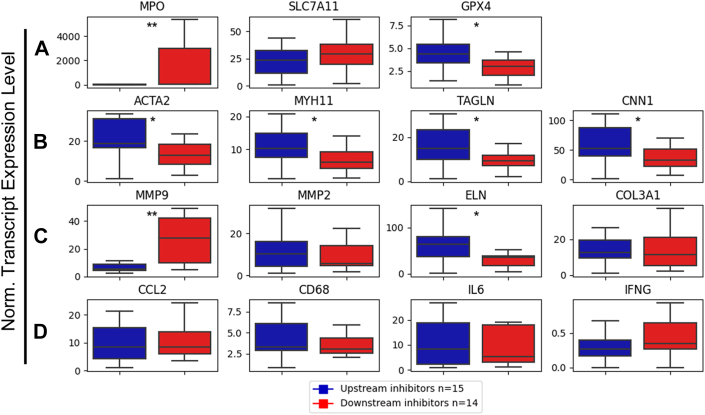
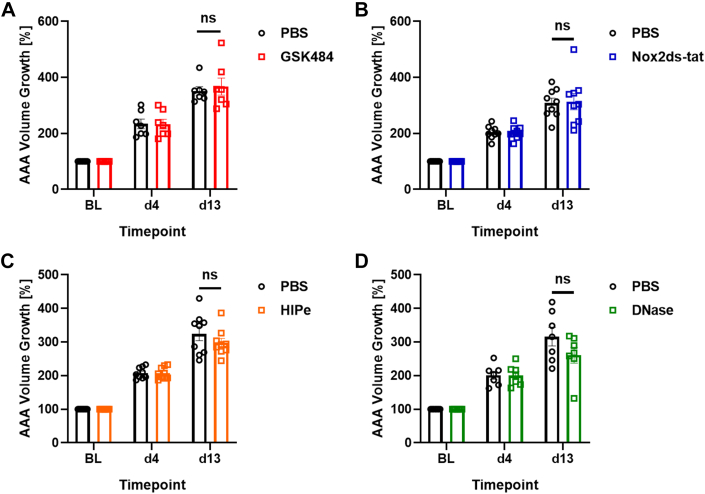
Neutrophil extracellular traps (NETs) are implicated in the pathogenesis of abdominal aortic aneurysm (AAA), located in adventitia and intraluminal thrombus. We compared the therapeutic potential of targeting upstream or downstream effector molecules of NET formation in 2 murine AAA models based on angiotensin II or peri-adventitial elastase application. In both models, NETs were detected in formed aneurysms at treatment start. Although NET inhibitors failed in the elastase model, they prevented progression of angiotensin II-induced aneurysms with thrombus, which resembles established human disease (including thrombus development). Blockade of upstream NET mediators was more effective than interference with downstream NET molecules.

Keywords: abdominal aortic aneurysm; mouse model; neutrophil extracellular trap; thrombus.


Conflict of interest statement

This research was funded in whole by the Austrian Science Fund (FWF) [F 5409-B21 issued to Dr Brostjan]. For the purpose of open access, the author has applied a CC BY public copyright license to any Author Accepted Manuscript version arising from this submission. Dr Bailey is personally supported by the British Heart Foundation (FS/18/12/33270) and Ms Knöbl by the DocFund program (DOC 59-833) of the Austrian Science Fund. The funders had no role in study design, data collection and analysis, decision to publish, or preparation of the manuscript. The authors have reported that they have no relationships relevant to the contents of this paper to disclose.

Figures

None
Graphical abstract
Figure 1
Figure 1
AAA Progression and NET Presence in the AngII Model (A) Abdominal aortic aneurysm (AAA) growth is expressed as percent increase of volume compared with baseline (BL = 100%). Quantification was conducted for the percentage of aortic area covered by citrullinated histone 4 (CitH4) (neutrophil extracellular trap [NET] area) (B), the number of Ly6G-positive neutrophils (C), and the number of Ly6G-positive and CitH4-positive neutrophils (NETosing neutrophils) per square millimeter of aortic area (D). (E) Suprarenal aortic sections from baseline, day 8 (d8), and day 28 (d28) were immunofluorescence stained for CitH4 (red), Ly6G (green), and DNA (blue); autofluorescence of elastin/collagen fibers is depicted in white. Consecutive sections were subjected to Masson’s trichrome stain, and representative ultrasound (US) images are given for the corresponding time points. AAA examples without or with (yellow dashed line) intramural thrombus are given for d28. Areas of interest are shown in zoomed images. N = 5 to 6 mice per time point. Values are presented as individual points with mean ± SEM (Wilcoxon rank sum test, ∗P < 0.05, ∗∗P < 0.01). AngII = angiotensin II.
Figure 2
Figure 2
AAA Progression and NET Presence in the EPPE Model (A) AAA growth is expressed as percent increase of aortic volume from BL (BL = 100%). The percentage of NET area (B), number of neutrophils (C), and NETosing neutrophils per square millimeter of aortic area (D) were quantitated. (E) Infrarenal aortic sections from baseline, day 4 (d4), and day 14 (d14) were stained for NETs: CitH4 (red), Ly6G (green), and DNA (blue). Autofluorescence of elastin and collagen fibers is depicted in white. Consecutive sections were subjected to Masson’s trichrome stain, and representative US images are given for the corresponding time points. Marked areas of interest are shown in zoomed images. N = 5 to 6 mice per time point. Values are presented as individual points with mean ± SEM. Wilcoxon rank sum test, ∗∗P < 0.01; EPPE = external porcine pancreatic elastase; other abbreviations as in Figure 1.
Figure 3
Figure 3
Upstream vs Downstream NET Inhibition in the AngII Model Mice of treatment and control (phosphate-buffered saline [PBS]) groups were matched 1:1 at day 8 for percent increase in aortic volume compared with BL (BL = 100%). Treatment was injected intravenously daily from day 9 to day 27 (d27). The upstream pathways of NET formation were targeted with GSK484 (n = 7) (A) and Nox2ds-tat (n = 8) (B). To inhibit the downstream products of NETs, histone inhibitory peptide (HIPe) (n = 8) (C) and DNase I (n = 7) (D) were administered. Values are presented as individual points with mean ± SEM. Group differences at d27 (Wilcoxon signed rank test) are marked by ∗P < 0.05, ∗∗P < 0.01. ns = not significant; other abbreviations as in Figure 1.
Figure 4
Figure 4
NET Accumulation at d28 in the AngII Model Suprarenal consecutive aortic sections from day 28 (d28) were stained for NETs (A-E) by CitH4 (red), Ly6G (green), and DNA (blue) immunofluorescence, while smooth muscle cells and macrophages (F to J) were visualized with smooth muscle alpha actin (SMA) (yellow), CD68 (magenta), and DNA (blue) staining; autofluorescence of elastin and collagen fibers is depicted in white. (K to O) Masson’s trichrome stain. Marked areas of interest are shown in zoomed images. Semiquantitative tissue scoring for the indicated number (n) of mice was performed for neutrophils (Ly6G) (P), NETs (CitH4) (Q), smooth muscle cells (SMCs) (SMA) (R), and macrophages (CD68) (S). Abbreviations as in Figures 1 and 3.
Figure 5
Figure 5
NET Inhibition in AngII Mice Without or With AAA-Associated Thrombus Mice were divided into subgroups based on intramural thrombus presence in three-dimensional ultrasound evaluation. AAA volume growth was recorded in percentage of BL (BL = 100%). Data of upstream inhibitors (GSK484 and Nox2ds-tat) were pooled (A), and data of downstream inhibitors (HIPe and DNase) were similarly pooled (B). Treatment groups were compared with the PBS cohort at d27 by using the Wilcoxon rank sum test (∗P < 0.05). Values are presented as individual points with mean ± SEM. Semi-quantitative tissue scoring (0-3) was performed for NETs (CitH4) (C), SMCs (SMA) (D), macrophages (CD68) (E), and vimentin (F). Abbreviations as in Figure 1, 3, and 4.
Figure 6
Figure 6
Impact of Upstream vs Downstream NET Inhibitors on Mediators of Inflammation, Matrix Remodeling, and SMC Transdifferentiation in the AngII Model Aneurysms from mice treated with upstream (n = 15) or downstream (n = 14) inhibitors of NET formation were subjected to RNA isolation, complementary DNA synthesis, and real-time polymerase chain reaction to evaluate transcript levels of genes involved in redox regulation or ferroptosis (A), smooth muscle cell differentiation (B), extracellular matrix remodeling (C), and inflammation (D). Supplemental Table 2 provides gene symbols, synonyms, and q polymerase chain reaction primer sources. Values are presented as box plots; P values are based on Wilcoxon rank sum test (∗P < 0.05, ∗∗P < 0.01). ACTA2 = alpha-smooth muscle actin (SMA); CCL2 = monocyte chemotactic protein 1 (MCP-1); CD68 = macrosialin; CNN1 = calponin 1; COL3A1 = collagen type III alpha 1; ECM = extracellular matrix; ELN = elastin; GPX4 = glutathione peroxidase 4; IL6 = interleukin 6; IFNG = interferon gamma; MMP = matrix metalloproteinase; MPO = myeloperoxidase; MYH11 = myosin (heavy chain) 11; SLC7A11 = solute carrier family 7 member 11; TAGLN = transgelin; other abbreviations as in Figures 1 and 4.
Figure 7
Figure 7
Upstream vs Downstream NET Inhibition in the EPPE Model Mice of treatment and control (PBS) groups were matched 1:1 at day 4 for percent increase in aortic volume compared with BL (BL = 100%). Treatment was injected intravenously daily from day 5 to day 13. NET formation was targeted with GSK484 (n = 7) (A), Nox2ds-tat (n = 9) (B), HIPe (n = 9) (C), and DNase I (n = 7) (D). Values are presented as individual points with mean ± SEM. Group differences at day 13 (Wilcoxon signed rank test) were not significant (ns). Abbreviations as in Figure 1, Figure 2, Figure 3, Figure 4.
Figure 8
Figure 8
NET Accumulation at d14 in the EPPE Model Infrarenal consecutive aorta sections from day 14 (d14) were stained for NETs (A-E) by CitH4 (red), Ly6G (green), and DNA (blue) immunofluorescence, while SMCs and macrophages (F-J) were visualized with SMA (yellow), CD68 (magenta), and DNA (blue) staining; autofluorescence of elastin and collagen fibers is depicted in white. (K-O) Masson’s trichrome stain. Marked areas of interest are shown in zoomed images. Semi-quantitative tissue scoring for the indicated number (n) of mice was performed for neutrophils (Ly6G) (P), NETs (CitH4) (Q), SMCs (SMA) (R), and macrophages (CD68) (S). Abbreviations as in Figure 1, Figure 2, Figure 3, Figure 4.

References

    1. Kessler V., Klopf J., Eilenberg W., Neumayer C., Brostjan C. AAA revisited: a comprehensive review of risk factors, management, and hallmarks of pathogenesis. Biomedicines. 2022;10:94. doi: 10.3390/BIOMEDICINES10010094. - DOI - PMC - PubMed
    1. Golledge J., Moxon J.V., Singh T.P., Bown M.J., Mani K., Wanhainen A. Lack of an effective drug therapy for abdominal aortic aneurysm. J Intern Med. 2020;288(1):6–22. doi: 10.1111/JOIM.12958. - DOI - PubMed
    1. Yuan Z., Lu Y., Wei J., Wu J., Yang J., Cai Z. Abdominal aortic aneurysm: roles of inflammatory cells. Front Immunol. 2021;11:3758. doi: 10.3389/fimmu.2020.609161. - DOI - PMC - PubMed
    1. Klopf J., Brostjan C., Neumayer C., Eilenberg W. Neutrophils as regulators and biomarkers of cardiovascular inflammation in the context of abdominal aortic aneurysms. Biomedicines. 2021;9(9):1236. doi: 10.3390/biomedicines9091236. - DOI - PMC - PubMed
    1. Eliason J.L., Hannawa K.K., Ailawadi G., et al. Neutrophil depletion inhibits experimental abdominal aortic aneurysm formation. Circulation. 2005;112(2):232–240. doi: 10.1161/CIRCULATIONAHA.104.517391. - DOI - PubMed

LinkOut - more resources