

Automatic assessment of disproportionately enlarged subarachnoid-space hydrocephalus from 3D MRI using two deep learning models
- PMID: 38560023
- PMCID: PMC10978765
- DOI: 10.3389/fnagi.2024.1362637
Automatic assessment of disproportionately enlarged subarachnoid-space hydrocephalus from 3D MRI using two deep learning models
Abstract
Background: Disproportionately enlarged subarachnoid-space hydrocephalus (DESH) is a key feature for Hakim disease (idiopathic normal pressure hydrocephalus: iNPH), but subjectively evaluated. To develop automatic quantitative assessment of DESH with automatic segmentation using combined deep learning models.
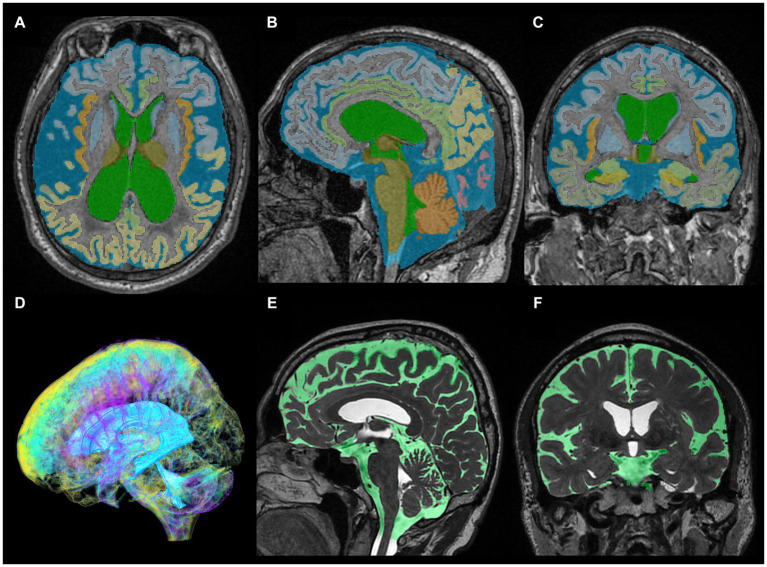
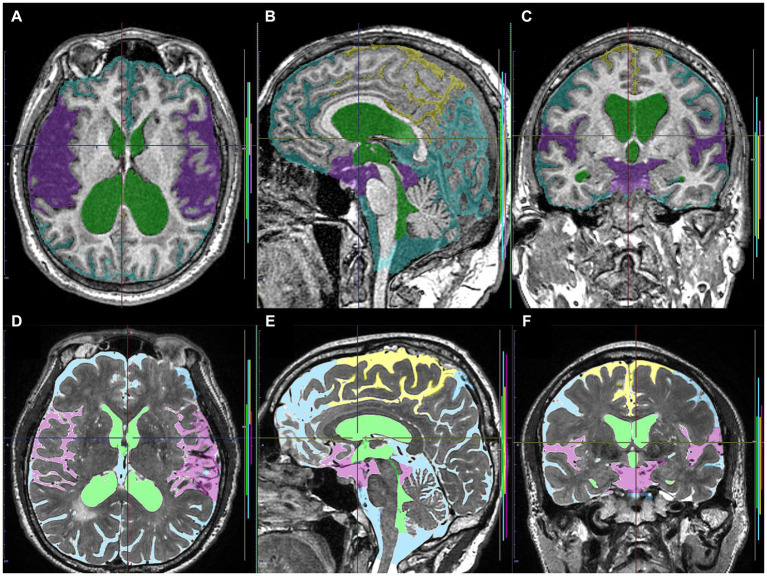
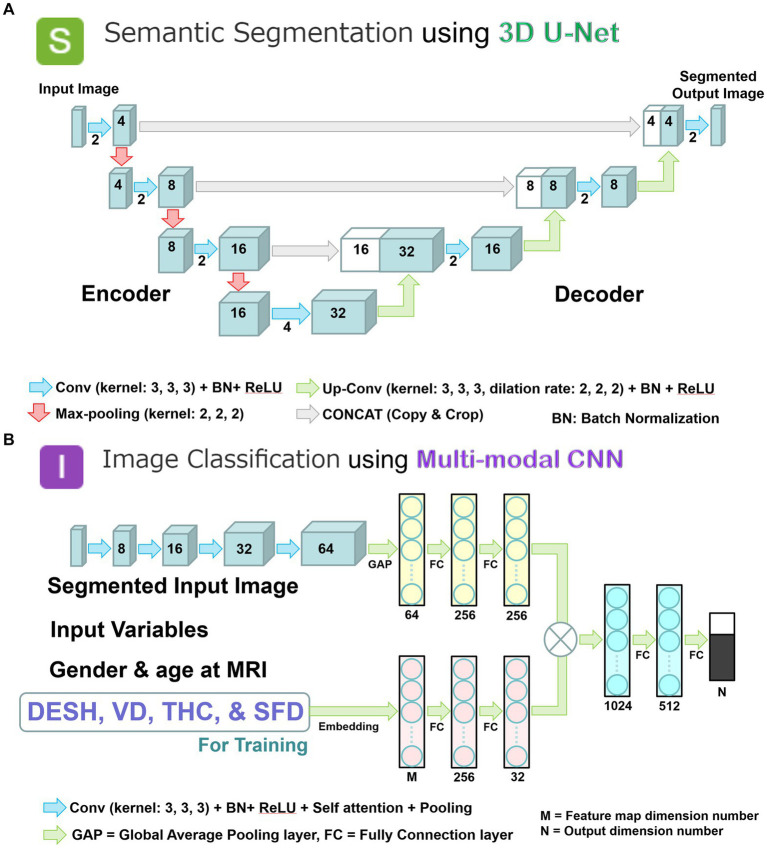
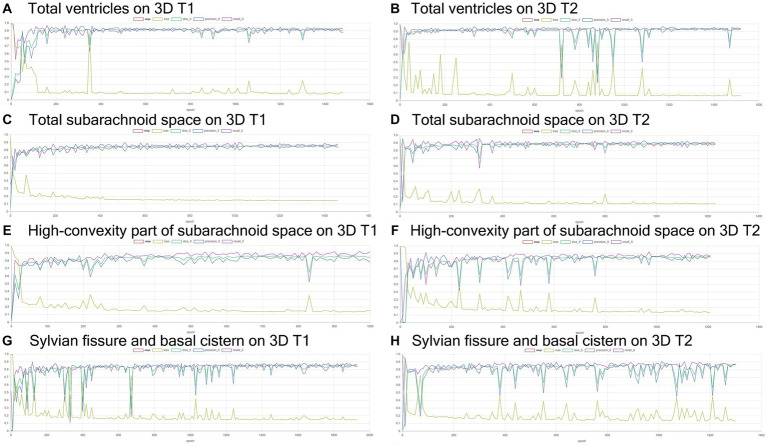
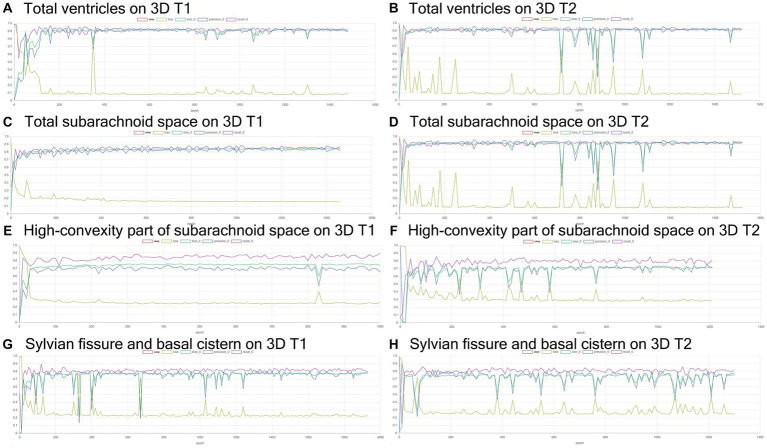
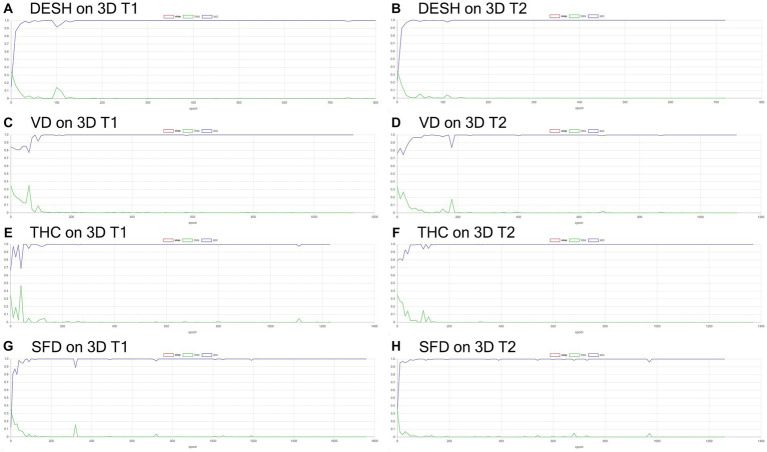
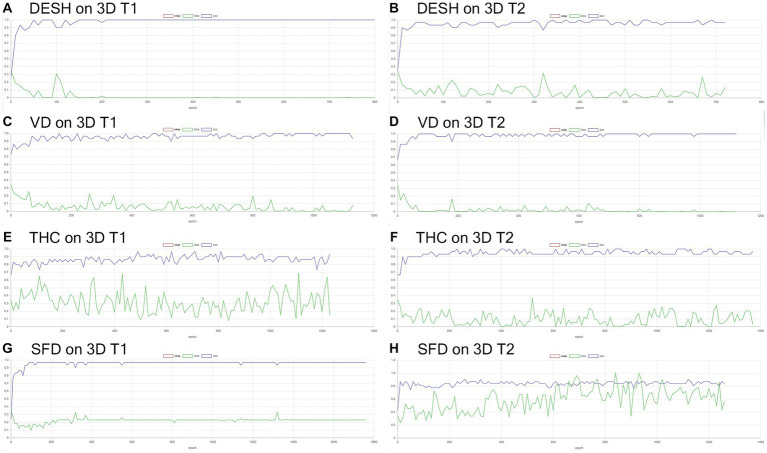
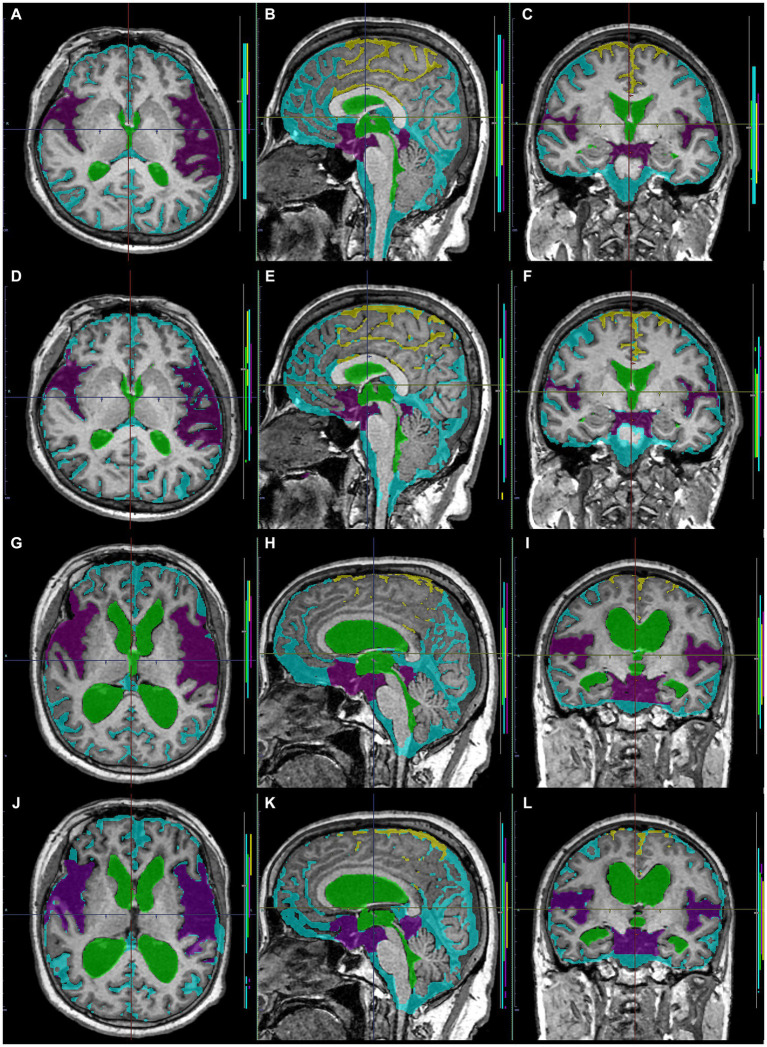
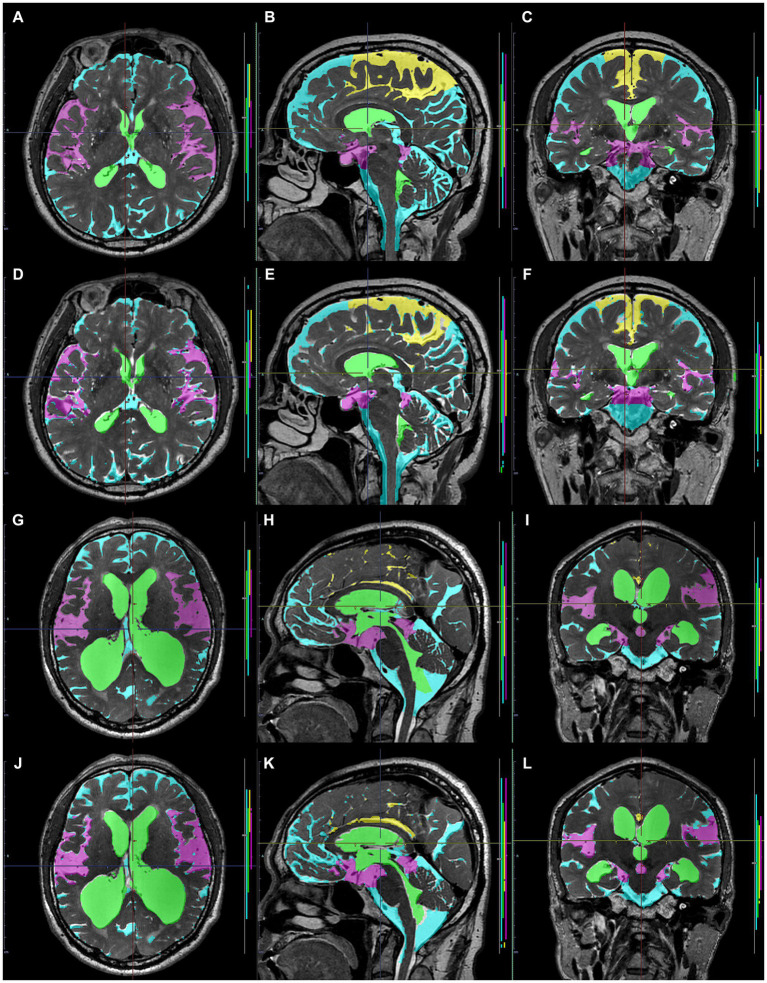
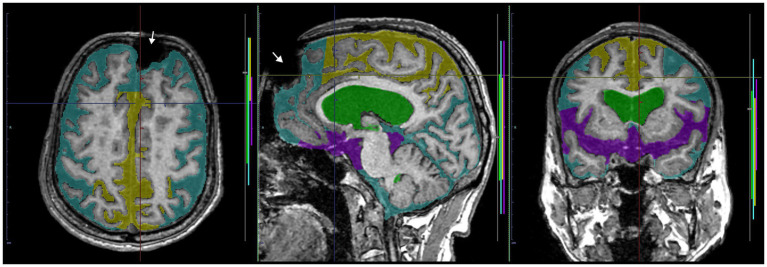
Methods: This study included 180 participants (42 Hakim patients, 138 healthy volunteers; 78 males, 102 females). Overall, 159 three-dimensional (3D) T1-weighted and 180 T2-weighted MRIs were included. As a semantic segmentation, 3D MRIs were automatically segmented in the total ventricles, total subarachnoid space (SAS), high-convexity SAS, and Sylvian fissure and basal cistern on the 3D U-Net model. As an image classification, DESH, ventricular dilatation (VD), tightened sulci in the high convexities (THC), and Sylvian fissure dilatation (SFD) were automatically assessed on the multimodal convolutional neural network (CNN) model. For both deep learning models, 110 T1- and 130 T2-weighted MRIs were used for training, 30 T1- and 30 T2-weighted MRIs for internal validation, and the remaining 19 T1- and 20 T2-weighted MRIs for external validation. Dice score was calculated as (overlapping area) × 2/total area.
Results: Automatic region extraction from 3D T1- and T2-weighted MRI was accurate for the total ventricles (mean Dice scores: 0.85 and 0.83), Sylvian fissure and basal cistern (0.70 and 0.69), and high-convexity SAS (0.68 and 0.60), respectively. Automatic determination of DESH, VD, THC, and SFD from the segmented regions on the multimodal CNN model was sufficiently reliable; all of the mean softmax probability scores were exceeded by 0.95. All of the areas under the receiver-operating characteristic curves of the DESH, Venthi, and Sylhi indexes calculated by the segmented regions for detecting DESH were exceeded by 0.97.
Conclusion: Using 3D U-Net and a multimodal CNN, DESH was automatically detected with automatically segmented regions from 3D MRIs. Our developed diagnostic support tool can improve the precision of Hakim disease (iNPH) diagnosis.
Keywords: MRI; artificial intelligence; chronic hydrocephalus in adults; deep learning; disproportionately enlarged subarachnoid-space hydrocephalus; hakim disease; idiopathic normal pressure hydrocephalus; tightened sulci in high convexities.
Copyright © 2024 Yamada, Ito, Matsumasa, Ii, Otani, Tanikawa, Iseki, Watanabe, Wada, Oshima and Mase.
Conflict of interest statement
SY received speakers’ honoraria from Fujifilm Medical Systems. HI and HM are employed by the FUJIFILM Corporation and made substantial contributions to the development of the applications of the SYNAPSE 3D workstation. The remaining authors declare that the research was conducted in the absence of any commercial or financial relationships that could be construed as a potential conflict of interest.
Figures
Similar articles
-
Automated detection of imaging features of disproportionately enlarged subarachnoid space hydrocephalus using machine learning methods.Neuroimage Clin. 2019;21:101605. doi: 10.1016/j.nicl.2018.11.015. Epub 2018 Nov 19. Neuroimage Clin. 2019. PMID: 30497983 Free PMC article.
-
Tightened Sulci in the High Convexities as a Noteworthy Feature of Idiopathic Normal Pressure Hydrocephalus.World Neurosurg. 2023 Aug;176:e427-e437. doi: 10.1016/j.wneu.2023.05.077. Epub 2023 May 26. World Neurosurg. 2023. PMID: 37245671
-
Utility of MRI-based disproportionately enlarged subarachnoid space hydrocephalus scoring for predicting prognosis after surgery for idiopathic normal pressure hydrocephalus: clinical research.J Neurosurg. 2017 Dec;127(6):1436-1442. doi: 10.3171/2016.9.JNS161080. Epub 2017 Feb 3. J Neurosurg. 2017. PMID: 28156249
-
Neuroimaging of Adult Hydrocephalus.Neurosurg Clin N Am. 2025 Apr;36(2):183-197. doi: 10.1016/j.nec.2024.11.007. Epub 2025 Jan 24. Neurosurg Clin N Am. 2025. PMID: 40054972 Review.
-
[Hypothesis of cerebrospinal fluid formation and absorption: from the clinical viewpoint of idiopathic normal pressure hydrocephalus].Rinsho Shinkeigaku. 2014;54(12):1190-2. doi: 10.5692/clinicalneurol.54.1190. Rinsho Shinkeigaku. 2014. PMID: 25672742 Review. Japanese.
Cited by
-
Regional brain volume changes in Hakim's disease versus Alzheimer's and mild cognitive impairment.Brain Commun. 2025 Mar 26;7(2):fcaf122. doi: 10.1093/braincomms/fcaf122. eCollection 2025. Brain Commun. 2025. PMID: 40235958 Free PMC article.
-
Deep learning for hydrocephalus prognosis: Advances, challenges, and future directions: A review.Medicine (Baltimore). 2025 Jun 27;104(26):e43082. doi: 10.1097/MD.0000000000043082. Medicine (Baltimore). 2025. PMID: 40587678 Free PMC article. Review.
-
qDESH: a method to quantify disproportionately enlarged subarachnoid space hydrocephalus.Fluids Barriers CNS. 2025 Jul 1;22(1):67. doi: 10.1186/s12987-025-00677-2. Fluids Barriers CNS. 2025. PMID: 40597328 Free PMC article.
References
-
- Constantinescu C., Wikkelsø C., Westman E., Ziegelitz D., Jaraj D., Rydén L., et al. . (2023). Prevalence of possible idiopathic Normal pressure hydrocephalus in Sweden: a population-based MRI study in 791 70-year-old participants. Neurology 102, 1–9. doi: 10.1212/WNL.0000000000208037 - DOI - PMC - PubMed
LinkOut - more resources
Full Text Sources
Research Materials