Theta-frequency medial septal nucleus deep brain stimulation increases neurovascular activity in MK-801-treated mice
- PMID: 38560047
- PMCID: PMC10978728
- DOI: 10.3389/fnins.2024.1372315
Theta-frequency medial septal nucleus deep brain stimulation increases neurovascular activity in MK-801-treated mice
Abstract
Introduction: Deep brain stimulation (DBS) has shown remarkable success treating neurological and psychiatric disorders including Parkinson's disease, essential tremor, dystonia, epilepsy, and obsessive-compulsive disorder. DBS is now being explored to improve cognitive and functional outcomes in other psychiatric conditions, such as those characterized by reduced N-methyl-D-aspartate (NMDA) function (i.e., schizophrenia). While DBS for movement disorders generally involves high-frequency (>100 Hz) stimulation, there is evidence that low-frequency stimulation may have beneficial and persisting effects when applied to cognitive brain networks.
Methods: In this study, we utilize a novel technology, functional ultrasound imaging (fUSI), to characterize the cerebrovascular impact of medial septal nucleus (MSN) DBS under conditions of NMDA antagonism (pharmacologically using Dizocilpine [MK-801]) in anesthetized male mice.
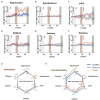
Results: Imaging from a sagittal plane across a variety of brain regions within and outside of the septohippocampal circuit, we find that MSN theta-frequency (7.7 Hz) DBS increases hippocampal cerebral blood volume (CBV) during and after stimulation. This effect was not present using standard high-frequency stimulation parameters [i.e., gamma (100 Hz)].
Discussion: These results indicate the MSN DBS increases circuit-specific hippocampal neurovascular activity in a frequency-dependent manner and does so in a way that continues beyond the period of electrical stimulation.
Keywords: MK-801; deep brain stimulation; functional ultrasound imaging; hippocampus; medial septal nucleus; schizophrenia; theta.
Copyright © 2024 Crown, Agyeman, Choi, Zepeda, Iseri, Pahlavan, Siegel, Liu, Christopoulos and Lee.
Conflict of interest statement
The authors declare that the research was conducted in the absence of any commercial or financial relationships that could be construed as a potential conflict of interest. The author(s) declared that they were an editorial board member of Frontiers, at the time of submission. This had no impact on the peer review process and the final decision.
Figures


Similar articles
-
Frequency-specific medial septal nucleus deep brain stimulation improves spatial memory in MK-801-treated male rats.Neurobiol Dis. 2022 Aug;170:105756. doi: 10.1016/j.nbd.2022.105756. Epub 2022 May 16. Neurobiol Dis. 2022. PMID: 35584727 Free PMC article.
-
Deep brain stimulation of the medial septum or nucleus accumbens alleviates psychosis-relevant behavior in ketamine-treated rats.Behav Brain Res. 2014 Jun 1;266:174-82. doi: 10.1016/j.bbr.2014.03.010. Epub 2014 Mar 12. Behav Brain Res. 2014. PMID: 24632470
-
Septohippocampal Neuromodulation Improves Cognition after Traumatic Brain Injury.J Neurotrauma. 2015 Nov 15;32(22):1822-32. doi: 10.1089/neu.2014.3744. Epub 2015 Sep 2. J Neurotrauma. 2015. PMID: 26096267 Free PMC article.
-
Evidence supporting deep brain stimulation of the medial septum in the treatment of temporal lobe epilepsy.Epilepsia. 2022 Sep;63(9):2192-2213. doi: 10.1111/epi.17326. Epub 2022 Jun 29. Epilepsia. 2022. PMID: 35698897 Review.
-
Current perspectives on deep brain stimulation for severe neurological and psychiatric disorders.Neuropsychiatr Dis Treat. 2015 Apr 9;11:1051-66. doi: 10.2147/NDT.S46583. eCollection 2015. Neuropsychiatr Dis Treat. 2015. PMID: 25914538 Free PMC article. Review.
Cited by
-
Functional ultrasound imaging and prewhitening analysis reveal MK-801-induced disruption of brain network connectivity.Front Pharmacol. 2025 Jun 3;16:1562102. doi: 10.3389/fphar.2025.1562102. eCollection 2025. Front Pharmacol. 2025. PMID: 40529501 Free PMC article.
-
Comparative evaluation of image registration techniques in functional ultrasound imaging.Imaging Neurosci (Camb). 2025 Jun 20;3:IMAG.a.47. doi: 10.1162/IMAG.a.47. eCollection 2025. Imaging Neurosci (Camb). 2025. PMID: 40800915 Free PMC article.
References
-
- Agnesi F., Johnson M. D., Vitek J. L. (2013). “Chapter 4 - deep brain stimulation: how does it work?” in Handbook of clinical neurology brain stimulation. eds. Lozano A. M., Hallett M. (Amsterdam, Netherlands: Elsevier; ), 39–54. - PubMed
Grants and funding
LinkOut - more resources
Full Text Sources
Research Materials
Miscellaneous

