

Spatial distribution and hydrogeochemical evaluations of groundwater and its suitability for drinking and irrigation purposes in kaligonj upazila of satkhira district of Bangladesh
- PMID: 38560260
- PMCID: PMC10979076
- DOI: 10.1016/j.heliyon.2024.e27857
Spatial distribution and hydrogeochemical evaluations of groundwater and its suitability for drinking and irrigation purposes in kaligonj upazila of satkhira district of Bangladesh
Abstract
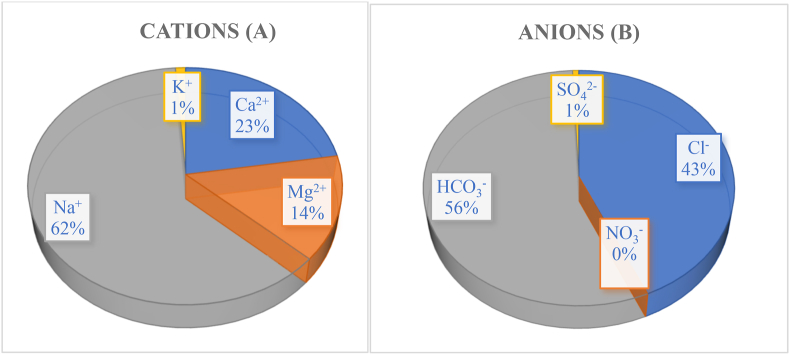
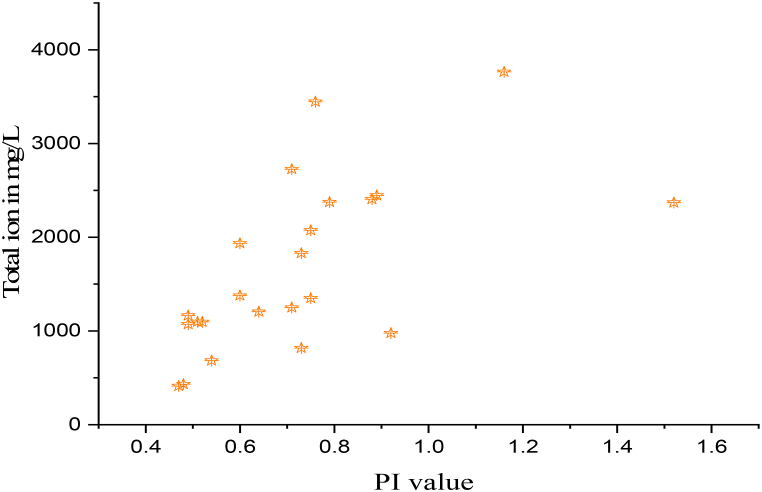
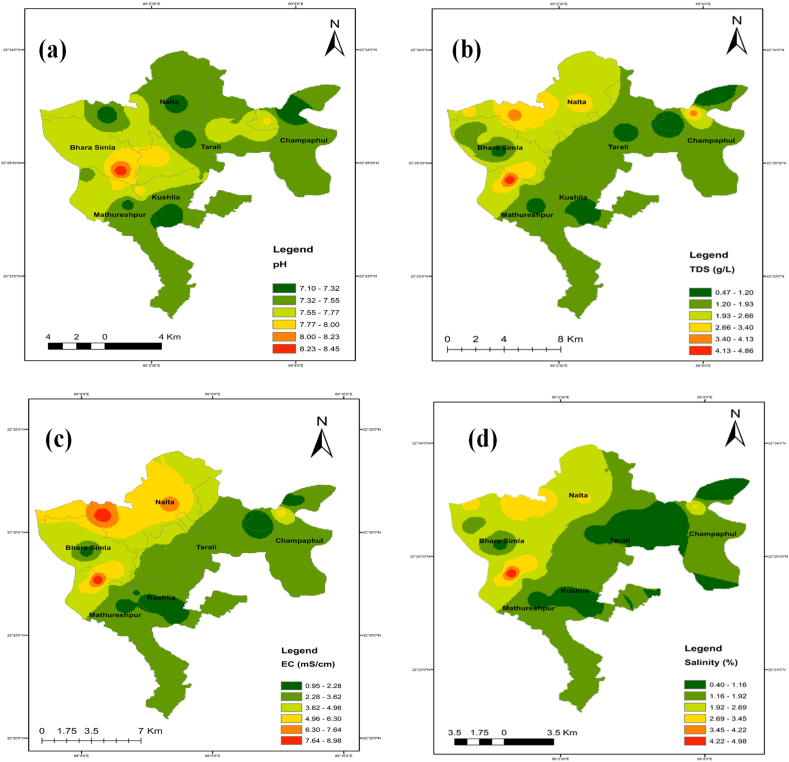
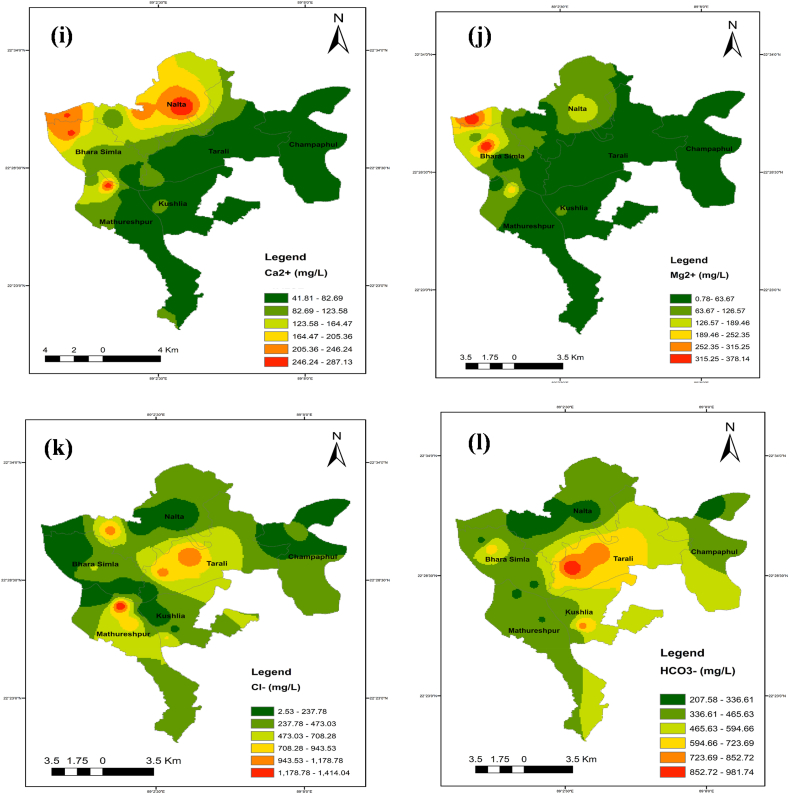
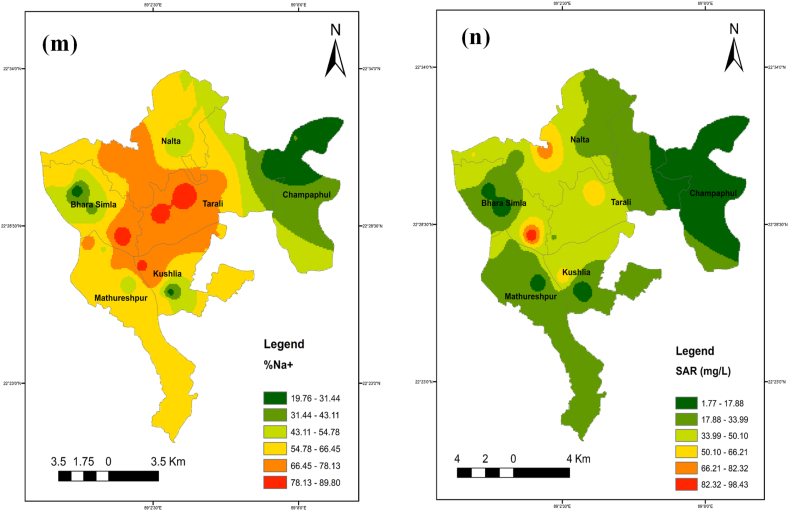
Groundwater is a significant water resource for drinking and irrigation in Satkhira district, Bangladesh. The depletion of groundwater resources and deterioration in its quality are the results of the confluence of factors such as industrialization, intensive irrigation, and rapid population growth. For this reason, this study focused on the evaluation of tubewell water of six unions of Kaligonj upazila in Satkhira district, which is situated in the coastal southwest part of Bangladesh. Major and trace elemental concentrations were assimilated into positive matrix factorization (PMF) to identify potential sources and their respective contributions. Principal component analysis (PCA) revealed that groundwater salinization and manmade activities were the primary causes of heavy metals in the coastal groundwater. Its average pH value was found to be 7.5, while Dissolved oxygen, Total dissolved solids, salinity, and conductivity, with values ranging from 1.18 to 7.38 mg/L, 0.5-4.88 g/L, 0.4-5%, and 0.95 to 8.56 mS/cm, respectively. The total hardness average value was 561.7 mg/L, classified into the very hard water categories, which is why 90% of the tubewell water samples were unfit for household purposes. All samples had an excessive level of arsenic present. The iron concentration of fifteen (15) samples crossed the standard limit according to WHO 2011 value. Around 63% of the samples were of the Na+-K+-Cl--SO42- type, and about 72% were sodium-potassium and alkali types. 98% of samples were covered in chloride and bicarbonate. The findings showed that 45.83% of the groundwater samples had negative Chloroalkaline index (CAIs), while 54.16% had positive. The permeability index (PI) was an average of 73%, and residual sodium carbonate (RSC) averaged 260.2 mg/L, and the findings clearly showed that 80% of the samples weren't appropriate for irrigation. According to the sodium adsorption ratio (SAR) value, 65% of the samples fell into the unsuitable category. These calculations indicated a high overall salinity hazard in the study area, which may be caused by the intrusion of sea water given that the study area is close to the coastal region. Findings compared to standards revealed that the majority of the samples were deemed unfit for drinking and irrigation purposes. Hence, additional attention must be paid to this area to ensure the availability of drinkable water and to preserve sustainable farming practices.
Keywords: Hydrochemistry; Irrigation suitability; Multivariate statistical analysis; Salinity; Spatial distribution; Water quality index.
© 2024 The Authors.
Conflict of interest statement
The authors declare that they have no known competing financial interests or personal relationships that could have appeared to influence the work reported in this paper.
Figures


Similar articles
-
Deployment of entropy information theory in the Indian Sundarban region using hydrogeochemical parameters and GIS for assessment of irrigation suitability.Environ Monit Assess. 2023 Sep 19;195(10):1227. doi: 10.1007/s10661-023-11847-w. Environ Monit Assess. 2023. PMID: 37725200
-
Chemometric appraisal of water quality for domestic and agricultural purposes: a case study from establishing Rooppur Nuclear Power Plant (NPP) area, Pabna District, Bangladesh.Environ Sci Pollut Res Int. 2022 Aug;29(37):56620-56641. doi: 10.1007/s11356-022-19308-6. Epub 2022 Mar 26. Environ Sci Pollut Res Int. 2022. PMID: 35347605
-
Assessment of coastal river water quality in Bangladesh: Implications for drinking and irrigation purposes.PLoS One. 2024 Apr 18;19(4):e0300878. doi: 10.1371/journal.pone.0300878. eCollection 2024. PLoS One. 2024. PMID: 38635835 Free PMC article.
-
Appraising water resources for irrigation and spatial analysis based on fuzzy logic model in the tribal-prone areas of Bangladesh.Environ Monit Assess. 2024 Jun 21;196(7):641. doi: 10.1007/s10661-024-12799-5. Environ Monit Assess. 2024. PMID: 38904844
-
Groundwater pollution index (GPI) and GIS-based appraisal of groundwater quality for drinking and irrigation in coastal aquifers of Tiruchendur, South India.Environ Sci Pollut Res Int. 2021 Jun;28(23):29056-29074. doi: 10.1007/s11356-021-12702-6. Epub 2021 Feb 6. Environ Sci Pollut Res Int. 2021. PMID: 33550554
Cited by
-
Investigation of groundwater and its seasonal variation in a rural region in Natore, Bangladesh.Heliyon. 2024 Jun 14;10(12):e32991. doi: 10.1016/j.heliyon.2024.e32991. eCollection 2024 Jun 30. Heliyon. 2024. PMID: 38994105 Free PMC article.
-
Interpolation methods for spatial distribution of groundwater mapping electrical conductivity.Sci Rep. 2024 Dec 5;14(1):30337. doi: 10.1038/s41598-024-81893-y. Sci Rep. 2024. PMID: 39638822 Free PMC article.
References
-
- Li Z., Wang G., Wang X., Wan L., Shi Z., Wanke H., Uugulu S., Uahengo C.-I. Groundwater quality and associated hydrogeochemical processes in Northwest Namibia. J. Geochem. Explor. 2018;186:202–214. doi: 10.1016/j.gexplo.2017.12.015. - DOI
-
- Sefelnasr A., Gossel W., Wycisk P. Groundwater management options in an arid environment: the nubian sandstone aquifer system, eastern sahara. J. Arid Environ. 2015;122:46–58. doi: 10.1016/j.jaridenv.2015.06.009. - DOI
-
- Zhu L., Gong H., Li X., Wang R., Chen B., Dai Z., Teatini P. Land subsidence due to groundwater withdrawal in the northern Beijing plain. China. Eng. Geol. 2015;193:243–255. doi: 10.1016/j.enggeo.2015.04.020. - DOI
-
- Shammi M., Rahman R., Karmakar B., Rahman M.M., Moniruzzaman M., Uddin M.K. Assessment of salinity hazard of the irrigation water quality of Gopalganj District, Bangladesh. Int. J. Plant. Anim. Environ. Sci. 2015;5(4):233–245.
-
- Shammi M., Karmakar B., Rahman M.M., Islam M.S., Rahman R., Uddin M.K. Assessment of salinity hazard of irrigation water quality in monsoon season of Batiaghata Upazila, Khulna District, Bangladesh and adaptation strategies. Pollution. 2016;2(2):183–197. doi: 10.7508/pj.2016.02.007. - DOI
LinkOut - more resources
Full Text Sources
Research Materials
Miscellaneous
